Paper Menu >>
Journal Menu >>
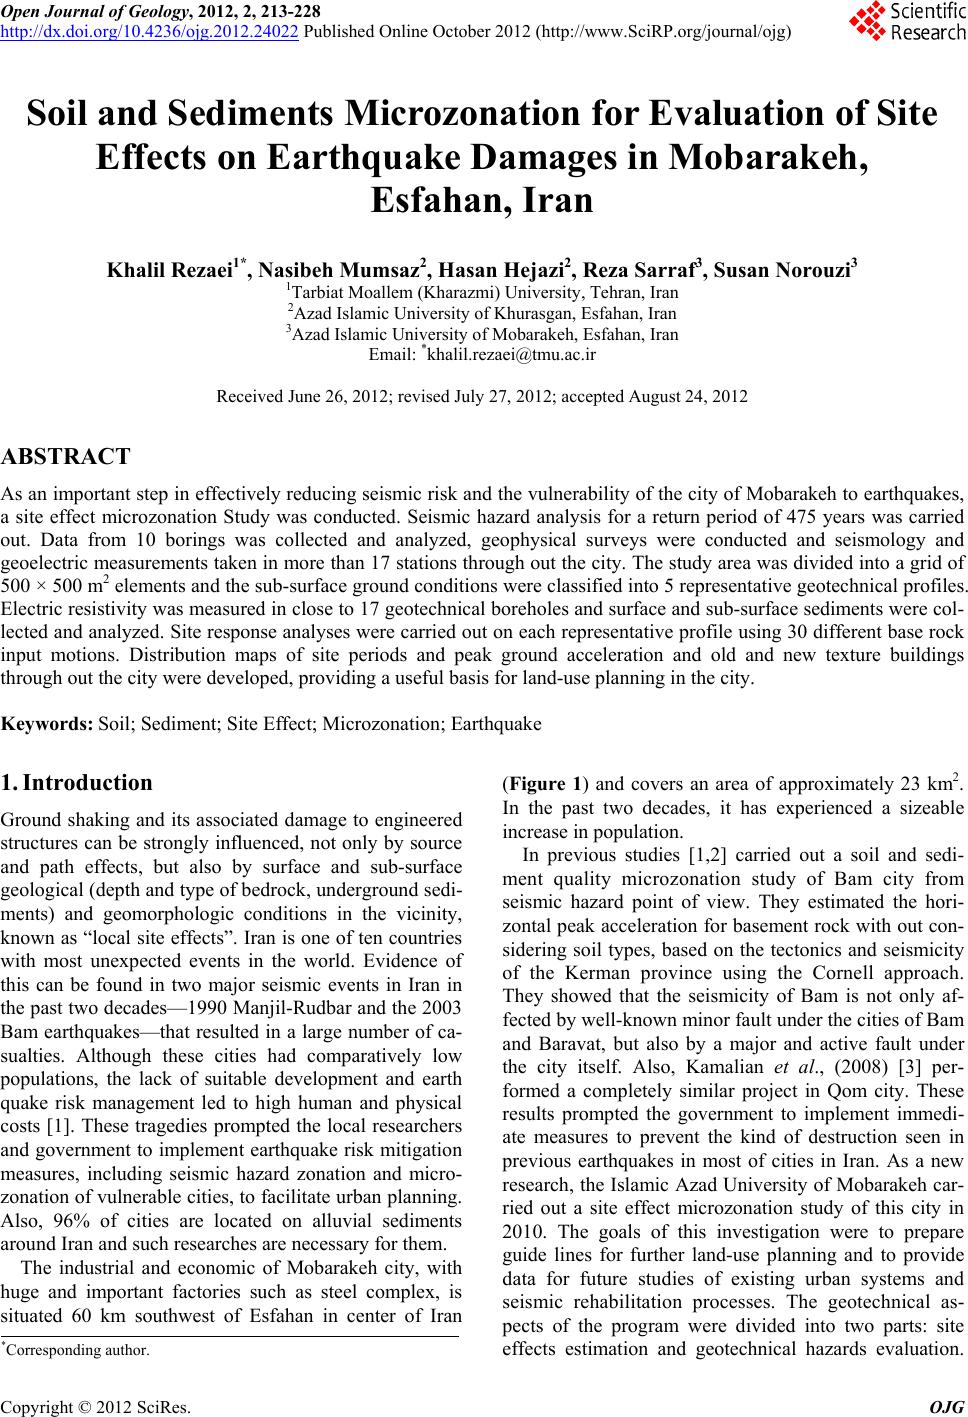 Open Journal of Geology, 2012, 2, 213-228 http://dx.doi.org/10.4236/ojg.2012.24022 Published Online October 2012 (http://www.SciRP.org/journal/ojg) Soil and Sediments Microzonation for Evaluation of Site Effects on Earthquake Damages in Mobarakeh, Esfahan, Iran Khalil Rezaei1*, Nasibeh Mumsaz2, Hasan Hejazi2, Reza Sarraf3, Susan Norouzi3 1Tarbiat Moallem (Kharazmi) University, Tehran, Iran 2Azad Islamic University of Khurasgan, Esfahan, Iran 3Azad Islamic University of Mobarakeh, Esfahan, Iran Email: *khalil.rezaei@tmu.ac.ir Received June 26, 2012; revised July 27, 2012; accepted August 24, 2012 ABSTRACT As an important step in effectively reducing seismic risk and the vulnerability of the city of Mobarakeh to earthquakes, a site effect microzonation Study was conducted. Seismic hazard analysis for a return period of 475 years was carried out. Data from 10 borings was collected and analyzed, geophysical surveys were conducted and seismology and geoelectric measurements taken in more than 17 stations through out the city. The study area was divided into a grid of 500 × 500 m2 elements and the sub-surface ground conditions were classified into 5 representative geotechnical profiles. Electric resistivity was measured in close to 17 geotechnical boreholes and surface and sub-surface sediments were col- lected and analyzed. Site response analyses were carried out on each representative profile using 30 different base rock input motions. Distribution maps of site periods and peak ground acceleration and old and new texture buildings through out the city were developed, providing a useful basis for land-use planning in the city. Keywords: Soil; Sediment; Site Effect; Microzonation; Earthquake 1. Introduction Ground shaking and its associated damage to engineered structures can be strongly influenced, not only by source and path effects, but also by surface and sub-surface geological (depth and type of bedrock, underground sedi- ments) and geomorphologic conditions in the vicinity, known as “local site effects”. Iran is one of ten countries with most unexpected events in the world. Evidence of this can be found in two major seismic events in Iran in the past two decades—1990 Manjil-Rudbar and the 2003 Bam earthquakes—that resulted in a large number of ca- sualties. Although these cities had comparatively low populations, the lack of suitable development and earth quake risk management led to high human and physical costs [1]. These tragedies prompted the local researchers and government to implement earthquake risk mitigation measures, including seismic hazard zonation and micro- zonation of vulnerable cities, to facilitate urban planning. Also, 96% of cities are located on alluvial sediments around Iran and such researches are necessary for them. The industrial and economic of Mobarakeh city, with huge and important factories such as steel complex, is situated 60 km southwest of Esfahan in center of Iran (Figure 1) and covers an area of approximately 23 km2. In the past two decades, it has experienced a sizeable increase in population. In previous studies [1,2] carried out a soil and sedi- ment quality microzonation study of Bam city from seismic hazard point of view. They estimated the hori- zontal peak acceleration for basement rock with out con- sidering soil types, based on the tectonics and seismicity of the Kerman province using the Cornell approach. They showed that the seismicity of Bam is not only af- fected by well-known minor fault under the cities of Bam and Baravat, but also by a major and active fault under the city itself. Also, Kamalian et al., (2008) [3] per- formed a completely similar project in Qom city. These results prompted the government to implement immedi- ate measures to prevent the kind of destruction seen in previous earthquakes in most of cities in Iran. As a new research, the Islamic Azad University of Mobarakeh car- ried out a site effect microzonation study of this city in 2010. The goals of this investigation were to prepare guide lines for further land-use planning and to provide data for future studies of existing urban systems and seismic rehabilitation processes. The geotechnical as- pects of the program were divided into two parts: site effects estimation and geotechnical hazards evaluation. *Corresponding author. C opyright © 2012 SciRes. OJG 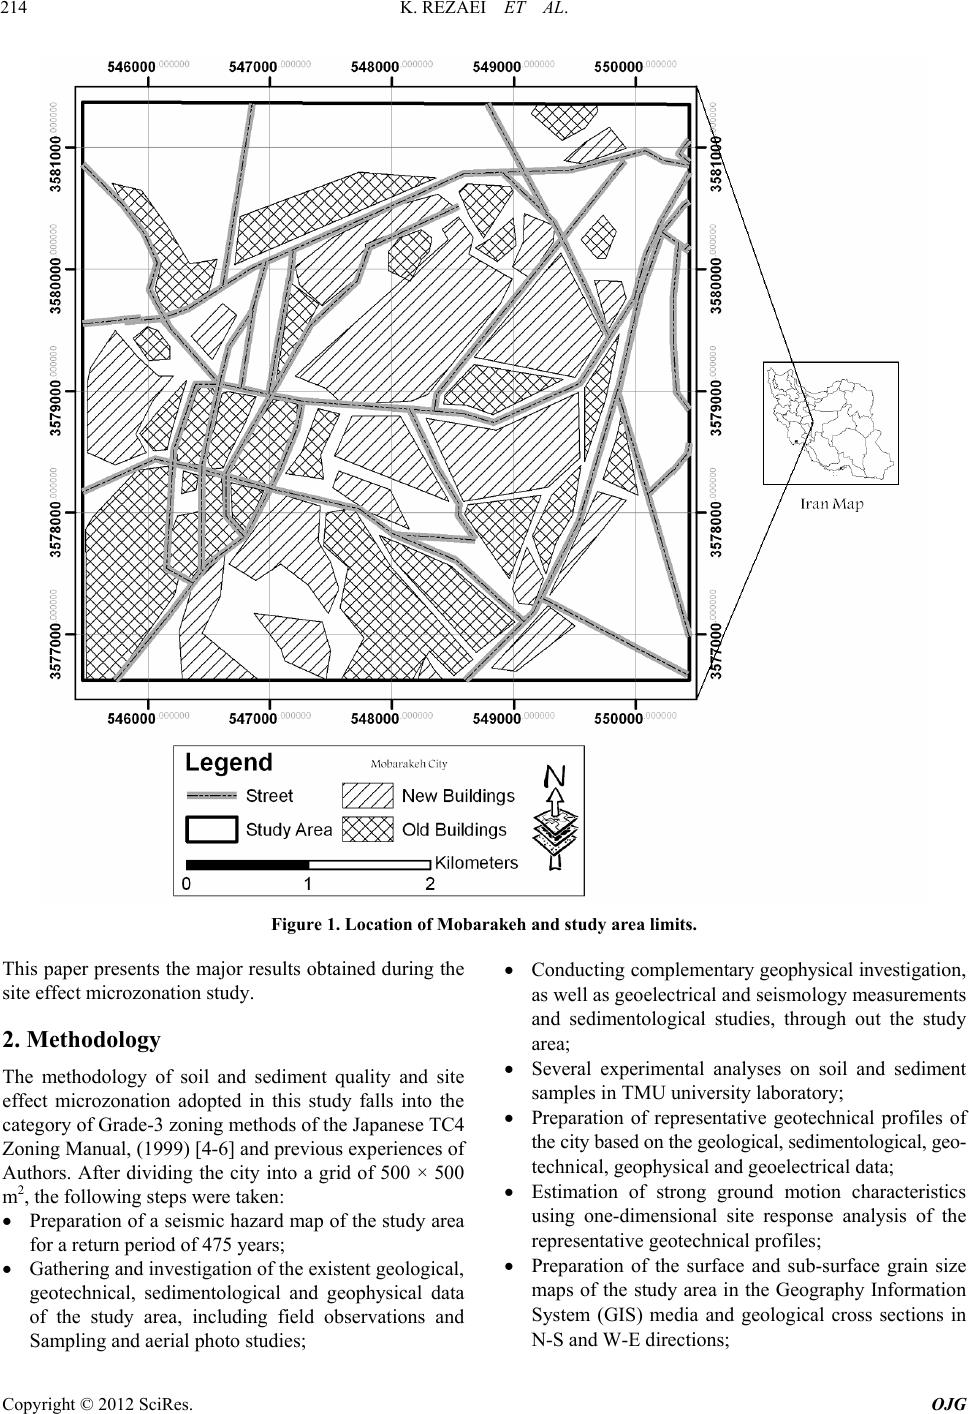 K. REZAEI ET AL. 214 Figure 1. Location of Mobarakeh and study area limits. This paper presents the major results obtained during the site effect microzonation study. 2. Methodology The methodology of soil and sediment quality and site effect microzonation adopted in this study falls into the category of Grade-3 zoning methods of the Japanese TC4 Zoning Manual, (1999) [4-6] and previous experiences of Authors. After dividing the city into a grid of 500 × 500 m2, the following steps were taken: Preparation of a seismic hazard map of the study area for a return period of 475 years; Gathering and investigation of the existent geological, geotechnical, sedimentological and geophysical data of the study area, including field observations and Sampling and aerial photo studies; Conducting complementary geophysical investigation, as well as geoelectrical and seismology measurements and sedimentological studies, through out the study area; Several experimental analyses on soil and sediment samples in TMU university laboratory; Preparation of representative geotechnical profiles of the city based on the geological, sedimentological, geo- technical, geophysical and geoelectrical data; Estimation of strong ground motion characteristics using one-dimensional site response analysis of the representative geotechnical profiles; Preparation of the surface and sub-surface grain size maps of the study area in the Geography Information System (GIS) media and geological cross sections in N-S and W-E directions; Copyright © 2012 SciRes. OJG 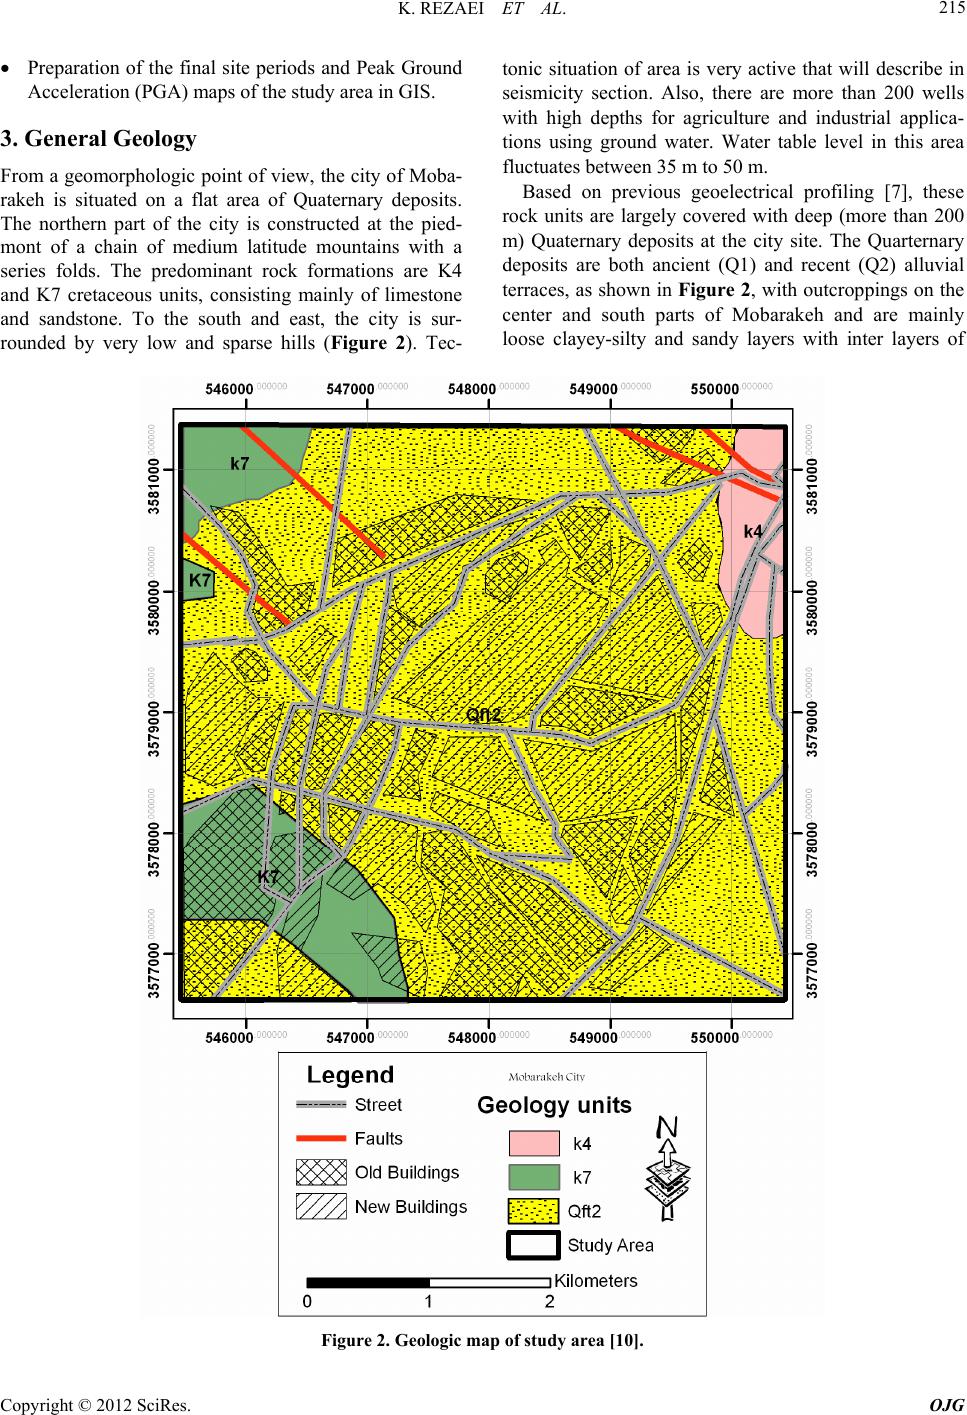 K. REZAEI ET AL. 215 Preparation of the final site periods and Peak Ground Acceleration (PGA) maps of the study area in GIS. 3. General Geology From a geomorphologic point of view, the city of Moba- rakeh is situated on a flat area of Quaternary deposits. The northern part of the city is constructed at the pied- mont of a chain of medium latitude mountains with a series folds. The predominant rock formations are K4 and K7 cretaceous units, consisting mainly of limestone and sandstone. To the south and east, the city is sur- rounded by very low and sparse hills (Figure 2). Tec- tonic situation of area is very active that will describe in seismicity section. Also, there are more than 200 wells with high depths for agriculture and industrial applica- tions using ground water. Water table level in this area fluctuates between 35 m to 50 m. Based on previous geoelectrical profiling [7], these rock units are largely covered with deep (more than 200 m) Quaternary deposits at the city site. The Quarternary deposits are both ancient (Q1) and recent (Q2) alluvial terraces, as shown in Figure 2, with outcroppings on the center and south parts of Mobarakeh and are mainly loose clayey-silty and sandy layers with inter layers of Figure 2. Geologic map of study area [10]. Copyright © 2012 SciRes. OJG 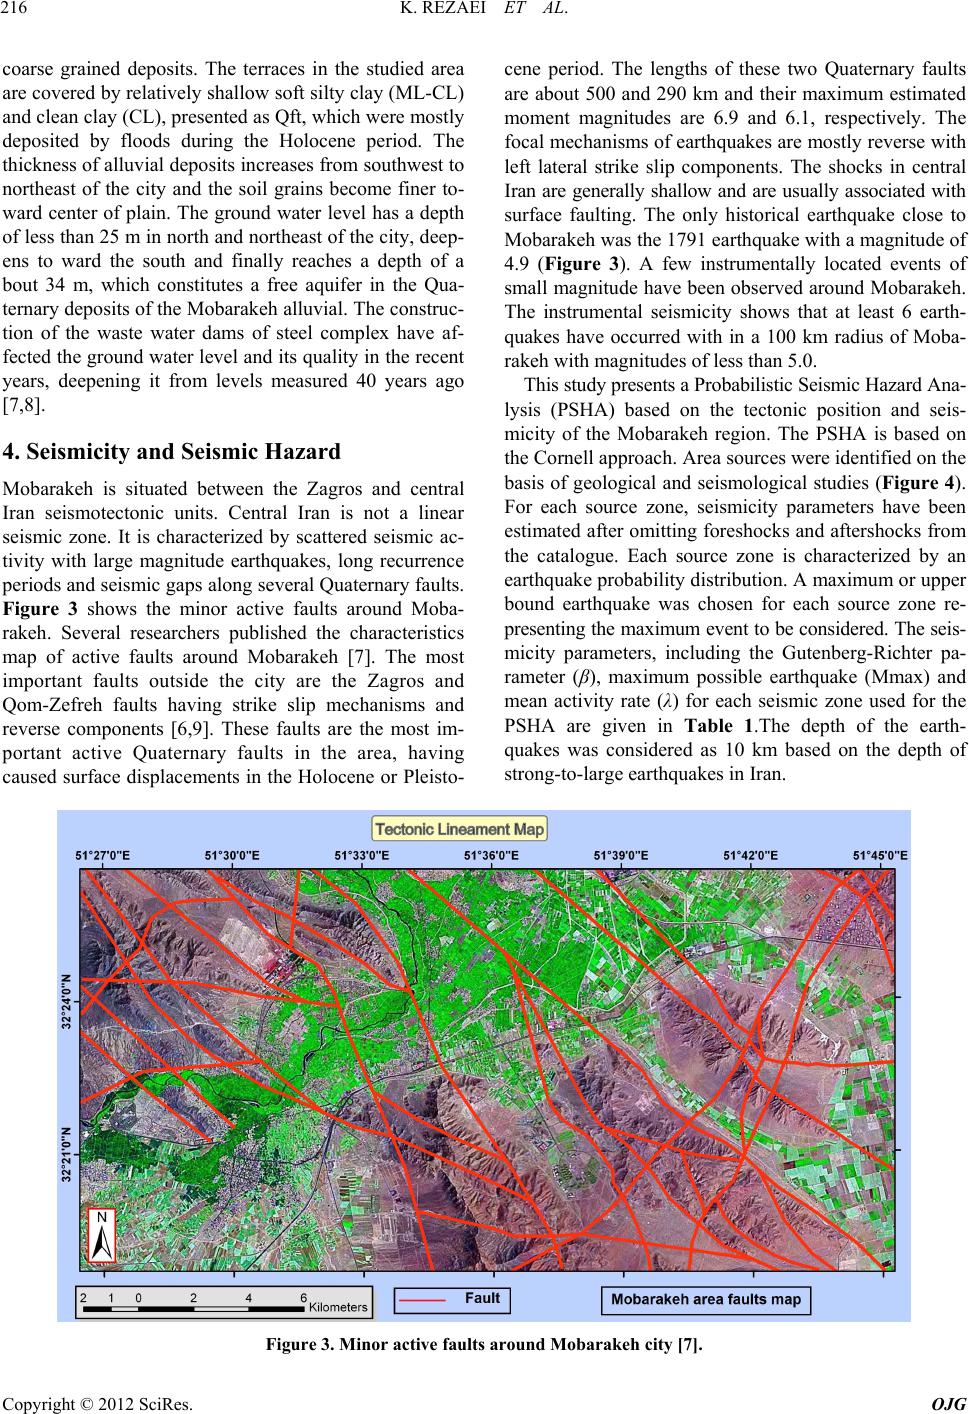 K. REZAEI ET AL. 216 coarse grained deposits. The terraces in the studied area ard s and central cene period. The lengths of these two Quaternary faults mic Hazard Ana- are covered by relatively shallow soft silty clay (ML-CL) and clean clay (CL), presented as Qft, which were mostly deposited by floods during the Holocene period. The thickness of alluvial deposits increases from southwest to northeast of the city and the soil grains become finer to- ward center of plain. The ground water level has a depth of less than 25 m in north and northeast of the city, deep- ens to ward the south and finally reaches a depth of a bout 34 m, which constitutes a free aquifer in the Qua- ternary deposits of the Mobarakeh alluvial. The construc- tion of the waste water dams of steel complex have af- fected the ground water level and its quality in the recent years, deepening it from levels measured 40 years ago [7,8]. 4. Seismicity and Seismic Haz Mobarakeh is situated between the Zagro Iran seismotectonic units. Central Iran is not a linear seismic zone. It is characterized by scattered seismic ac- tivity with large magnitude earthquakes, long recurrence periods and seismic gaps along several Quaternary faults. Figure 3 shows the minor active faults around Moba- rakeh. Several researchers published the characteristics map of active faults around Mobarakeh [7]. The most important faults outside the city are the Zagros and Qom-Zefreh faults having strike slip mechanisms and reverse components [6,9]. These faults are the most im- portant active Quaternary faults in the area, having caused surface displacements in the Holocene or Pleisto- are about 500 and 290 km and their maximum estimated moment magnitudes are 6.9 and 6.1, respectively. The focal mechanisms of earthquakes are mostly reverse with left lateral strike slip components. The shocks in central Iran are generally shallow and are usually associated with surface faulting. The only historical earthquake close to Mobarakeh was the 1791 earthquake with a magnitude of 4.9 (Figure 3). A few instrumentally located events of small magnitude have been observed around Mobarakeh. The instrumental seismicity shows that at least 6 earth- quakes have occurred with in a 100 km radius of Moba- rakeh with magnitudes of less than 5.0. This study presents a Probabilistic Seis lysis (PSHA) based on the tectonic position and seis- micity of the Mobarakeh region. The PSHA is based on the Cornell approach. Area sources were identified on the basis of geological and seismological studies (Figure 4). For each source zone, seismicity parameters have been estimated after omitting foreshocks and aftershocks from the catalogue. Each source zone is characterized by an earthquake probability distribution. A maximum or upper bound earthquake was chosen for each source zone re- presenting the maximum event to be considered. The seis- micity parameters, including the Gutenberg-Richter pa- rameter (β), maximum possible earthquake (Mmax) and mean activity rate (λ) for each seismic zone used for the PSHA are given in Table 1.The depth of the earth- quakes was considered as 10 km based on the depth of strong-to-large earthquakes in Iran. Figure 3. Minor active faults around Mobarakeh ci ty [7]. Copyright © 2012 SciRes. OJG 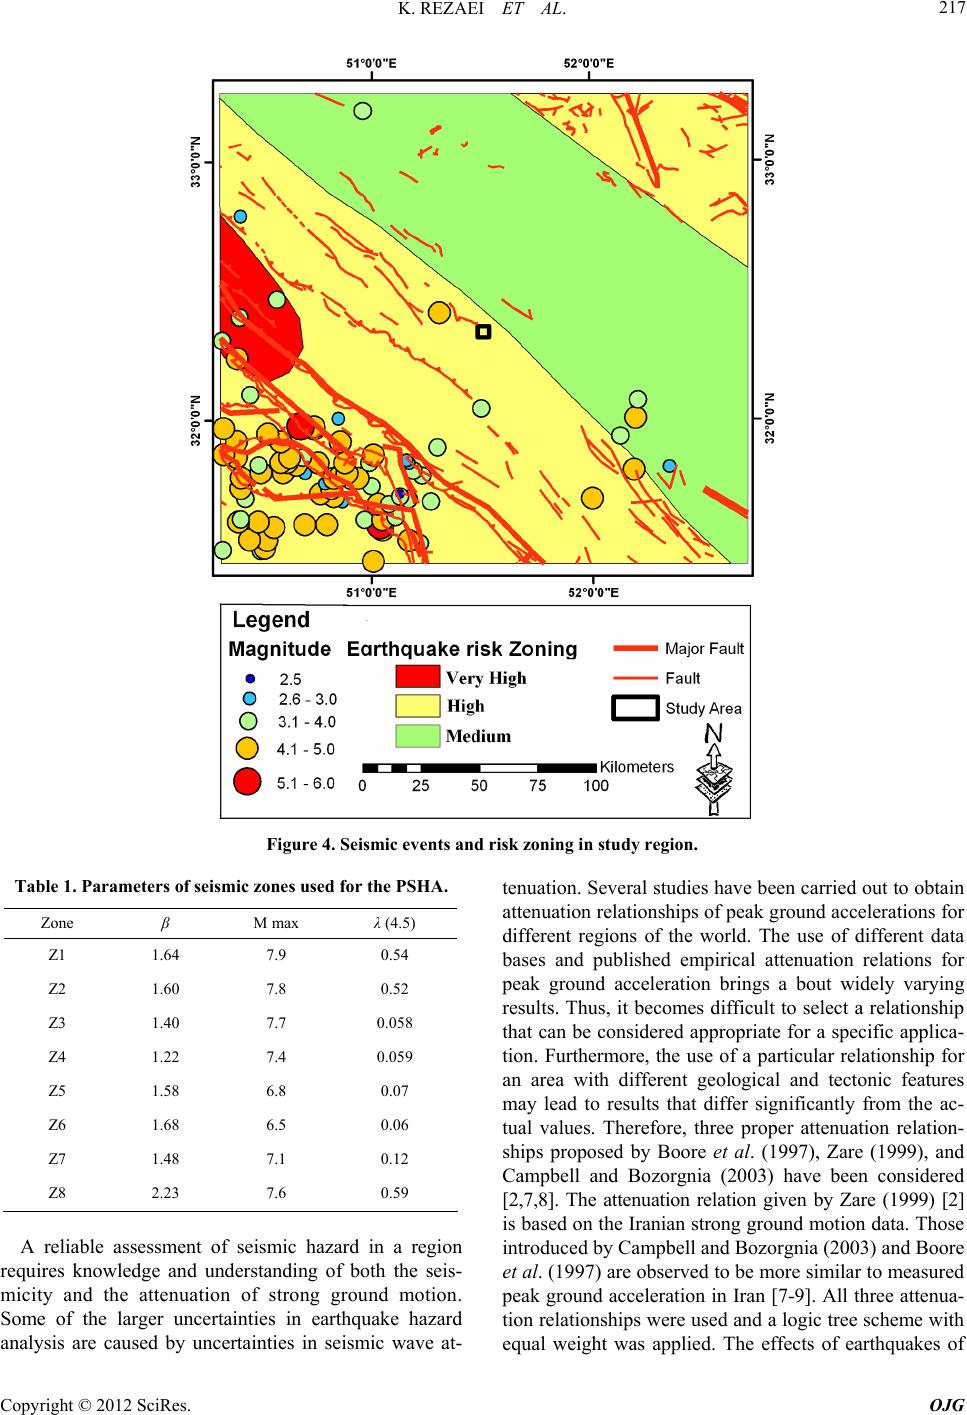 K. REZAEI ET AL. 217 Figure 4. Seismic events and risk zoning in study region. Table 1. Parameters of seismic zones used for the PSHA. Zone β M max λ (4.5) Z1 1.64 7.9 0.54 Z2 1.60 7.8 0.52 Z3 1.40 7.7 0.058 Z4 1.22 7.4 0.059 Z5 1.58 6.8 0.07 Z6 1.68 6.5 0.06 Z7 1.48 7.1 0.12 Z8 2.23 7.6 0.59 A reliable assessment of seismic hazard in a region re tenuation. Several studies have been carried out to obtain quires knowledge and understanding of both the seis- micity and the attenuation of strong ground motion. Some of the larger uncertainties in earthquake hazard analysis are caused by uncertainties in seismic wave at- attenuation relationships of peak ground accelerations for different regions of the world. The use of different data bases and published empirical attenuation relations for peak ground acceleration brings a bout widely varying results. Thus, it becomes difficult to select a relationship that can be considered appropriate for a specific applica- tion. Furthermore, the use of a particular relationship for an area with different geological and tectonic features may lead to results that differ significantly from the ac- tual values. Therefore, three proper attenuation relation- ships proposed by Boore et al. (1997), Zare (1999), and Campbell and Bozorgnia (2003) have been considered [2,7,8]. The attenuation relation given by Zare (1999) [2] is based on the Iranian strong ground motion data. Those introduced by Campbell and Bozorgnia (2003) and Boore et al. (1997) are observed to be more similar to measured peak ground acceleration in Iran [7-9]. All three attenua- tion relationships were used and a logic tree scheme with equal weight was applied. The effects of earthquakes of Copyright © 2012 SciRes. OJG 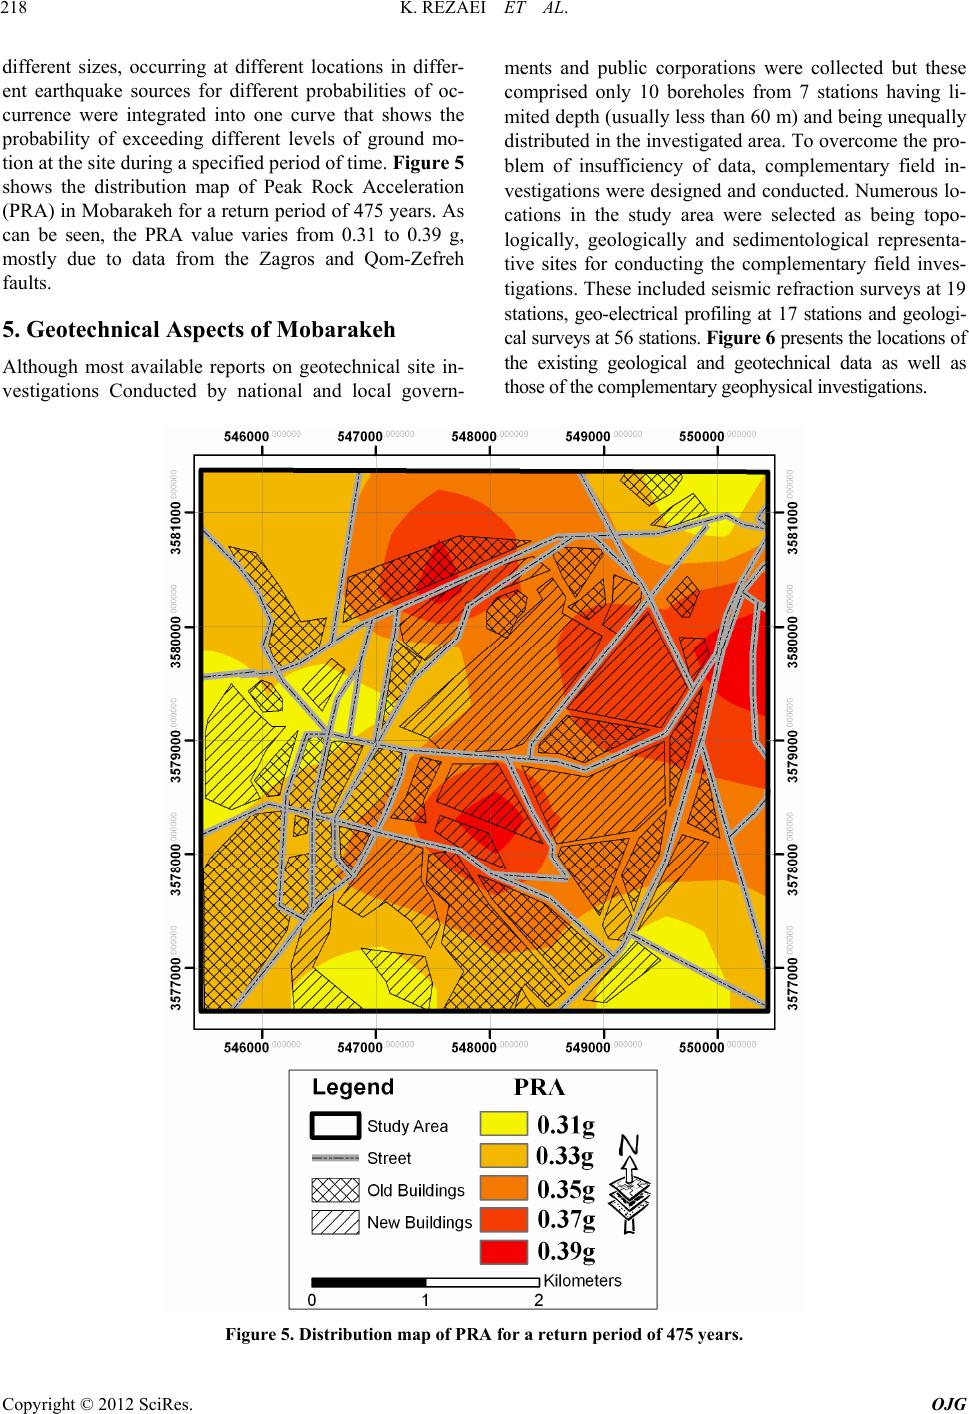 K. REZAEI ET AL. 218 different sizes, occurring at different locations in differ- ent earthquake sources for different probabilities of oc- currence were integrated into one curve that shows the probability of exceeding different levels of ground mo- tion at the site during a specified period of time. Figure 5 shows the distribution map of Peak Rock Acceleration (PRA) in Mobarakeh for a return period of 475 years. As can be seen, the PRA value varies from 0.31 to 0.39 g, mostly due to data from the Zagros and Qom-Zefreh faults. 5. Geotechnical Aspects of Mobarakeh site in- vern- Although most available reports on geotechnical vestigations Conducted by national and local go ments and public corporations were collected but these comprised only 10 boreholes from 7 stations having li- mited depth (usually less than 60 m) and being unequally distributed in the investigated area. To overcome the pro- blem of insufficiency of data, complementary field in- vestigations were designed and conducted. Numerous lo- cations in the study area were selected as being topo- logically, geologically and sedimentological representa- tive sites for conducting the complementary field inves- tigations. These included seismic refraction surveys at 19 stations, geo-electrical profiling at 17 stations and geologi- cal surveys at 56 stations. Figure 6 presents the locations of the existing geological and geotechnical data as well as those of the complementary geophysical investigations. Figure 5. Distribution map of PRA for a return period of 475 years. Copyright © 2012 SciRes. OJG  K. REZAEI ET AL. 219 Figure 6. Geotechnical and complementary geophysical and geological stations. For the purpose of t e rent, with dominant depth. In this he study, seismic bedrock has been rakeh that is significantly diffe dfined as rock-like media with shear wave velocities of over 700 - 800 m/s [4,11-13], which is suitable for ordi- nary low to medium-rise buildings [3]. Distribution maps of sub-surface sediments (Figure 7), depth of the seismic bedrock (Figure 8), as well as some geotechnical sec- tions (Figure 9) were compiled using the accumulated data. The maps give clear perspectives on the variability of soil conditions through out the study area. The ground conditions of the study were thus categorized according to soil type, layer thickness and depth of seismic bed rock into three distinct zones (Figure 10): Zone 1: south and some parts of southwest of Moba- Clayey Layers (CL) to a considerable zone, the average shear wave velocity is less than 300 m/s and the depth of seismic bedrock exceeds 90 m. Zone 2: rock outcrops covering the southwest and northeast mountainous regions and granular coarse- grained alluviums (GP, GW) in central parts of study area. In this zone, low to medium dense sub layers do not exist to near zero, the average shear wave velocity is over 700 - 800 m/s. Zone 3: granular finer grained alluviums (SM, SW, SP) which cover most parts of the central plain and southwest and northeast edges. In this zone, low to Copyright © 2012 SciRes. OJG  K. REZAEI ET AL. 220 medium dense sub layers have no considerable thick- nesses, the depth of seismic bedrock varies from 20 to 50 m and the average shear wave velocity varies from 350 to 500 m/s. Moving from east to west and from north to south on the plain, the alluvium grain sizes decrease and fine grained soil layers (SM, ML, SC) become dominant (Figure 9). Although some parts of the plain are covered by 2 - 10 m of alternating sur- face clayey and non-clayey sub layers, most parts of the plain consist solely of non-clayey sandy and silty sub layers (SM, ML) that change to gravely/sandy sub layers (GP, GW, SP, SW). To the northwest of the plain, the thicknesses of low to medium dense sub layers and the depth of seismic bed rock increase and the average shear wave velocity decreases. Some parts of the plain form a transition zone between Zone 3 and adjacent Zones 1 and 2. The soil conditions of the zones were classified into several representative geotechnical profiles by considering their combina- tions of soil type, layer thickness, shear wave velocity and depth of seismic bedrock (Figure 10). Figure 11 show samples of representative geological outcrops and cross sections and Figure 12 show distribution map of thickness of soil and sediments. Considering information currently available on the underlying structure of Mobarakeh, one possible explanation is the existence of a deeper impedance contrast caused by the Quaternary sediments underlying the surface soil layers and resting at a depth of 100 - 150 m from the ground surface on hard geological bed rock from the cretaceous limestone formations having marked differences in elastic properties. The results of deep down-hole and geo-electrical profiles support this. Another possible explanation is the effect of interac- tion of the surrounding mountain regions with the 3D basin structure. Figure 7. Distribution map of shallow sub-sur face sediments. Copyright © 2012 SciRes. OJG 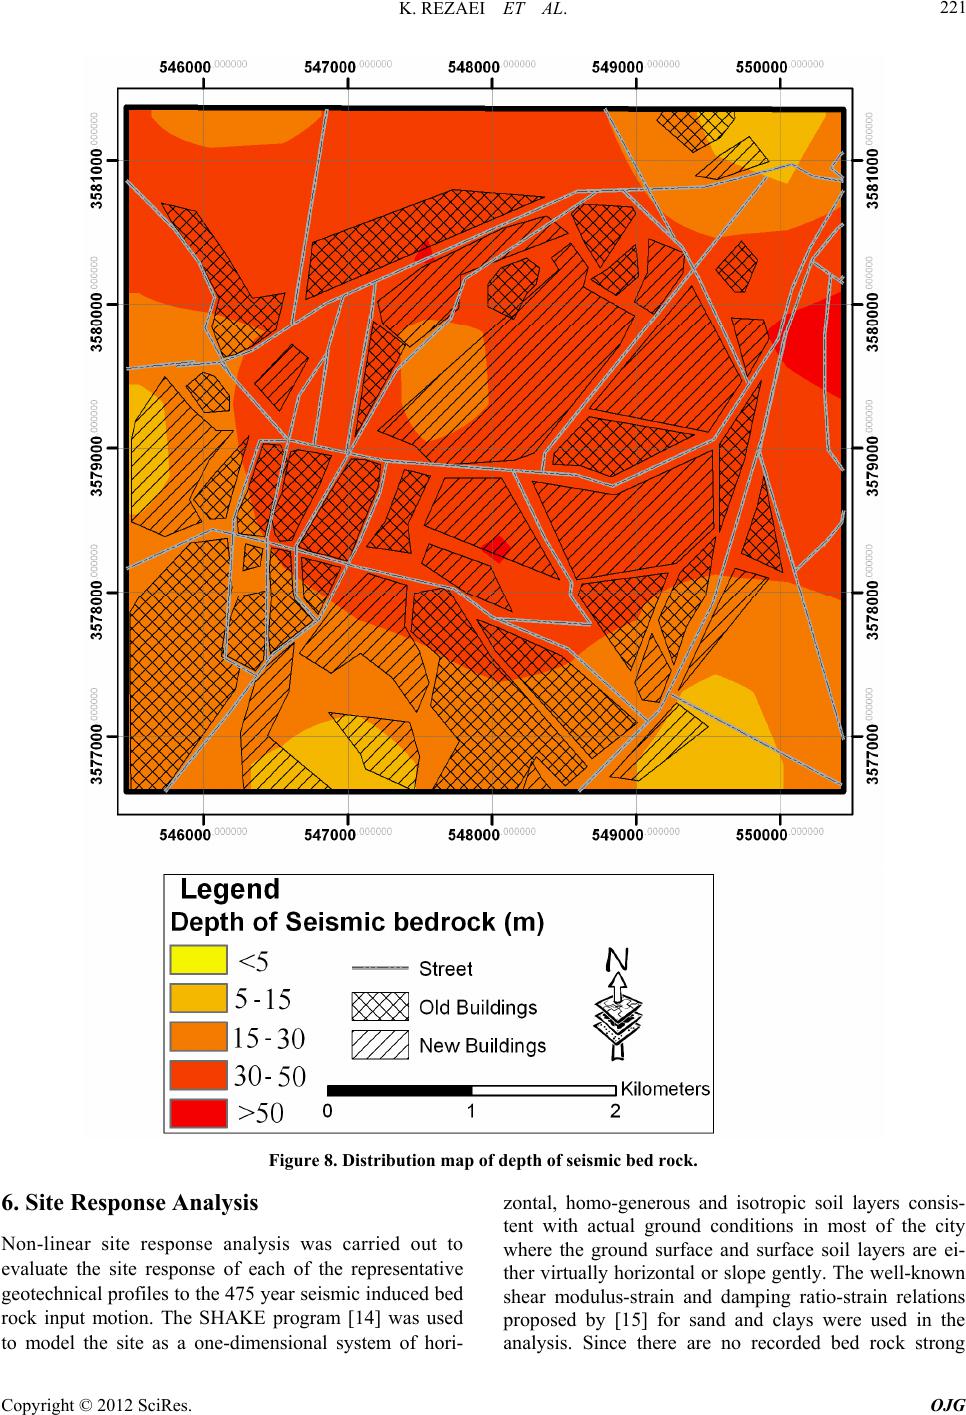 K. REZAEI ET AL. 221 Figure 8. Distribution map of depth of seismic bed roc k. 6. Site Response Analysis Non-linear site response analysis was carried out to evaluate the site response of each of the representative geotechnical profiles to the 475 year seismic induced bed rock input motion. The SHAKE program [14] was used to model the site as a one-dimensional system of hori- zontal, homo-generous and isotropic soil layers consis- tent with actual ground conditions in most of the city where the ground surface and surface soil layers are ei- ther virtually horizontal or slope gently. The well-known shear modulus-strain and damping ratio-strain relations proposed by [15] for sand and clays were used in the analysis. Since there are no recorded bed rock strong Copyright © 2012 SciRes. OJG 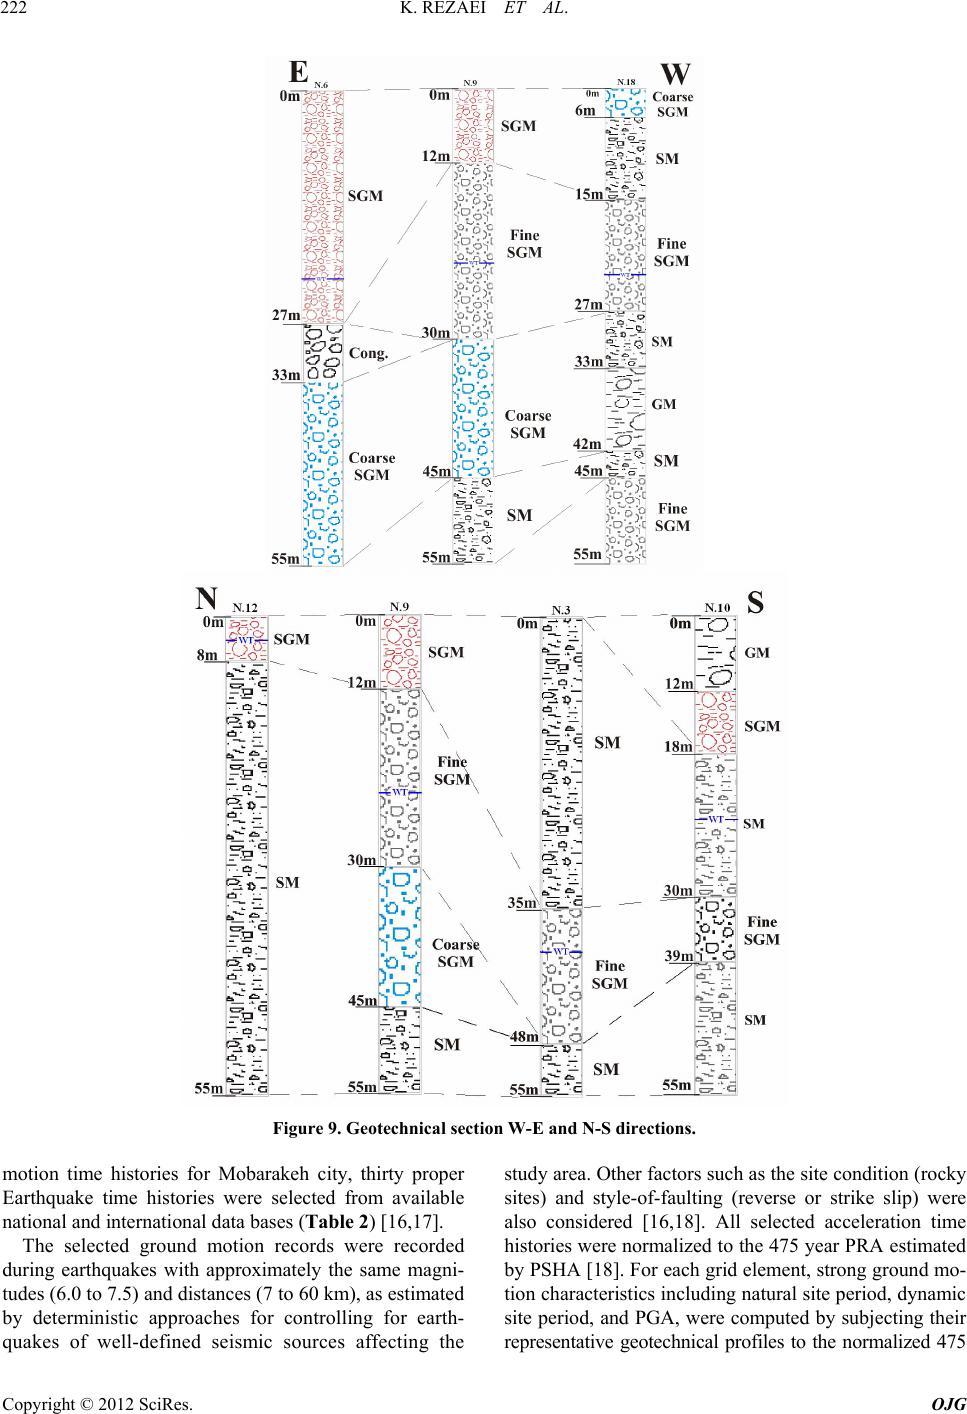 K. REZAEI ET AL. 222 Figure 9. Geotechnical section W-E and N-S directions. motion time histories for Mobara selected from available (Table 2) [16,17]. ch as the site condition (rocky keh city, thirty proper study area. Other factors su Earthquake time histories were national and international data bases The selected ground motion records were recorded during earthquakes with approximately the same magni- tudes (6.0 to 7.5) and distances (7 to 60 km), as estimated by deterministic approaches for controlling for earth- quakes of well-defined seismic sources affecting the sites) and style-of-faulting (reverse or strike slip) were also considered [16,18]. All selected acceleration time histories were normalized to the 475 year PRA estimated by PSHA [18]. For each grid element, strong ground mo- tion characteristics including natural site period, dynamic site period, and PGA, were computed by subjecting their representative geotechnical profiles to the normalized 475 Copyright © 2012 SciRes. OJG  K. REZAEI ET AL. 223 Figure 10. Distribution map of site types. year bed rock input motions. Once the average results were obtained for each grid element, microzonation maps of the city were created showing the distribution of site amplification characteristics and e study area. . O ures 13 and 14 demonstrates that, as expected, the dy- namic site periods are higher than te natural site periods because of the shear modulus reduction caused by the during 475 year strong earth- quakes. Most parts of Mobarakeh have medium dynamic PGA values through out soil’s non-linear behavior th Figure 13 illustrates the distribution of the natural site period (TN) through out the city. Most parts of the city have medium natural site periods of between 0.4 and 0.8 s nly the south and southeastern part covered by allu- viums with low stiffness and considerable thickness, has low natural site periods less than 0.4 s. Figure 14 pre- sents the distribution of the dynamic (non-linear) site periods (TD) through out the city. A comparison of Fig- h site periods of between 0.4 s and 0.8 s, except for some parts in the south and southeast of the city, where the thickness of medium dense sub soils and the depth of seismic bed rock increase, which have low dynamic site periods of less than 0.4 s. The west half of study area has high dynamic site periods of more than 0.8 s. Figure 15 shows the distribution of the 475 year return period PGA through out the Mobarakeh city. The PGA Copyright © 2012 SciRes. OJG  K. REZAEI ET AL. 224 Figure 11. Samples of representative geological outcrops and cross sections. values vary from 0.3 g to more than 0.6 g. In GIS media, almost 35% of the grid elements exhibit PGA values of 0.45 to 0.5 g. Only 9% of them experi f about 0.3 g and approximately 18% exhibit PGA va- barakeh. Evaluations of the ground motion characteristic are based on seismic risk assessment of the region for a years, and on geophysical (geoelec- trical and seismology) measurements and one-dimen- a depth of 10 ence PGA values return period of 475 o lues of more than 0.6 g. The dense granular alluviums in east of Mobarakeh and the mountainous rocky sites in the east of the city experience the lowest PGA values be- cause either their amplification potential is negligible or their PRA values are the lowest. The alluviums covering the center part of the city and the west and northeast borders of the plain, in particular, experience higher PGA values because oft heir considerable amplification poten- tial caused by low to medium dense soil layers. 7. Conclusion This paper presents the most important features of soil and quality and site effect microzonation studies of Mo- sional non-linear site response analyses of the geotech- nical profiles representing the geotechnical model of the city. It was found that two active or potentially active Quaternary faults with distinct evidence of surface dis- placements with in Holocene or Pleistocene times lay with in the city. This implies the necessity of considering surface fault-rupture hazard as well as other near field effects in planning future construction in these neighbor- hoods. It may be attributed to the 3D basin effects or to the presence of thick Quaternary sediments (with shear wave velocity of more than 800 m/s) resting at 0 - 150 m from the ground surface on hard rock from the cretaceous limestone formtions. In almost half of the a Copyright © 2012 SciRes. OJG  K. REZAEI ET AL. 225 Figure 12. Distribution of Sediment thickness tr ough out M obar a ke h. Table 2. Specification of selected accelerograms for site response analysis. No Earthquake Mechanism MagnitudeDistancePGA (g) 1 San Fernando-1971 Reverse 6.6 23.5 0.16 2 San Fernando-1971 Reverse 6.6 23.5 0.13 3 Vendic, Iran-1976 Strike slip 6.4 10 0.17 4 Vendic, Iran-1976 Strike slip 6.4 10 0.18 5 Naghan, Iran-1977 Reverse 6.1 7 0.87 6 Naghan, Iran-1977 Reverse 6.1 7 0.57 7 Tabas, Iran-1978 Reverse 7.4 45 0.11 8 Tabas, Iran-1978 Reverse 7.4 45 0.09 9 N.PalmSprings-1986 6.0 45.6 0.10 10 N. Palm Springs-1986 ue 6.0 45.6 0.13 11 12 erse erse erse erse erse erse e sli sli sli e sli sli sli erse erse Strike sli 28 Bam, Iran-2003 Strike sli 29 Baladeh, Iran-2004 Reverse 30 Baladeh, Iran-2004 Reverse Reverse oblique Reverse obliq N. Palm Springs-1986 Reverse oblique 6.0 7.3 0.49 N. Palm Springs-1986 Reverse oblique 6.0 7.3 0.61 13 Northridge-1994 Rev 14 Northridge-1994 Rev 15 Northridge-1994 Rev 16 Northridge-1994 Rev 17 Northridge-1994 Rev 18 Northridge-1994 Rev 19 Duzce, Turkey-1999 Strik 20 Duzce, Turkey-1999 Strike 21 Duzce, Turkey-1999 Strike 22 Duzce, Turkey-1999 Strik 23 Duzce, Turkey-1999 Strike 24 Duzce, Turkey-1999 Strike 25 Changureh, Iran-2002 Rev 26 Changureh, Iran-2002 Rev 27 Bam, Iran-2003 6.7 26.8 0.17 6.7 26.8 0.22 6.7 36.1 0.23 6.7 36.1 0.13 6.7 8.2 0.30 6.7 8.2 0.43 p 7.1 8.2 0.51 p 7.1 8.2 0.97 p 7.1 8.5 0.13 p 7.1 8.5 0.15 p 7.1 27 0.05 p 7.1 27 0.05 6.0 28 0.43 6.0 28 0.44 p 6.5 56 0.16 p 6.5 56 0.1 6.3 20 0.29 6.3 20 0.16 Copyright © 2012 SciRes. OJG  K. REZAEI ET AL. 226 Figure 13. Distribution of TN through out Mobarake h. Fe 14. Distribution of TD throuarakehturn pe of 47s. igurgh out Mob a reriod5 year Copyright © 2012 SciRes. OJG  K. REZAEI ET AL. Copyright © 2012 SciRes. OJG 227 Figure 15. Dis of 475 years. city, estimated 475 year PGA values are higher than the maximum Design Base Acceleration (DBA) of 0.35 g proposed by the Iranian code for regions with very high levels of seismicity. This emphasizes once again the im- portant role that site effect microzonation can play in seismic risk mitigation of seismic-prone zones. The mi- crozonation maps of the natural site period, dynamic site period and PGA can be useful in land-use planning in consideration of population density, building height and building importance. It is obvious that more accurate evaluations of ground motion characteristics in the future require more geotechnical and geophysical data as well as consideration of the 3D effects of the surrounding mountain regions and of the sub-surface topography. It should also be noted that the microzonation maps are not intended to replace site-specific investigations for critical structures. REFERENCES [1] K. Rezaei, A. Friedrich, B. Guest, F. Fayazi, M. Nakhaei, S. M. F. Aghda and A. Beitollahi, “Soil and Sediment Quality and Composition as Factors in the Distribution of Damage at the December 26, 2003, Bam Area Earthquake in SE Iran (Ms = 6.6),” Journal of Soils and Sediments, Vol. 9, No. 1, 2009, pp. 23-32. [2] M. Zare, “Contribution a L’ Etude Des Movements Forts En Iran: Du Catalogue Aux Lois D’ Attenuation,” Ph.D. Thesis, Joseph Fourier University, Grenoble, 1999. [3] M. Kamalian, M. K. Jafari, M. R. Ghayamghamian, A. Shafiee, H. Hamzehloo, E. Haghshenas and A. Sohrabi- Bidar, “Site Effect Microzonation of Qom, Iran,” The Journal of Engineering Geology, Vol. 97, No. 1, 2008, pp. 63-79. [4] K. Ishihara and A. M. Ansal, “Dynamic Behavior of Soil, Soil Amplification and Soil Structure Interaction,” Final Report for Working Group D, UNDP/UNESCO Project on Earthquake Risk Reduction in the Balkan Region, 1982. [5] K. Rezaei, S. Norouzi and R. Sarraf, “Study of Relation- ship between Q and Electric Resistivity and Thickness (RT) in Aliabad Plain of Mobarakeh,” The 1st Confer- ence of Applied Geology in Iran, Azad University of Mashhad, Farsi, 2007. [6] H. R. Ramazi, “Seismotectonic, Seismicity and Relative Earthquake Hazard Zoning in Mobarakeh Province,” Hou- sing and Urbanization Organization, Mobarakeh, 2002. [7] D. M. Boore, W. B. Joyner and T. E. Fumal, “Equations for Estimating Horizontal Response Spectra and Peak tribution of PGA through out the city for a return period  K. REZAEI ET AL. 228 Acceleration from Western North American Earthquakes: A Summary of Recent Work,” Seismological Research Letters, Vol. 68, No. 1, 1997, pp. 128-153. doi:10.1785/gssrl.68.1.128 [8] K. W. Campbell and Y. Bozorgnia, “Updated Near-Source Ground-Motion (Attenuation) Relations for the Horizon- tal and Vertical Components of Peak Ground Accelera- tion and Acceleration Response Spectra,” Bulletin of the Seismological Society of America, Vol. 93, No. 1, 2003, pp. 314-331. doi:10.1785/0120020029 [9] International Council of Building Officials, “Uniform Building Code. International Council of Building Offi- cials,” International Building Code, 1997. [10] Building Seismic Safety Council, “NEHRP Recommend- ed Provisions for Seismic Regulations for New Buildings and Other Structures, Part 1: Provisions (FEMA368),” Federal Emergency Management Agency, Oklahoma City, 2003. [11] Building and Housing Research Center, “Iranian Code of Practice for Seismic Resistant Design of Buildings, Stan- dard No. 2800,” 3rd Edition, Building and Housing Re- search Center, Tehran, 2005. [12] P. B. Schnabel, J. Lysmer and H. B Seed, “Shake: A Computer Program for Earthquake Response Analysis of Horizontally Layered Sites,” Report EERC-72-12, Earth- quake Engineering Research Center, University of Cali- fornia, Berkeley, 1972. [13] H. B. Seed and I. M. Idriss, “Soil Moduli and Damping Factors for Dynamic Response Analysis,” Report EERC70- 10, 1970. [14] Geological Survey of Iran, “Geological Map of Iran, 1:100,000 Series, Sheet 6169-Esfahan,” 1978. [15] Water Affairs Office of Mobarakeh Province (WAO-QP), “Location Map of Water Wells and Ground Water Level Maps of Mobarakeh Area,” Water Resources Assessment Office, Ministry of Power (WRAO-PM), Geo Electrical Studies of Mobarakeh Region, 2004. [16] K. Hessami, F. Jamali and H. Abasi, “Major Active Faults of Iran,” International Institute of Earthquake Engineering and Seismology (IIEES), 2003. [17] Technical Committee for Earthquake Geotechnical Engi- neering “Revised Manual for Zonation on Seismic Geo- technical Hazards,” Japanese Society of Soil Mechanics and Foundation Engineering, 1999. [18] Earthquake Engineering Research Center, “Technical Com- mittee for Earthquake Geotechnical Engineering, (TC4),” University of California, Berkeley, 1999. Copyright © 2012 SciRes. OJG |