 Vol.2, No.4, 163-175 (2012) Stem Cell Discovery http://dx.doi.org/10.4236/scd.2012.24021 Bone morphogenetic protein-4 affects both trophoblast and non-trophoblast lineage-associated gene expression in human embryonic stem cells Margaret L. Shirley1,2*, Alison V enable1*, Raj R. Rao3, Nolan L. Boyd4, Steven L. Stice1,5,6, David Puett1#, Prema Narayan7# 1Department of Biochemistry and Molecular Biology, University of Georgia, Athens, USA; #Corresponding Author: puett@bmb.uga.edu 2Department of Psychiatry, University of California, San Francisco, USA 3Department of Chemical and Life Science Engineering, School of Engineering, Virginia Commonwealth University, Richmond, USA 4Cardiovascular Innovation Institute, University of Louisville, Louisville, USA 5Regenerative Bioscience Center, University of Georgia, Athens, USA 6Department of Animal and Dairy Sciences, University of Georgia, Athens, USA 7Department of Physiology, Southern Illinois University School of Medicine, Carbondale, USA; #Corresponding Author: pnarayan@siumed.edu Received 5 May 2012; revised 4 June 2012; accepted 1 July 2012 ABSTRACT Human embryonic stem cells (hESC) can be in- duced to differentiate to trophoblast by bone morphogenetic proteins (BMPs) and by aggre- gation to form embryoid bodies (EB), but there are many differences and controversies regard- ing the nature of the differentiated cells. Our goals herein were to determine if BG02 cells form trophoblast-like cells (a) in the presence of BMP4-plus-basic fibroblast growth factor (FGF-2) and (b) upon EB formation, and (c) whether the BMP4 anta gonist noggin elicits direct effects on gene expression and hormone production in the cells. Transcriptome profiling of hESC incubated with BMP4/FGF-2 showed a down-regulation of pluripotency-associated genes, an up-regula tion of trophoblast-associated genes, and either a down-regulation or no change in gene expres- sion for many markers of the three embryonic germ layers. Yet, there was up-regulation of several genes associated with mesoderm, ec- toderm, and endoderm, strongly suggesting that differentiation to trophoblast-like cells under the conditions used does not yield a homogeneous cell type. Several genes, heretofore unreported, were identified that are altered in hESC in re- sponse to BMP4-mediated differentiation. The production of human chorionic gonadotropin (hCG), progesterone, and estradiol in the dif- ferentiated cells confirmed that trophoblast-like cells were obtained. Gene expression by EB was characterized by an up-regulation of a num- ber of genes associated with trophoblast, ecto- derm, endoderm, and mesoderm, and the pro- duction of hCG and prog esterone confirmed that trophoblast-like cells were formed. These re- sults suggest that, in the presence of FGF-2, BG02 cells respond to BMP4 to yield tropho- blast-like cells, which are also obtained upon EB formation. Thus, BMP4-mediated differentiation of hESC represents a viable cell system for studying early developmental events post-im- plantation; however, up-regulation of non-tro- phoblast genes suggests a somewhat diverse response to BMP4/FGF-2. Noggin altered the transcription of a limited number of genes but, not surprisingly, did not lead to secretion of hormones. Keywords: Human Embryonic Stem Cells; Trophoblasts; Bone Morphogenetic Prot ein-4; Embryoid Bodies; Noggin 1. INTRODUCTION In the human blastocyst, the first step of differentiation from the morula, composed of totipotent cells, yields the inner cell mass and trophoblast. The former differentiates into the hypoblast, leading to the extraembryonic endo- derm and the epiblast, that differentiates to give the am- niotic ectoderm and the primitive ectoderm. The primi- tive ectoderm, in turn, differentiates into the embryonic *These authors contributed equally to this work. Copyright © 2012 SciRes. OPEN ACCESS  M. L. Shirley et al. / Stem Cell Discovery 2 (2012) 163-175 164 ectoderm and the primitive streak, the latter giving rise to extraembryonic mesoderm, primitive mesoderm, and em- bryonic endoderm. The trophectoderm is composed of epithelial cells and differentiates into several lineages. The trophoblast precursor cells begin rapid proliferation into cytotrophoblasts, with some fusing to form multinu- cleate syncytiotrophoblasts, a terminally differentiated trophoblast cell; in addition, villous and extravillous cy- totrophoblasts are formed [1-3]. One of the hallmarks of trophoblast differentiation is the production of the hete- rodimeric glycoprotein hormone, human chorionic gona- dotropin (hCG), that is secreted throughout gestation, being essential for progesterone production by the corpus luteum in the first trimester of human pregnancy [4,5]. There is a paucity of adequate cell models for studying early trophoblast development, and a reliable system will greatly facilitate progress in the area of human reproduc- tion. Recent studies have shown that human embryonic stem cells (hESCs) can undergo differentiation into tro- phoblast-like cells spontaneously from colonies [6], growth of the cells beyond confluence [7], or embryoid bodies (EBs) [3,8-12]. Similarly, trophoblast-like cells can be obtained from hESCs via induced differentiation from the bone morphogenetic proteins (BMPs) 2, 4, and 7 [13-24]. Fortunately, timely reviews are available [25- 28]. Others have reported that RNAi-mediated knock- down of Oct4 in hESCs can also lead to trophoblast-like cells [29,30]. The BMPs, members of the transforming growth factor-b (TGFb) superfamily, function to regulate many aspects of development which act by binding to cell surface serine/threonine kinase receptors that, in turn, phosphorylate particular Smads, thus enabling them to enter the nucleus and act as transcriptional regulators [31-34]. These cellular models for trophectoderm differentia- tion begin to fill a long-awaited need for new systems to study early development, particularly in view of the ma- jor differences between human and mouse trophoblast [35-37]. Yet, the characteristics of the human trophoblast cells obtained by BMP-mediated differentiation vary, sometimes quite significantly, depending upon the cell type, culture conditions (including the presence or ab- sence of growth factors, particularly FGF2), and mode of differentiation [10,18,38]. Moreover, in a number of in- stances there are considerable differences and controver- sies regarding the product(s) of differentiation obtained with BMP. For example, BMP4-mediated differentiation was found to yield little evidence of trophoblast-like cells under standard culture conditions [38]. Another stu- dy found that 14 genes were highly up-regulated as de- termined by microarrays, in addition to many others [21], while another report did not identify six of these particu- lar genes [17]. Also, differences in cell morphology and gene markers have been noted in BMP-treated hESCs [18,21]. Explanations for many of these controversial reports were recently provided by two groups. Yu et al. [22] reported that bFGF (FGF-2), which acts via the MEK-ERK pathway, redirects BMP4-mediated differen- tiation from trophectoderm to mesendoderm as judged by the expression of brachyury. The activated MEK-ERK pathway sustains NANOG expression leading to a bFGF-independent induction of mesendoderm by BMP4. Another recent paper concluded that in the cooperative presence of FGF2, BMP4 (that acts through brachyury and CDX2) leads to the induction of mesoderm, not tro- phoblast [39]. The present study was undertaken with the goals of: 1) extending the previous reports that were based on a va- riety of cell lines, different culture conditions, and at times conflicting results, and 2) to critically examine the trophoblast and non-trophoblast BMP-regulated genes, particularly since a number of the non-trophoblast BMP- regulated genes have been noted in the earlier studies. We chose to use the hESC line, BG02 (karyotype 46, XY), that has not been thoroughly studied in hESC dif- ferentiation to trophoblast. This cell line was established from a 6-day embryo with an embryo grade of 3CC [7]. Herein, BMP4, in the presence of FGF2, was incubated with adherent colonies of BG02 cells to initiate tro- phoblast differentiation. Identical studies were also done in the presence of the BMP4 antagonist noggin, since it has been shown that noggin alters hESC gene expression and morphology, perhaps leading to differentiation to- ward early neuroectoderm [18]. In addition, trophoblast differentiation was initiated by formation of EBs. Parti- cular emphasis was placed on quantitative profiling of a variety of genes via qRT-PCR, and measurements were made to determine hCG and steroid hormone production by the cells and EBs. Our results have many similarities with the findings of others, including for example the down-regulation of pluripotency genes, the up-regulation of trophoblast genes, and placental hormone production, but there are also notable differences, particularly with the up-regulation of certain genes associated with the three primary germ layers. 2. MATERIALS AND METHODS 2.1. Maintenance of Undifferentiated Cells In order to ensure pluripotency, the BG02 cells, ob- tained with proper authorization from Bresagen, Athens, GA, were manually passaged every 2 - 3 days onto mito- tically-inactivated mouse embryonic feeder (MEF) layers derived from E13.5 mouse fetuses. The MEF layer was removed from the hESC colony, which was then gently dispersed with the colony pieces being transferred to another 10 cm MEF-containing plate and treated with Copyright © 2012 SciRes. OPEN ACCESS  M. L. Shirley et al. / Stem Cell Discovery 2 (2012) 163-175 165 hESC culture medium: 77% Dulbecco’s Modified Eagle Medium (DMEM/F12; Gibco, Carlsbad, CA) supple- mented with 15% fetal bovine serum (Hyclone, Logan, UT); 5% knockout serum replacement, 1% non-essential amino acids, 1% penicillin/streptomycin, and 1 mM L-glutamine (all from Gibco); 0.1 mM β -mercaptoeth- anol and 4 ng/mL basic fibroblast growth factor (FGF2; Sigma, St. Louis, MO); and 10 ng/mL leukemia inhibi- tory factor (LIF; Chemicon, Temecula, CA). Cells were passaged every 3 - 4 days. Two days after passage the medium was aspirated and replaced daily. 2.2. BMP4-Mediated Differentiation The cells were passaged by gentle enzymatic digestion using cell dissociation buffer (Gibco) into 10 cm Ma- trigel-coated dishes (BD Bioscience, Boca Raton, FL). The BG02 cells were cultured in 50% DMEM/F12 me- dium that was conditioned by MEF layers [21] and then supplemented with 4 ng/mL FGF2. Experimental groups included incubation with 100 ng/mL BMP-4 (Quest Di- agnostics, Lyndberg, NJ) and with 250 ng/mL noggin (Quest Diagnostics), with untreated hESC serving as controls. The medium was collected each day for analy- sis of secreted hormones. On day 7 the cells were har- vested and quick-frozen for RNA extraction 2.3. Formation of Embryoid Bodies Colonies were sliced into small pieces, then removed gently from the MEF layer where they were allowed to aggregate randomly in suspension on agarose plates. EBs were grown on agarose dishes in 12 mL of the hESC medium described above. Each culture began with ~50 EBs and ended with ~12 EBs of varying sizes. The loss of EB was attributed to aggregation of the individual units and/or to atresia/necrosis. On alternate days the culture plates were swirled to aggregate the EB with 6 mL of medium being removed and frozen. The same vol- ume of fresh medium was added with the EBs then dis- persed to prevent clumping. 2.4. Hormone Assays Media collected from cell cultures and EBs were ana- lyzed for secretion of three placental hormones namely hCG (the assay recognizes both heterodimer and hCG β ), progesterone, and estradiol using immunofluorescence- based assays. The hormones were measured with an Im- mulite 1000 with a tri-level internal control in human serum, Con6, being used to standardize all kits (Diagnos- tic Product Corporation, Los Angeles, CA). 2.5. qRT-PCR Total RNA was isolated from BG02 (day 0, i.e. control, and incubated for 7 days) and from EBs at days 5, 22, and 50 of culture. hESCs were resuspended in 1 mL Tri- zol (Invitrogen, Carlsbad, CA) and triturated until ho- mogenized. The integrity of isolated RNA isolated from the homogenates (Trizol, Molecular Research Corpora- tion, Albany, NY) was verified and quantified using a RNA 600 Nano Assay (Agilent Technologies, Foster City, CA) and the Agilent 2100 Bioanalyzer. The cDNA Ar- chive Kit (Applied Biosystems, Inc., Foster City, CA) was used to reverse transcribe 5 μg total RNA with the MultiScribe Reverse Transcriptase. Initially, reactions were incubated at 25˚C for 10 min and subsequently at 37˚C for 120 min. Quantitative PCR (Taqman) assays were selected for the transcripts to be evaluated from Assays-On-Demand (Applied Biosystems, Inc.) and in- corporated into 384-well Micro-Fluidic Cards. The cDNA samples and 50 μl of GeneAmp Fast PCR master mix (2×) (Applied Biosystems, Inc.) were loaded in duplicate into respective channels on each microfluidic card and briefly centrifuged. qRT-PCR and relative quantification were performed with the ABI PRISM 7900 Sequence Detection System (Applied Biosystems, Inc.), with the expression levels of all genes analyzed given relative to 18S rRNA expres- sion. The results for differential expression between the treated and control samples were expressed as means and data with a Ct value greater than 35 were not analyzed. The qRT-PCR data on gene expression of BMP4-treated and noggin-treated hESCs on day 7 of culture were ana- lyzed as ddCt relative to day 0, i.e. undifferentiated hESCs. Data were collected for EBs at days 5, 22, and 50 of culture, in all cases using 18S rRNA as the internal reference gene. The values of ddCt on days 22 and 50 are expressed relative to day 5. In the equations below, std = internal gene standard (18S rRNA), goi = gene of interest under experimental conditions, and con = gene of interest under control conditions. It is assumed that the amplify- cation efficiency is identical under all conditions to give the normalized fold-change of the mRNA of interest in treated cells (experimental) relative to that of control cells [40,41]. ()() () tt goigoi std dCC C=− t )() () ttt concon std dCC C=− , ( () () tt t goi con ddC dCdC=−, Fold-change = t ddc 2− As defined, ddCt is negative if the gene of interest un- der experimental conditions, i.e. BG02 cells plus BMP4 or plus noggin on day 7, is expressed at a higher level than the same gene under control conditions, i.e. un- treated cells at day 0. 2.6. Data Analysis Most of the PCR experiments were performed in trip- Copyright © 2012 SciRes. OPEN ACCESS  M. L. Shirley et al. / Stem Cell Discovery 2 (2012) 163-175 166 licate, although in a few cases n was 2, 4, 5, or 6. Hor- mone measurements were done in triplicate, and the re- sults are given as mean ± SEM. Data exceeding a fold- change of 2.0 (up-regulated) or –2.0 (down-regulated) were analyzed using a one-way analysis of variance (ANOVA) with the GraphPad Prism software. Results are given for changes with P < 0.05 and P < 0.10. Al- though the mean fold-change was large in some cases, significance was at times not reached, often due to n = 2 or to one value in three being particularly different from the others. Outliers were identified using the Grubbs’ test (on-line GraphPad software). From over 400 hormone measurements, only about 1% was deemed outliers, and from over 700 qRT-PCR runs, only six and seven outliers were identified in the cell and EB data, respectively. 3. RESULTS 3.1. Effects of BMP4 and Noggin on Gene Expression and Hormone Production in hESC Gene expression: The selection of 177 genes to inves- tigate via qRT-PCR was based on several criteria. For example, it was important to include many that were established markers of pluripotency, trophoblast, ecto- derm, endoderm, and mesoderm. In addition to these standard marker genes, others were also screened. In- cluded in this list were genes encoding certain steroido- genic enzymes even if not specific for trophoblast and placenta, e.g. cytochrome P450 side-chain cleavage en- zyme (CYP11A1) and aromatase (CYP19A1). Other genes encoding proteins for extracellular matrix and various aspects of cell function were monitored. A heatmap, based on mean values of and de- picting gene expression of 146 genes in hESCs incubated with either BMP4 or with noggin for 7 days, both rela- tive to control cells, is shown in Figure 1. Ta b l e I pro- vides more information on many of the genes shown in Figure 1 that are altered by 2-fold or more in response to BMP4. It can be seen that a number of genes are up- regulated by BMP4, a smaller number down-regulated, and a much larger number exhibit no major change in expression. t ddc 2− BMP4 leads to down-regulation of the pluripotency- associated genes: DNMT3B, EBAF, FGF2, FGF4, FGFR4, FOXH1, GABRB3, GBX2, LDB2, POU5F1, and SOX2, and an up-regulation of genes associated with differen- tiation to trophoblast or involved in implantation and/or placenta function: CGB, CYP11A1, CYP19A1, ENPEP, EPAS1, GATA2, GATA3, HEY1, INHA, KRT7, MMP9, MSX2, PGF, and WNT5A, genes that have also been identified by others (cf. [17,21] and references therein). Moreover, a comparison of BMP4-mediated hESC dif- ferentiation with human trophectoderm [42] identified Figure 1. Heatmap showing the alterations in gene expression in hESC after seven days of incubation with either BMP4 (B) or noggin (N) relative to con- trol. The data reflect qRT-PCR results given as mean values of . The gray bars denote sufficiently low expression that could not be accurately deter- mined, i.e. Ct greater than 35. t ddc 2− Copyright © 2012 SciRes. OPEN ACCESS  M. L. Shirley et al. / Stem Cell Discovery 2 (2012) 163-175 167 Table 1. BMP4-mediated changes in gene expression of hESCsa. Gene Fold-change Description Trophoblast CGB 44.9b Chorionic gonadotropin-b CYP11 A1 51.5c Cytochrome P450 family 11, subfamily A CYP19A1 8.9b Cytochrome P450 family 19, subfamily A ENPEP 244.6b Glutamyl aminopeptidase EPAS1 185.6 d Endothelial PAS domain protein 1 GATA2 200.2 d GATA binding protein 2 GATA3 336.2 d GATA binding protein 3 HEY1 18.5b Hairy enhancement of split related with YRPW motif INHA 89.9c Inhibin a KRT7 242.2c Keratin 7 MMP9 8.6c Matrix metalloproteinase 9 MSX2 174.1d Msh homeobox 2 PGF 26.5d Placental growth factor WNT5A 101.8d Wingless-type MMTV integration site family 5A Pluripotency DNMT3B −3.7b DNA (cytosine-5)-methlytransferase 3 b EBAF −4.9b Endometrial bleeding associated factor FGF2 −5.3b Fibroblast growth factor 2 FGF4 −4.5b Fibroblast growth factor 4 FGFR4 −6.2d Fibroblast growth factor receptor 4 FOXH1 −9.1d Forkhead box protein H1 GBX2 −3.5b Homeobox protein GBX2 POU5F1 −4.8b POU class 5 homoebox 1 SOX2 −26.8d SRY (sex determining region Y)-box 2 Mesoderm BMP4 24.1d Bone morphogenetic protein 4 BMPR2 4.4d Bone morphogenetic protein receptor, type II CDH5 150.2b Cadherin 5, type 2 CDH11 7.1d Cadherin 1, type 2 CHRD 9.1d Chordin GATA4 13.7b GATA binding protein 4 GJA1 –3.4d Connexin 43, gap junction a3 KDR –3.4b Kinase insert domain receptor NKX2-5 15.5b Homeobox protein Nkx 2.5 PITX2 12.4d Paired-like homeodomain transcription factor 2 RUNX1 60.9d Runt-related transcription factor 1 RUNX2 14.3b Runt-related transcription factor 2 SOX9 5.8c SRY (sex determining region Y)-box 9 Continued T 38.1d Brachyury TBX5 7.6c T box transcription factor TIE −11. 8 b Receptor tyrosine kinase VEGF 13.2b Vascular endothelial growth factor Ectoderm EN1 2.7b Engrailed homeobox 1 FN1 68.6c Fibronectin 1 HOXB4 24.5c Homeobox protein B4 Gene Fold-change Description Ectoderm MMP2 10.8d Matrix metalloproteinase 2 MSI2 2.6b Musashi homolog 2 MYL4 5.3b Myosin light chain 4 NOG 44.4c Noggin SOX3 −5.2d SRY (sex determining region Y)-box 3 Endoderm GATA6 7.3b GATA binding protein 6 HNF4A 3.5b Hepatocyte nuclear factor 4 a NODAL −2.0b Nodal Others AKT1 4.3d Protein kinase B, PKB b CEBPB 4.3c CCAAT/enhancer binding protein b CEBPG 3.9c CCAAT/enhancer binding protein g COL4A1 3.4c Collagen, type IV, a 1 CRABP1 −11 . 8 c Cellular retinoic acid binding protein DAB2 10.5c Disabled homolog 2 FST 4.7b Follistatin FZD1 6.3b Frizzled homolog 1 GREM1 −4.8b Gremlin 1 ID3 2.4b Inhibitor of DNA binding 3dominant negative HLH protein IL6 80.1b Interleukin 6 LAMA5 2.7b Laminin, a 5 NEFH −5.3b Neurofilament heavy polypeptide NROB1 6.4c DAX-1 (nuclear receptor subfamily 0, group B, member 1) OTX2 −13.1b Orthodenticle homeobox 2 POMC −8.4b Proopiomelenocortin PTCH 2.6b Protein patched homolog 1 PTGS2 5.2c Prostaglandin enteroperoxide synthase PTEN −3.4b Phosphatase and tensin homolog SMAD3 3.8b Smad 3 (Mad homolog 3) VCAM1 30.5b Vascular cell adhesion protein 1 WNT4 3.2c Wingless type 4 aGenes altered in expression 2-fold or more (see Figure 1); bP > 0.10; cP ≤ 0.10; dP ≤ 0. Copyright © 2012 SciRes. OPEN ACCESS  M. L. Shirley et al. / Stem Cell Discovery 2 (2012) 163-175 Copyright © 2012 SciRes. 168 many common genes, including ones we also found to be up-regulated: FST, IL6, and VCAM1. Overall, BMP4 resulted either in no increase, and of- ten even a down-regulation, of many genes associated with ectoderm (e.g. EN2, EOMES , EXO1, FGF13, MSI1, NEFH, NES, NR4A2, PAX 6, PITX3, and SOX3), endo- derm (e.g. AFP, CER1, and NODAL), and mesoderm (e.g. CD34, GJA1, GSC, KD R, LMO2, SDNSF, TBX1, and TIE). There are, however, important exceptions. Several canonical mesodermal gene markers were up-regulated, BMP4, BMPR2, CDH5, CDH11, CHRD , GATA4, NKX2-5, PITX2, RUNX1, RUNX2, SOX9, T, TBX5, and VEGF, as were the ectodermal markers, EN1, FN1, HOXB4, MMP2, MSI2, MYL4, and NOG, and the endodermal markers, GATA6 and HNF4A. Our transcriptome profiling also revealed the up-regulation of additional genes, including AKT1, CEBPB, CEBPG, COL4A1, DAB2, FST, FZD1, IL6, LAMA5, NROB1, PTCH, PTGS2, SMAD3, VCAM1, and WNT4, and the down-regulation of CRABP1, GREM1, LHCGR, NEFH , OTX2, POMC, PTEN, and THBS2. The regulation of CEBPB, RUNX2, SOX9, and VEGF by BMP4 has not, to the best of our knowledge, been re- ported by others. OPEN ACCESS The results in Figure 1 demonstrate that noggin alone altered the transcription of several of the 177 genes sur- veyed. Genes that were up-regulated include AFP, AKT1 CDH5, CEBPG, CER1, EBAF, EOMES, FGF4, GBX2, GSC, HNF4A, IL6, LHCGR, OTX2, POU5F1, SOX2, T, TBX5, THBS 2, and VCAM1. In addition, noggin down- regulated a number of genes, CYP19A1, EN1, EN2, EPAS1, FST, GREM1, MMP2, MMP9, NF KB 1, NOG, NROB1, PGF, PITX2, PTGS2, SOX3, SOX9, and TFAP2A. It is worthy of note that the transcription of three of these down-regulated genes, CYP19A1, EN2, and TFAP2A, fall below the level of detection following treatment with noggin, i.e. Ct greater than 35. Genes highlighted above that were altered similarly by both BMP4 and noggin, albeit in some cases to a greater or lesser degree, include, up-regulation: AKT1, CDH5, CEBPG, IL6, TBX5, VCAM1; and down-regulation: GREM1 and SOX3. These results may imply non-specific action of BMP4 and/or direct effects of noggin. Of the genes surveyed, 31 were not expressed suffi- ciently to be accurately determined and hence could not be included in Figure 1. These genes are listed in the Supplement (Figure S1). Phase-contrast microscopic images of the hESCs are given in the Supplement (Figure S1) showing control cells and cells incubated with BMP4 and with noggin. Consistent with the transcriptome profiling results, he- terogeneity is apparent, but the BMP4-treated cells give more the appearance of syncytiotrophobla st while the noggin-treated cells are quite distinct. Hormone production: The media concentrations of hCG, progesterone, and estradiol were measured daily, up to seven days, for cells incubated with BMP4 and with noggin (Figure 2). Following incubation with BMP4, the three hormones increased on days 6 and 7 relative to control cells. As expected, noggin itself had no effect on hormone production. The concentrations reached on day 7 with BMP4 are about 15, 10, and 0.6 ng/mL for hCG, progesterone, and estradiol, respectively. 3.2. Gene Expression and Hormone Production in EB Gene expression: Expression of 74 genes by EBs is presented as a heatmap (derived from mean values of ) in Figure 3 at 22 and 50 days, each relative to day 5. Some of the more prominently expressed genes up-regulated at day 22 and/or day 50 include AFP, CGB , CHRD, DAB2, HSPG2, INHBA, PGF, PTGS2, RUNX1, TIMP1, and VEGF, only a few of which are tropho- blast-associated. Most of the genes shown in Figure 3 are, however, either down-regulated or exhibit no appre- ciable change over time. Of the genes surveyed, an arbi- trary selection of the 15 most highly expressed at day 5, as assessed by dCt values, are (in decreasing order): t ddc 2− (a) (b) (c) Figure 2. Medium concentrations of hCG (a), progesterone (b), and estradiol (c) of hESC. The cells were incubated in medium alone (CON), in medium containing BMP4 (BMP), or in medium with noggin (NOG). 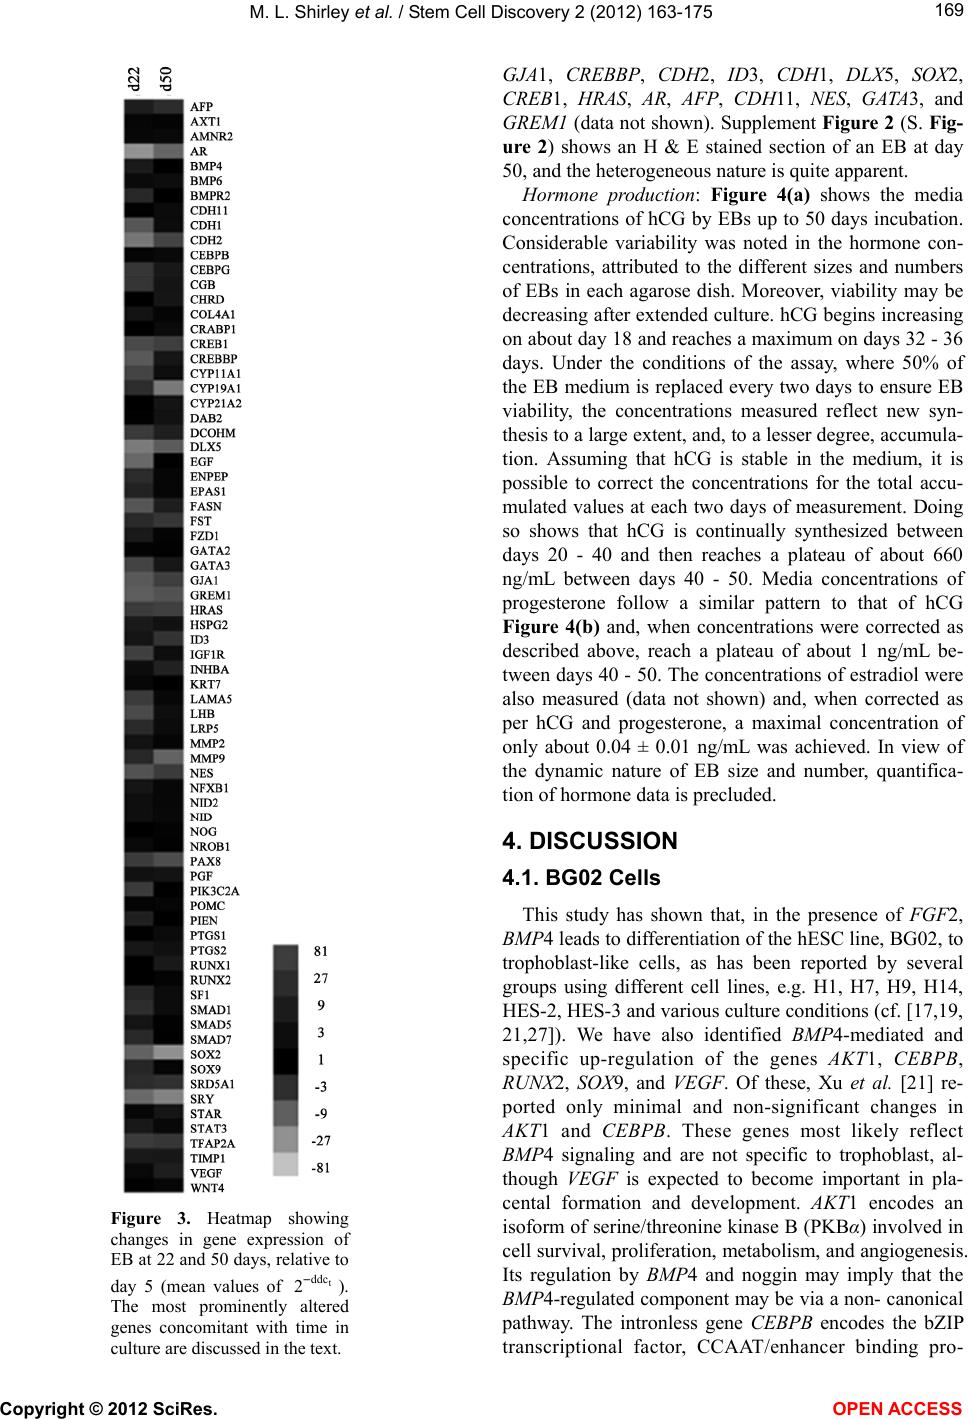 M. L. Shirley et al. / Stem Cell Discovery 2 (2012) 163-175 169 Figure 3. Heatmap showing changes in gene expression of EB at 22 and 50 days, relative to day 5 (mean values of ). The most prominently altered genes concomitant with time in culture are discussed in the text. t ddc 2− GJA1, CREBBP, CDH2, ID3, CDH1, DLX5, SOX2, CREB1, HRAS, AR, AFP, CDH11, NES , GATA3, and GREM1 (data not shown). Supplement Figure 2 (S. Fig- ure 2) shows an H & E stained section of an EB at day 50, and the heterogeneous nature is quite apparent. Hormone production: Figure 4(a) shows the media concentrations of hCG by EBs up to 50 days incubation. Considerable variability was noted in the hormone con- centrations, attributed to the different sizes and numbers of EBs in each agarose dish. Moreover, viability may be decreasing after extended culture. hCG begins increasing on about day 18 and reaches a maximum on days 32 - 36 days. Under the conditions of the assay, where 50% of the EB medium is replaced every two days to ensure EB viability, the concentrations measured reflect new syn- thesis to a large extent, and, to a lesser degree, accumula- tion. Assuming that hCG is stable in the medium, it is possible to correct the concentrations for the total accu- mulated values at each two days of measurement. Doing so shows that hCG is continually synthesized between days 20 - 40 and then reaches a plateau of about 660 ng/mL between days 40 - 50. Media concentrations of progesterone follow a similar pattern to that of hCG Figure 4(b) and, when concentrations were corrected as described above, reach a plateau of about 1 ng/mL be- tween days 40 - 50. The concentrations of estradiol were also measured (data not shown) and, when corrected as per hCG and progesterone, a maximal concentration of only about 0.04 ± 0.01 ng/mL was achieved. In view of the dynamic nature of EB size and number, quantifica- tion of hormone data is precluded. 4. DISCUSSION 4.1. BG02 Cells This study has shown that, in the presence of FGF2, BMP4 leads to differentiation of the hESC line, BG02, to trophoblast-like cells, as has been reported by several groups using different cell lines, e.g. H1, H7, H9, H14, HES-2, HES-3 and various culture conditions (cf. [17,19, 21,27]). We have also identified BMP4-mediated and specific up-regulation of the genes AKT1, CEBPB, RUNX2, SOX9, and VEGF. Of these, Xu et al. [21] re- ported only minimal and non-significant changes in AKT1 and CEBPB. These genes most likely reflect BMP4 signaling and are not specific to trophoblast, al- though VEGF is expected to become important in pla- cental formation and development. AKT1 encodes an isoform of serine/threonine kinase B (PKBα) involved in cell survival, proliferation, metabolism, and angiogenesis. Its regulation by BMP4 and noggin may imply that the BMP4-regulated component may be via a non- canonical pathway. The intronless gene CEBPB encodes the bZIP transcriptional factor, CCAAT/enhancer binding pro- Copyright © 2012 SciRes. OPEN ACCESS 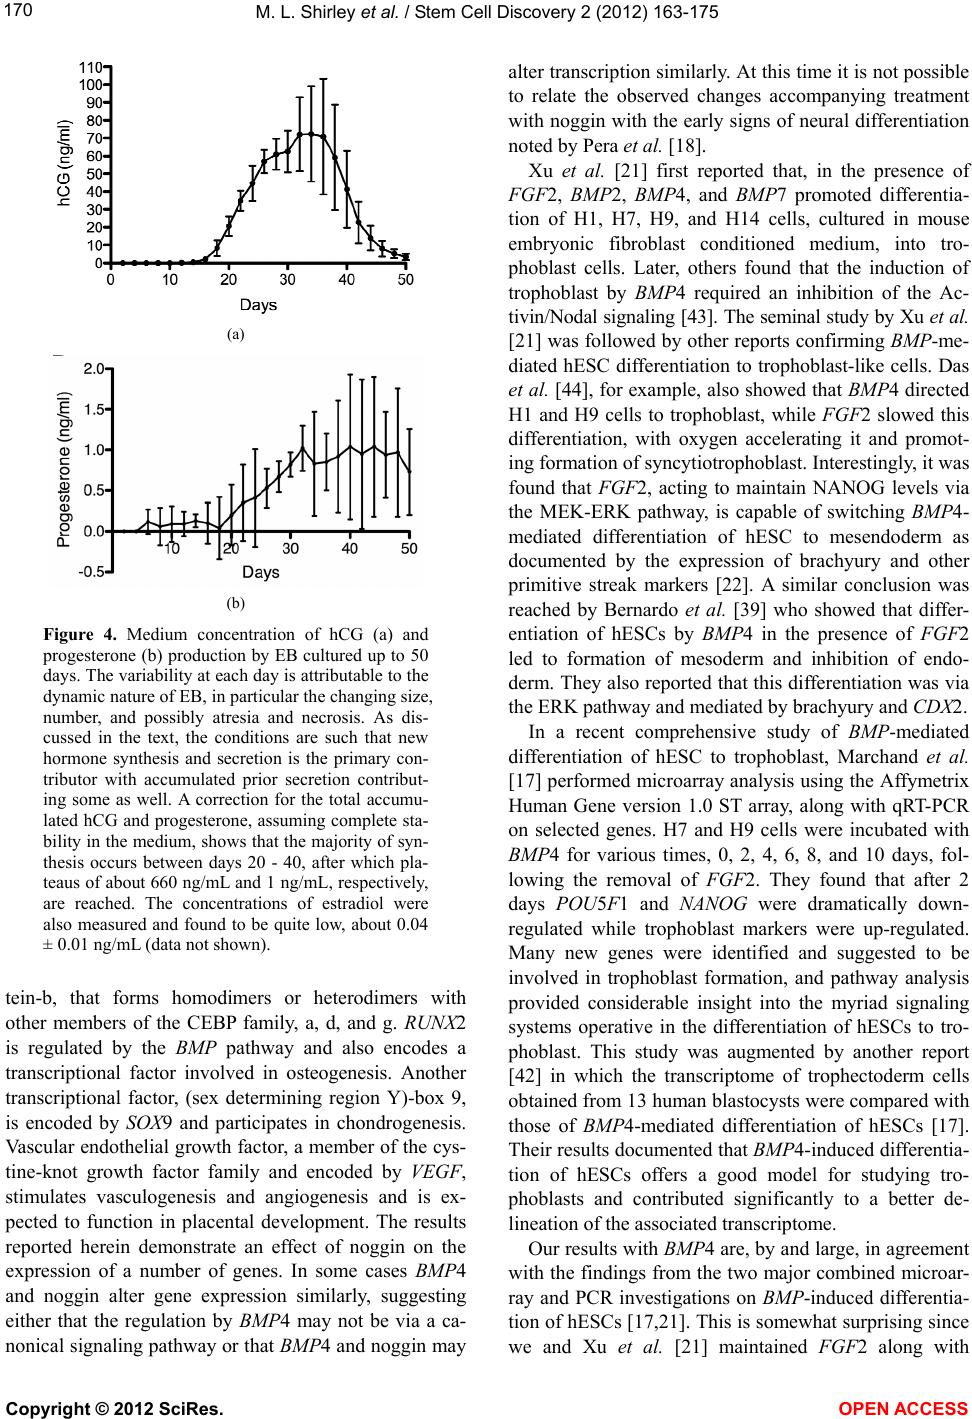 M. L. Shirley et al. / Stem Cell Discovery 2 (2012) 163-175 170 (a) (b) Figure 4. Medium concentration of hCG (a) and progesterone (b) production by EB cultured up to 50 days. The variability at each day is attributable to the dynamic nature of EB, in particular the changing size, number, and possibly atresia and necrosis. As dis- cussed in the text, the conditions are such that new hormone synthesis and secretion is the primary con- tributor with accumulated prior secretion contribut- ing some as well. A correction for the total accumu- lated hCG and progesterone, assuming complete sta- bility in the medium, shows that the majority of syn- thesis occurs between days 20 - 40, after which pla- teaus of about 660 ng/mL and 1 ng/mL, respectively, are reached. The concentrations of estradiol were also measured and found to be quite low, about 0.04 ± 0.01 ng/mL (data not shown). tein-b, that forms homodimers or heterodimers with other members of the CEBP family, a, d, and g. RUNX2 is regulated by the BMP pathway and also encodes a transcriptional factor involved in osteogenesis. Another transcriptional factor, (sex determining region Y)-box 9, is encoded by SOX9 and participates in chondrogenesis. Vascular endothelial growth factor, a member of the cys- tine-knot growth factor family and encoded by VEGF, stimulates vasculogenesis and angiogenesis and is ex- pected to function in placental development. The results reported herein demonstrate an effect of noggin on the expression of a number of genes. In some cases BMP4 and noggin alter gene expression similarly, suggesting either that the regulation by BMP4 may not be via a ca- nonical signaling pathway or that BMP4 and noggin may alter transcription similarly. At this time it is not possible to relate the observed changes accompanying treatment with noggin with the early signs of neural differentiation noted by Pera et al. [18]. Xu et al. [21] first reported that, in the presence of FGF2, BMP2, BMP4, and BMP7 promoted differentia- tion of H1, H7, H9, and H14 cells, cultured in mouse embryonic fibroblast conditioned medium, into tro- phoblast cells. Later, others found that the induction of trophoblast by BMP4 required an inhibition of the Ac- tivin/Nodal signaling [43]. The seminal study by Xu et al. [21] was followed by other reports confirming BMP-me- diated hESC differentiation to trophoblast-like cells. Das et al. [44], for example, also showed that BMP4 directed H1 and H9 cells to trophoblast, while FGF2 slowed this differentiation, with oxygen accelerating it and promot- ing formation of syncytiotrophoblast. Interestingly, it was found that FGF2, acting to maintain NANOG levels via the MEK-ERK pathway, is capable of switching BMP4- mediated differentiation of hESC to mesendoderm as documented by the expression of brachyury and other primitive streak markers [22]. A similar conclusion was reached by Bernardo et al. [39] who showed that differ- entiation of hESCs by BMP4 in the presence of FGF2 led to formation of mesoderm and inhibition of endo- derm. They also reported that this differentiation was via the ERK pathway and mediated by brachyury and CDX2. In a recent comprehensive study of BMP-mediated differentiation of hESC to trophoblast, Marchand et al. [17] performed microarray analysis using the Affymetrix Human Gene version 1.0 ST array, along with qRT-PCR on selected genes. H7 and H9 cells were incubated with BMP4 for various times, 0, 2, 4, 6, 8, and 10 days, fol- lowing the removal of FGF2. They found that after 2 days POU5F1 and NANOG were dramatically down- regulated while trophoblast markers were up-regulated. Many new genes were identified and suggested to be involved in trophoblast formation, and pathway analysis provided considerable insight into the myriad signaling systems operative in the differentiation of hESCs to tro- phoblast. This study was augmented by another report [42] in which the transcriptome of trophectoderm cells obtained from 13 human blastocysts were compared with those of BMP4-mediated differentiation of hESCs [17]. Their results documented that BMP4-induced differentia- tion of hESCs offers a good model for studying tro- phoblasts and contributed significantly to a better de- lineation of the associated transcriptome. Our results with BMP4 are, by and large, in agreement with the findings from the two major combined microar- ray and PCR investigations on BMP-induced differentia- tion of hESCs [17,21]. This is somewhat surprising since we and Xu et al. [21] maintained FGF2 along with Copyright © 2012 SciRes. OPEN ACCESS  M. L. Shirley et al. / Stem Cell Discovery 2 (2012) 163-175 171 BMP4, while Marchand et al. [17] removed FGF2 from the medium when BMP4 was added. A summary of many of the genes found to be altered in the present study compared to other reports is given in the Supplement (S.2). A major difference between our results and those of Marchand et al. [17] is in the expression of the meso- dermal markers, BMP4 and T. We observed increased expression of these two genes, while they reported a de- crease or no change, attributable to their removal of FGF2 during BMP-mediated differentiation. Of interest, they found increased expression of KDR, while we noted a minimal decrease, albeit not significant. Increased ex- pression of MMP9 was found herein, consistent with the findings of Xu et al. [21] and Schultz et al. [19], but Marchand et al. [17] reported down-regulation. With the BG02 cells, we found reduced expression of the pluripo- tent marker, FOXH1, whereas others did not [17,21]. These discrepancies may reflect cell-specific differences, culture differences, e.g. ±FGF2, or other factors. While it has been convincingly documented that members of the BMP family lead to differentiation of hESC to trophoblast, there is also considerable evidence that experimental conditions have a profound effect on the type of differentiation obtained. For example, an ear- lier report on BMP4-mediated differentiation of BG02 cells identified the formation and outgrowth of an im- mature vascular system when the cells are grown in a 3D Matrigel substrate in an endothelial cell growth medium [13]. Further, Pera et al. [18] found that, in response to BMP2, BMP4, or BMP2/7, HES-2 and HES-3 hESC dif- ferentiated to extra-embryonic endoderm, with only a few percent of the cells having the appearance of the trophoblast precursors described by Xu et al. [21]. They also found that the BMP antagonist noggin blocks the differentiation to extra-embryonic endoderm and directs differentiation into neural precursors, differentiation that may be mimicked by secretion of gremlin by mouse em- bryo fibroblast feeder layers. Our results with noggin reflect some type(s) of differentiation, but there is no clear indication for preference of one major pathway. As judged by increased expression of T, MIXL1, and WNT3, others have found that short-term treatment of H1, H7, and H9 hESC with BMP4 resulted in the induction of mesoderm progenitor cells that can differentiate into he- matopoietic and cardiac lineages [24]. Working with H7 cells, it was reported that BMP4 treatment failed to yield trophectoderm using mouse embryonic fibroblasts as a feeder layer; this, however, was overcome by using feeder-free cells on Geltrex-coated plates in StemPro [38]. Lastly, West et al. [45] have demonstrated that, in the presence of BMP4, the KIT ligand enhances differen- tiation to germ-like cells. Hence, additional work is needed to clarify the many experimental parameters associated with BMP-induced differentiation of hESC. 4.2. EB Derived from BG02 Cells EB formation by these cells also yielded some degree of differentiation to trophoblast as evidenced by the up-regulation of CGB and the production of hCG and progesterone. The most highly expressed genes in EB on day 5 are: GJA1, CREBBP, CDH2, ID3, CDH1, DLX5, SOX2, CREB1, HRAS, AR, and AFP. Most of these were surveyed in the studies on cells receiving BMP4, and none were up-regulated. The results suggest that tro- phoblast-like cells are not forming to any significant ex- tent by day 5, findings consistent with the absence of hCG and progesterone production until days 18 - 20. These data are consistent with those by Gerami-Naini et al. [8] on H1 cell-derived EB growing in Matrigel. They could not detect measureable hormone until about day 20 of culture, and, depending upon the conditions used, maxi- mal production of hCG was reached on days 35 - 40, fol- lowed by a decline. In contrast to the results with the Matrigel-embedded EB, they found that in suspension culture EBs were producing hCG, progesterone, and es- tradiol by 48 h. In our studies, a comparison of gene expression by EB on days 22 and 50, relative to day 5, with that of hESC receiving BMP4 for 7 days, provides additional evidence that differentiation to trophoblast is occurring by day 22, as evidenced by the up-regulation of CGB, PGF, PTGS2, RUNX1, and VEGF. These results are consistent with the hormone secretion data for hCG and progesterone. In addition to the above genes, there is also up-regulation of AFP, BMP6, CHD11, CHRD , DAB2, HSPG2, INHBA, PTGS2, and TIMP1. Not surprisingly, the EBs are ap- parently more heterogeneous in terms of constituent cell types than the BMP4-treated hESCs. For example, the early appearance (day 5) of GJA1, CREBBP, CDH2, ID3, CDH1, DLX5, SOX2, CREB1, HRAS, AR, AFP, CDH11, NES, GATA3, and GREM1, followed by the later up-regulation of AFP, BMP6, CHD11, CHR D, DAB2, HSPG2, INHBA, PTGS2, and TIMP1, indicates forma- tion of trophoblast, endoderm, ectoderm, and mesoderm. Consistent with this finding was the observation some years ago that markers for the three embryonic germ la- yers were expressed in EBs prepared from H9 cells [46]. 5. CONCLUSION Overall, the results presented herein strongly support other reports concluding that, under certain conditions, BMP4 directs differentiation of hESCs to trophoblast- like cells. This conclusion notwithstanding, it is clear that experimental conditions, particularly the inclusion or exclusion of FGF2 during BMB-mediated differentiation, have a profound effect on the type of differentiation Copyright © 2012 SciRes. OPEN ACCESS  M. L. Shirley et al. / Stem Cell Discovery 2 (2012) 163-175 172 achieved, and, moreover, based on our transcriptome profiling, it is highly likely that other cell types may be forming in response to BMP4. On the other hand, it may emerge that some of the other genes we found to have been up-regulated by BMP4 function in differentiation to trophectoderm and then to cytotrophoblasts (villous and extravillous) and syncytiotrophoblasts, or be involved in placental formation and function. The heterogeneity of the differentiated cells needs to be carefully established, but the BMP-mediated differentiation of hESCs to tro- phoblast, particularly in the absence of FGF2, certainly provides an attractive in vitro system for studying early differentiation events and gives a more homogeneous system than that of embryoid bodies. Lastly, our obser- vation that the BMP4 antagonist noggin alters gene tran- scription of a subset of genes investigated may correlate with the morphological changes reported by others; however, more studies are required to map the transcrip- tional changes to neural differentiation. 6. ACKNOWLEDGEMENTS We thank Mr. Roger Nilsen of the University of Georgia Functional Genomics Resource Facility for his expert assistance with the RNA analysis. This study was supported by NIH: R01DK033973 (D.P.), R01HD044119 (P.N.), and 5F32HL083741 (N.L.B.). REFERENCES [1] Rama, S. and Rao, A.J. (2003) Regulation of growth and function of the human placenta. Molecular and Cellular Biochemistry, 253, 263-268. doi:10.1023/A:1026076219126 [2] Sullivan, M.H. (2004) Endocrine cell lines from the pla- centa. Molecular and Cellular Endocrinology, 228, 103- 119. doi:10.1016/j.mce.2003.03.001 [3] Udayashankar, R., Baker, D., Tuckerman, E., Laird, S., Li, T.C. and Moore, H.D. (2011) Characterization of invasive trophoblasts generated from human embryonic stem cells. Human Reproduction, 26, 398-406. doi:10.1093/humrep/deq350 [4] Jameson, J.L. and Hollenberg, A.N. (1993) Regulation of chorionic gonadotropin gene expression. Endocrine Re- views, 14, 203-221. [5] Mesiano, S. (2009) The endocrinology of human preg- nancy and fetoplacental neuroendocrine development. In: Strauss, J.F. and Barbieri, R.L., Eds., Yen and Jaffe’s Re- productive Endocrinology. 6th Edition, Physiology, Patho- physiology and Clinical Management, Philadelphia, 249- 281. [6] Thomson, J.A., Itskovitz-Eldor. J., Shapiro, S.S., Waknitz, M.A., Swiergiel, J.J., Marshall, V.S. and Jones, J.M. (1998) Embryonic stem cell lines derived from human blastocysts. Science, 282, 1145-1147. doi:10.1126/science.282.5391.1145 [7] Mitalipova, M., Calhoun, J., Shin, S., Wininger, D., Sch- ulz, T., Noggle, S., Venable, A., Lyons, I., Robins, A. and Stice, S. (2003) Human embryonic stem cell lines derived from discarded embryos. Stem Cells, 21, 521-526. doi:10.1634/stemcells.21-5-521 [8] Gerami-Naini, B., Dovzhenko, O.V., Durning, M., Wegner, F.H., Thomson, J.A. and Golos, T.G. (2004) Trophoblast differentiation in embryoid bodies derived from human embryonic stem cells. Endocrinology, 145, 1517-1524. doi:10.1210/en.2003-1241 [9] Giakoumopoulos, M., Siegfried, L.M., Dambaeva, S.V., Garthwaite, M.A., Glennon, M.C. and Golos, T.G. (2010) Placental-derived mesenchyme influences chorionic go- nadotropin and progesterone secretion of human embry- onic stem cell-derived trophoblasts. Reproductive Science, 17, 798-808. doi:10.1177/1933719110371853 [10] Golos, T.G., Pollastrini, L.M. and Gerami-Naini, B. (2006) Human embryonic stem cells as a model for trophoblast differentiation. Semin Reproductive Medicine, 24, 314- 321. doi:10.1055/s-2006-952154 [11] Harun, R., Ruban, L., Matin, M., Draper, J., Jenkins, N.M., Liew, G.C., Andrews, P.W., Li, T.C., Laird, S.M. and Moore, H.D. (2006) Cytotrophoblast stem cell lines derived from human embryonic stem cells and their ca- pacity to mimic invasive implantation events. Human Reproduction, 21, 1349-1358. doi:10.1093/humrep/del017 [12] Peiffer, I., Belhomme, D., Barbet, R., Haydont, V., Zhou, Y.P., Fortunel, N.O., Li, M., Hatzfeld, A., Fabiani, J.N. and Hatzfeld, J.A. (2007) Simultaneous differentiation of endothelial and trophoblastic cells derived from human embryonic stem cells. Stem Cells and Development, 16, 393-402. doi:10.1089/scd.2006.0013 [13] Boyd, N.L., Dhara, S.K., Rekaya, R., Godbey, E.A., Has- neen, K., Rao, R.R., West, F.D., Gerwe, B.A. and Stice, S.L. (2007) BMP4 promotes formation of primitive vas- cular networks in human embryonic stem cell-derived embryoid bodies. Experimental Biology and Medicine, 232, 833-843. [14] Chen, G., Ye, Z., Yu, X., Zou, J., Mali, P., Brodsky, R.A. and Cheng, L. (2008) Trophoblast differentiation defect in human embryonic stem cells lacking PIG-A and GPI-anchored cell-surface proteins. Cell Stem Cell, 2, 345-355. doi:10.1016/j.stem.2008.02.004 [15] Kee, K., Gonsalves, J.M., Clark, A.T. and Pera, R.A. (2006) Bone morphogenetic proteins induce germ cell differentiation from human embryonic stem cells. Stem Cells and Development, 15, 831-837. doi:10.1089/scd.2006.15.831 [16] Liu, Y.P., Dovzhenko, O.V., Garthwaite, M.A., Dambaeva, S.V., Durning, M., Pollastrini, L.M. and Golos, T.G. (2004) Maintenance of pluripotency in human embryonic stem cells stably over-expressing enhanced green fluorescent protein. Stem Cells and Development, 13, 636-645. doi:10.1089/scd.2004.13.636 [17] Marchand, M., Horcajadas, J.A., Esteban, F.J., McElroy, S.L., Fisher, S.J. and Giudice, L.C. (2011) Transcriptomic signature of trophoblast differentiation in a human em- bryonic stem cell model. Biology of Reproduction, 84, 1258-1271. doi:10.1095/biolreprod.110.086413 [18] Pera, M.F., Andrade, J., Houssami, S., Reubinoff, B., Copyright © 2012 SciRes. OPEN ACCESS  M. L. Shirley et al. / Stem Cell Discovery 2 (2012) 163-175 173 Trounson, A., Stanley, E.G., Ward-van Oostwaard, D. and Mummery, C. (2004) Regulation of human embryonic stem cell differentiation by BMP-2 and its antagonist noggin. Journal of Cell Science, 117, 1269-1280. doi:10.1242/jcs.00970 [19] Schulz, L.C., Ezashi, T., Das, P., Westfall, S.D., Livingston, K.A. and Roberts, R.M. (2008) Human embryonic stem cells as models for trophoblast differentiation. Placenta, 29, S10-S16. [20] Xu R.H. (2006) In vitro induction of trophoblast from human embryonic stem cells. Methods in Molecular Me- dicine, 121, 189-202. [21] Xu, R.H., Chen, X., Li, D.S., Li, R., Addicks, G.C., Glen- non, C., Zwaka, T.P. and Thomson, J.A. (2002) BMP4 initiates human embryonic stem cell differentiation to tro- phoblast. Nature Biotechnology, 20, 1261-1264. doi:10.1038/nbt761 [22] Yu, P., Pan, G., Yu, J. and Thomson, J.A. (2011) FGF2 sustains NANOG and switches the outcome of BMP4- induced human embryonic stem cell differentiation. Cell Stem Cell, 8, 326-334. doi:10.1016/j.stem.2011.01.001 [23] Yu, X., Zou, J., Ye, Z., Hammond, H., Chen, G., Toku- naga, A., Mali, P., Li, Y.M., Civin, C., Gaiano, N. and Cheng, L. (2008) Notch signaling activation in human embryonic stem cells is required for embryonic, but not trophoblastic, lineage commitment. Cell Stem Cell, 2, 461-471. doi:10.1016/j.stem.2008.03.001 [24] Zhang, P., Li, J., Tan, Z., Wang, C., Liu, T., Chen, L., Yong, J., Jiang, W., Sun, X., Du, L., Ding, M. and Deng, H. (2008) Short-term BMP-4 treatment initiates meso- derm induction in human embryonic stem cells. Blood, 111, 1933-1941. doi:10.1182/blood-2007-02-074120 [25] Douglas, G.C., Vande-Voort, C.A., Kumar, P., Chang, T.C. and Golos, T.G. (2009) Trophoblast stem cells: Models for investigating trophectoderm differentiation and placental development. Endocrine Reviews, 30, 228-240. doi:10.1210/er.2009-0001 [26] Golos, T.G., Giakoumopoulos, M. and Garthwaite, M.A. (2010) Embryonic stem cells as models of trophoblast differentiation: Progress, opportunities, and limitations. Reproduction, 140, 3-9. doi:10.1530/REP-09-0544 [27] Pera M.F. and Trounson A.O. (2004) Human embryonic stem cells: Prospects for development. Development, 131, 5515-5525. doi:10.1242/dev.01451 [28] Roberts, R.M., Ezashi, T. and Das, P. (2004) Trophoblast gene expression: Transcription factors in the specification of early trophoblast. Reproductive Biology and Endocri- nology, 2, 47. doi:10.1186/1477-7827-2-47 [29] Hay, D.C., Sutherland, L., Clark, J. and Burdon, T. (2004) Oct-4 knockdown induces similar patterns of endoderm and trophoblast differentiation markers in human and mouse embryonic stem cells. Stem Cells, 22, 225-235. doi:10.1634/stemcells.22-2-225 [30] Matin, M.M., Walsh, J.R., Gokhale, P.J., Draper, J.S., Bahrami, A.R., Morton, I., Moore, H.D. and Andrews, P.W. (2004) Specific knockdown of Oct4 and beta 2-mi- croglobulin expression by RNA interference in human embryonic stem cells and embryonic carcinoma cells. Stem Cells, 22, 659-668. doi:10.1634/stemcells.22-5-659 [31] Bragdon, B., Moseychuk, O., Saldanha, S., King, D., Julian, J. and Nohe, A. (2011) Bone morphogenetic pro- teins: A critical review. Cell Signal, 23, 609-620. doi:10.1016/j.cellsig.2010.10.003 [32] Rider, C.C. and Mulloy, B. (2010) Bone morphogenetic protein and growth differentiation factor cytokine fami- lies and their protein antagonists. The Biochemical Jour- nal, 429, 1-12. doi:10.1042/BJ20100305 [33] Walsh, D.W., Godson, C., Brazil, D.P. and Martin, F. (2010) Extracellular BMP-antagonist regulation in de- velopment and disease: Tied up in knots. Trends in Cell Biology, 20, 244-256. doi:10.1016/j.tcb.2010.01.008 [34] Zeng, S., Chen, J. and Shen, H. (2010) Controlling of bone morphogenetic protein signaling. Cell Signal, 22, 888-893. doi:10.1016/j.cellsig.2009.12.007 [35] Malassine, A., Frendo, J.L. and Evain-Brion, D. (2003) A comparison of placental development and endocrine functions between the human and mouse model. Human Reproduction, 9, 531-539. doi:10.1093/humupd/dmg043 [36] Rossant, J. (2001) Stem cells from the mammalian blas- tocyst. Stem Cells, 19, 477-482. doi:10.1634/stemcells.19-6-477 [37] Smith, A.G. (2001) Embryo-derived stem cells of mice and men. Annual Reviews of Cell and Developmental Bi- ology, 17, 435-462. doi:10.1146/annurev.cellbio.17.1.435 [38] Erb, T.M., Schneider, C., Mucko, S.E., Sanfilippo, J.S., Lowry, N.C., Desai, M.N., Mangoubi, R.S., Leuba, S.H. and Sammak, P.J. (2011) Paracrine and epigenetic control of trophectoderm differentiation from human embryonic stem cells: the role of bone morphogenic protein 4 and histone deacetylases. Stem Cells Development, 20, 1601- 1614. doi:10.1089/scd.2010.0281 [39] Bernardo, A.S., Faial, T., Gardner, L., Niakan, K.K., Ort- mann, D., Senner, C.E., Callery, E.M., Trotter, M.W., Hemberger, M., Smith, J.C., Bardwell, L., Moffett, A. and Pedersen, R.A. (2011) BRACHYURY and CDX 2 mediate BMP-induced differentiation of human and mouse pluri- potent stem cells into embryonic and extra embryonic lineages. Cell Stem Cell, 9, 144-155. doi:10.1016/j.stem.2011.06.015 [40] Livak, K.J. and Schmittgen, T.D. (2001) Analysis of rela- tive gene expression data using real-time quantitative PCR and the 2(-delta delta C(T)) method. Methods, 25, 402-408. [41] Pfaffl, M.W. (2001) A new mathematical model for rela- tive quantification in real-time RT-PCR. Nucleic Acids Research, 29, e45. doi:10.1093/nar/29.9.e45 [42] Aghajanova, L., Shen, S., Rojas, A.M., Fisher, S.J., Irwin, J.C. and Giudice, L.C. (2012) Comparative transcriptome analysis of human trophectoderm and embryonic stem cell-derived trophoblasts reveal key participants in early implantation. Biology and Reproduction, 86, 1-21. doi:10.1095/biolreprod.111.092775 [43] Wu, Z., Zhang, W., Chen, G., Cheng, L., Liao, J., Jia, N., Gao, Y., Dai, H., Yuan, J. and Xiao, L. (2008) Combina- torial signals of activin/nodal and bone morphogenic pro- tein regulate the early lineage segregation of human em- bryonic stem cells. The Journal of Biological Chemistry, Copyright © 2012 SciRes. OPEN ACCESS 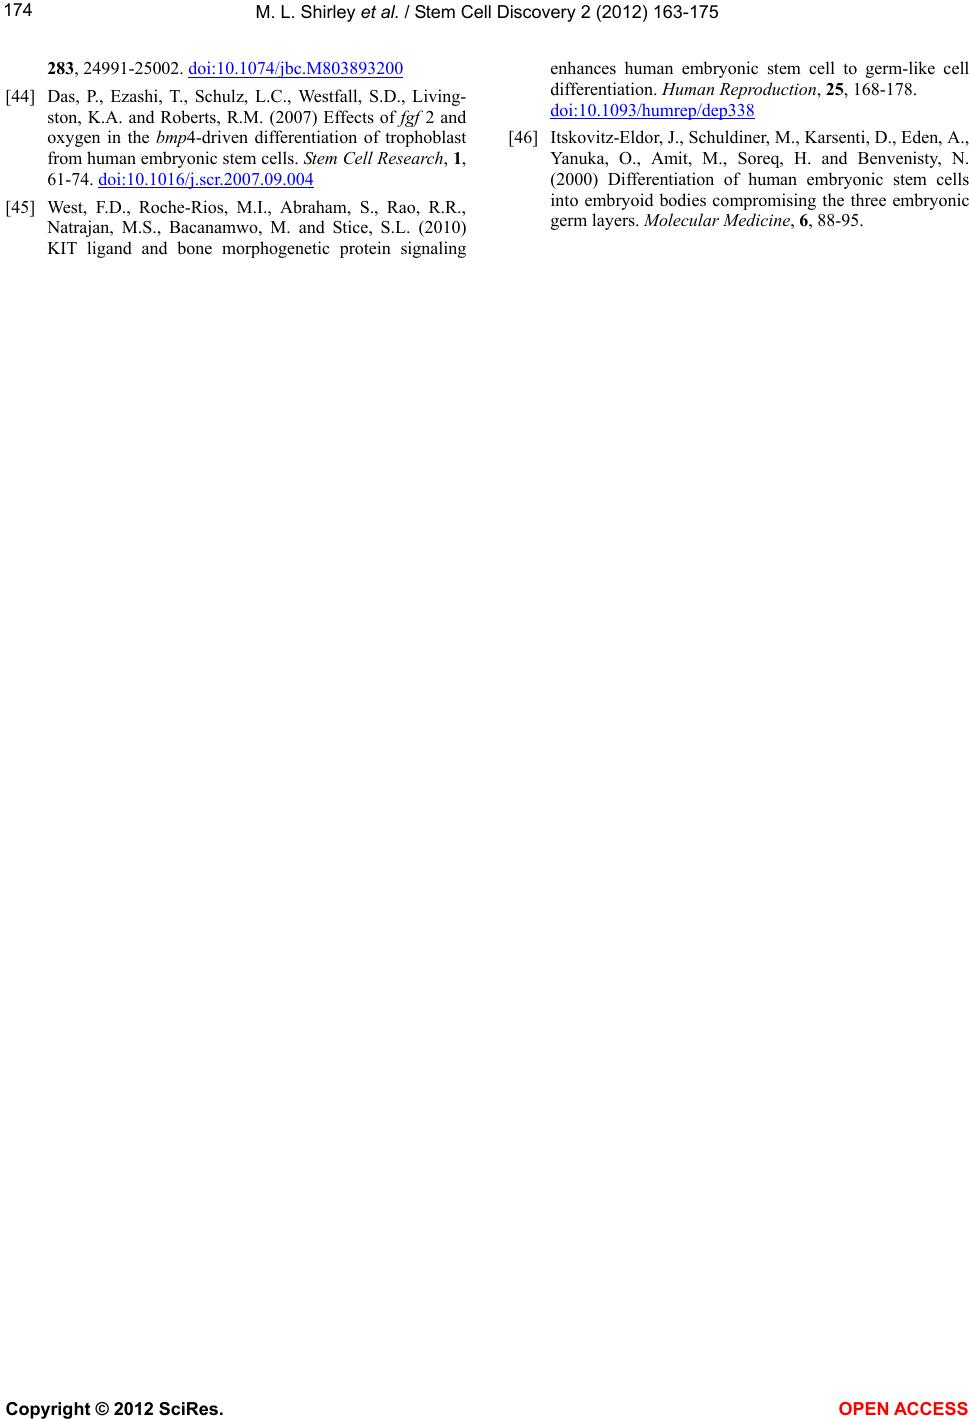 M. L. Shirley et al. / Stem Cell Discovery 2 (2012) 163-175 Copyright © 2012 SciRes. OPEN ACCESS 174 283, 24991-25002. doi:10.1074/jbc.M803893200 [44] Das, P., Ezashi, T., Schulz, L.C., Westfall, S.D., Living- ston, K.A. and Roberts, R.M. (2007) Effects of fgf 2 and oxygen in the bmp4-driven differentiation of trophoblast from human embryonic stem cells. Stem Cell Research, 1, 61-74. doi:10.1016/j.scr.2007.09.004 [45] West, F.D., Roche-Rios, M.I., Abraham, S., Rao, R.R., Natrajan, M.S., Bacanamwo, M. and Stice, S.L. (2010) KIT ligand and bone morphogenetic protein signaling enhances human embryonic stem cell to germ-like cell differentiation. Human Reproduction, 25, 168-178. doi:10.1093/humrep/dep338 [46] Itskovitz-Eldor, J., Schuldiner, M., Karsenti, D., Eden, A., Yanuka, O., Amit, M., Soreq, H. and Benvenisty, N. (2000) Differentiation of human embryonic stem cells into embryoid bodies compromising the three embryonic germ layers. Molecular Medicine, 6, 88-95. 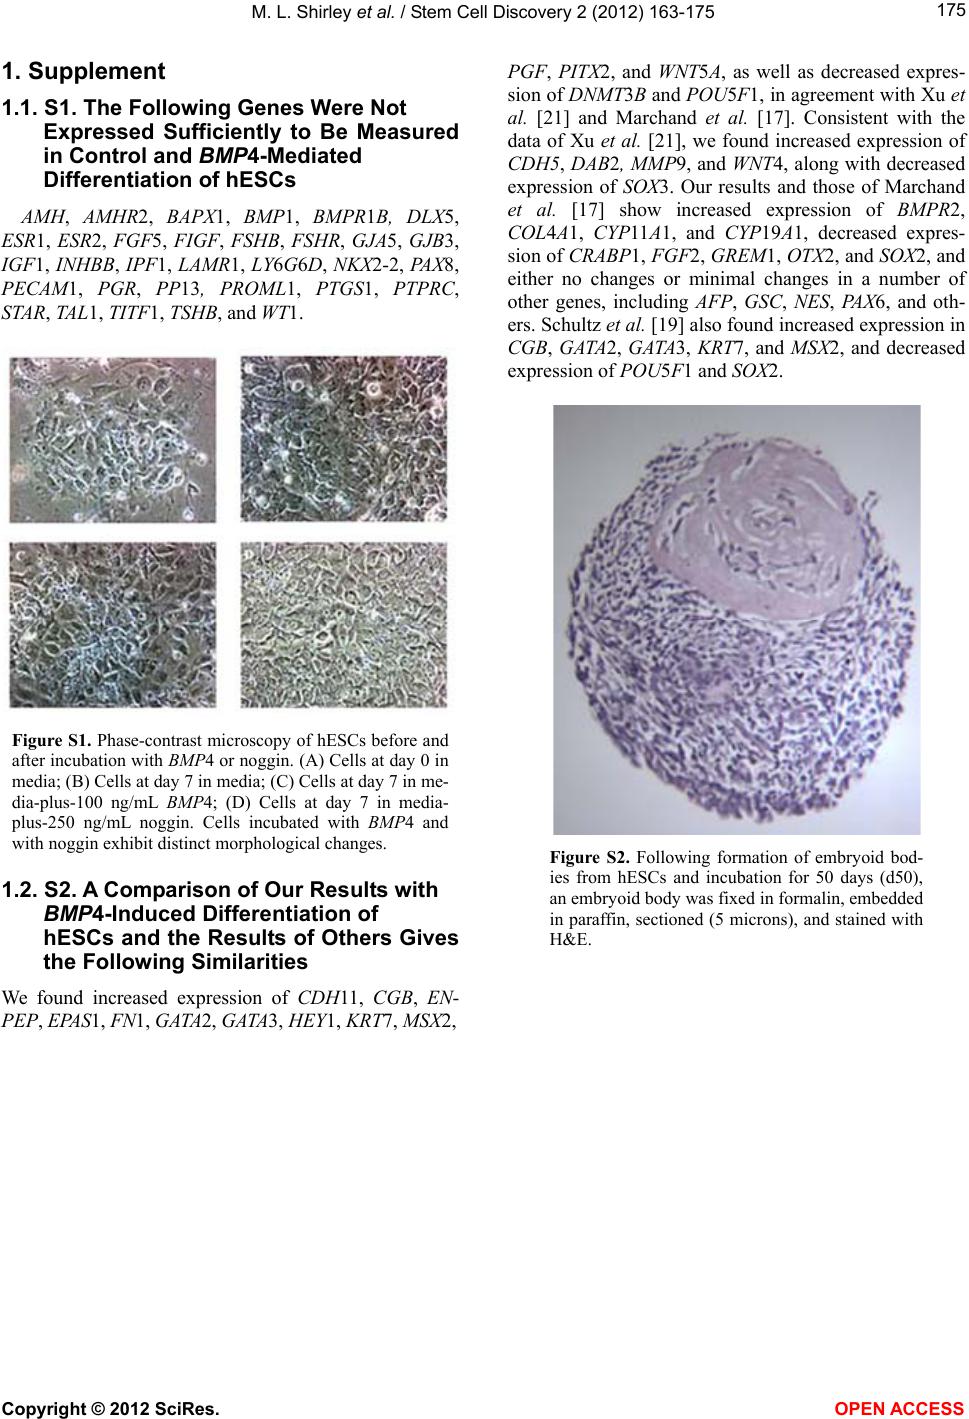 M. L. Shirley et al. / Stem Cell Discovery 2 (2012) 163-175 175 1. Supplement 1.1. S1. The Following Genes Were Not Expressed Sufficiently to Be Measured in Control and BMP4-Mediated Differentiation of hESCs AMH, AMHR2, BAPX1, BMP1, BMPR1B, DLX5, ESR1, ESR2, FGF5, FIGF, FSHB, FSHR, GJA5, GJB3, IGF1, INHBB, IPF1, LAMR1, LY6G6D, NKX2-2, PAX 8, PECAM1, PGR, PP13, PROML1, PTGS1, PTPRC, STAR, TAL1, TITF1, TSHB, and WT1. Figure S1. Phase-contrast microscopy of hESCs before and after incubation with BMP4 or noggin. (A) Cells at day 0 in media; (B) Cells at day 7 in media; (C) Cells at day 7 in me- dia-plus-100 ng/mL BMP4; (D) Cells at day 7 in media- plus-250 ng/mL noggin. Cells incubated with BMP4 and with noggin exhibit distinct morphological changes. 1.2. S2. A Comparison of Our Results with BMP4-Induced Differentiation of hESCs and the Results of Others Gives the Following Similarities We found increased expression of CDH11, CGB, EN- PEP, EPAS1, FN1, GATA2, GATA3, HEY1, KRT7, MSX2, PGF, PITX2, and WNT5A, as well as decreased expres- sion of DNMT3B and POU5F1, in agreement with Xu et al. [21] and Marchand et al. [17]. Consistent with the data of Xu et al. [21], we found increased expression of CDH5, DAB2, MMP9, and WNT4, along with decreased expression of SOX3. Our results and those of Marchand et al. [17] show increased expression of BMPR2, COL4A1, CYP11A1, and CYP19A1, decreased expres- sion of CRABP1, FGF2, GREM1, OTX2, and SOX2, and either no changes or minimal changes in a number of other genes, including AFP, GSC, NES, PA X6, and oth- ers. Schultz et al. [19] also found increased expression in CGB, GATA2, GATA3, KRT7, and MSX2, and decreased expression of POU5F1 and SOX2. Figure S2. Following formation of embryoid bod- ies from hESCs and incubation for 50 days (d50), an embryoid body was fixed in formalin, embedded in paraffin, sectioned (5 microns), and stained with H&E. Copyright © 2012 SciRes. OPEN ACCESS
|