Paper Menu >>
Journal Menu >>
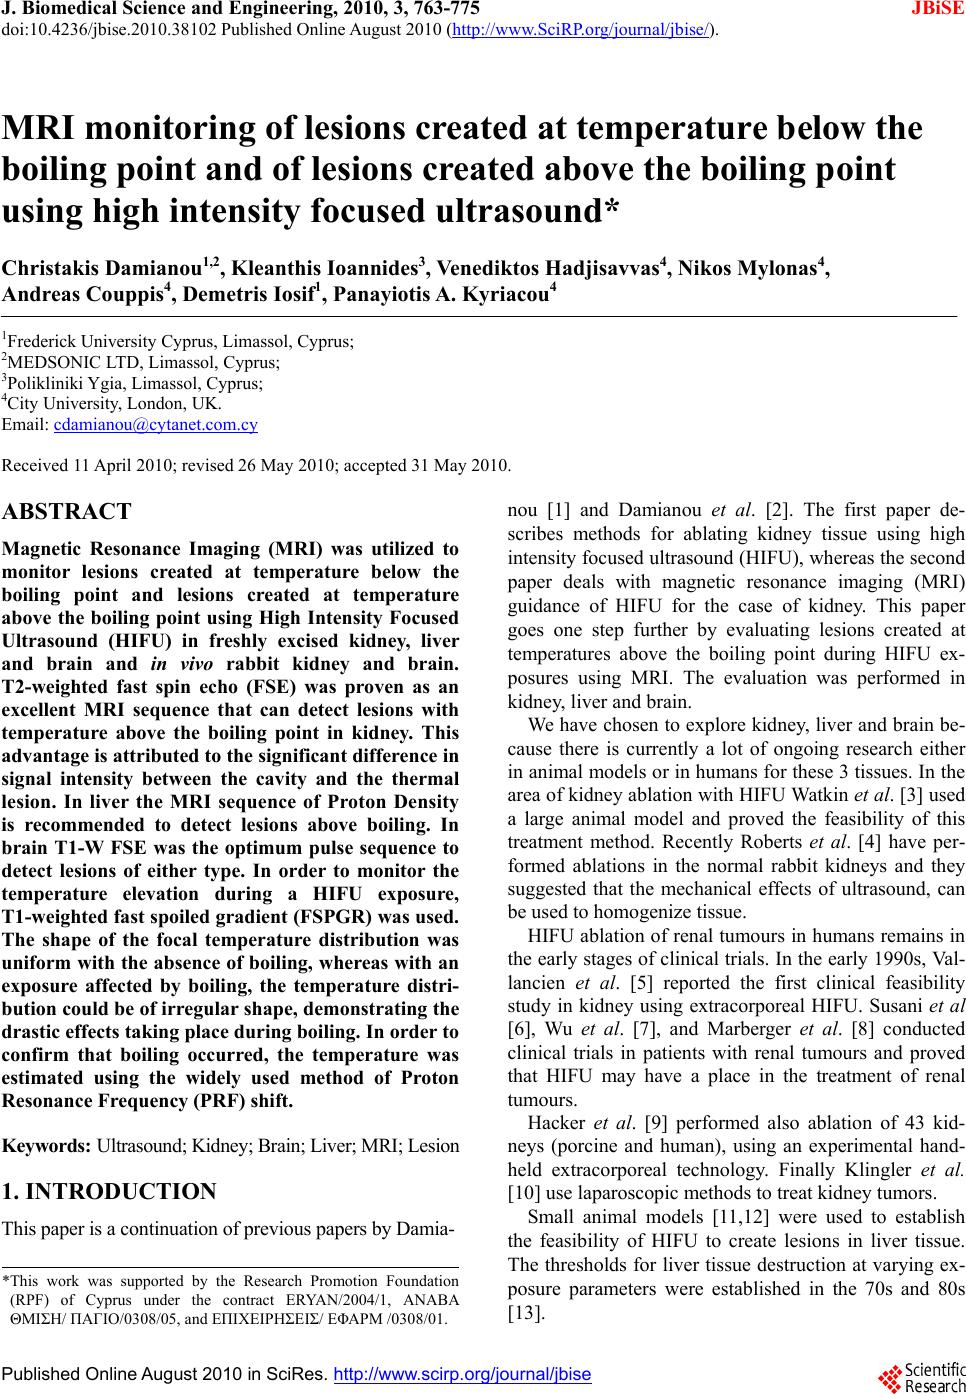 J. Biomedical Science and Engineering, 2010, 3, 763-775 JBiSE doi:10.4236/jbise.2010.38102 Published Online August 2010 (http://www.SciRP.org/journal/jbise/). Published Online August 2010 in SciRes. http:// www. scirp. org/journal/jbise MRI monitoring of lesions created at temperature below the boiling point and of lesions created above the boiling point using high intensity focused ultrasound* Christakis Damianou1,2, Kl eanthis Ioannides3, Ve ne diktos Hadjisavvas 4, Nikos Mylonas4, Andreas Couppis4, Demetris Iosif1, Panayiotis A. Kyriacou4 1Frederick University Cyprus, Limassol, Cyprus; 2MEDSONIC LTD, Limassol, Cyprus; 3Polikliniki Ygia, Limassol, Cyprus; 4City University, London, UK. Email: cdamianou@cytanet.com.cy Received 11 April 2010; revised 26 May 2010; accepted 31 May 2010. ABSTRACT Magnetic Resonance Imaging (MRI) was utilized to monitor lesions created at temperature below the boiling point and lesions created at temperature above the boiling point using High Intensity Focused Ultrasound (HIFU) in freshly excised kidney, liver and brain and in vivo rabbit kidney and brain. T2-weighted fast spin echo (FSE) was proven as an excellent MRI sequence that can detect lesions with temperature above the boiling point in kidney. This advantage is attributed to the significant difference in signal intensity between the cavity and the thermal lesion. In liver the MRI sequence of Proton Density is recommended to detect lesions above boiling. In brain T1-W FSE was the optimum pulse sequence to detect lesions of either type. In order to monitor the temperature elevation during a HIFU exposure, T1-weighted fast spoiled gradient (FSPGR) was used. The shape of the focal temperature distribution was uniform with the absence of boiling, whereas with an exposure affected by boiling, the temperature distri- bution could be of irregular shape, demonstrating the drastic effects taking place during boiling. In order to confirm that boiling occurred, the temperature was estimated using the widely used method of Proton Resonance Frequency (PRF) shift. Keywords: Ultrasound; Kidney; Brain; Liver; MRI; Lesion 1. INTRODUCTION This paper is a continuation of previous papers by Damia- nou [1] and Damianou et al. [2]. The first paper de- scribes methods for ablating kidney tissue using high intensity focused ultrasound (HIFU), whereas the second paper deals with magnetic resonance imaging (MRI) guidance of HIFU for the case of kidney. This paper goes one step further by evaluating lesions created at temperatures above the boiling point during HIFU ex- posures using MRI. The evaluation was performed in kidney, liver and brain. We have chosen to explore kidney, liver and brain be- cause there is currently a lot of ongoing research either in animal models or in humans for these 3 tissues. In the area of kidney ablation with HIFU Watkin et al. [3] used a large animal model and proved the feasibility of this treatment method. Recently Roberts et al. [4] have per- formed ablations in the normal rabbit kidneys and they suggested that the mechanical effects of ultrasound, can be used to homogenize tissue. HIFU ablation of renal tumours in humans remains in the early stages of clinical trials. In the early 1990s, Val- lancien et al. [5] reported the first clinical feasibility study in kidney using extracorporeal HIFU. Susani et al [6], Wu et al. [7], and Marberger et al. [8] conducted clinical trials in patients with renal tumours and proved that HIFU may have a place in the treatment of renal tumours. Hacker et al. [9] performed also ablation of 43 kid- neys (porcine and human), using an experimental hand- held extracorporeal technology. Finally Klingler et al. [10] use laparoscopic methods to treat kidney tumors. Small animal models [11,12] were used to establish the feasibility of HIFU to create lesions in liver tissue. The thresholds for liver tissue destruction at varying ex- posure parameters were established in the 70s and 80s [13]. *This work was supported by the Research Promotion Foundation (RPF) of Cyprus under the contract ERYAN/2004/1, ΑΝΑΒ Α ΘΜΙΣΗ/ ΠΑΓΙΟ/0308/05, and ΕΠΙΧΕΙΡΗΣΕΙΣ/ ΕΦΑΡΜ /0308/01. 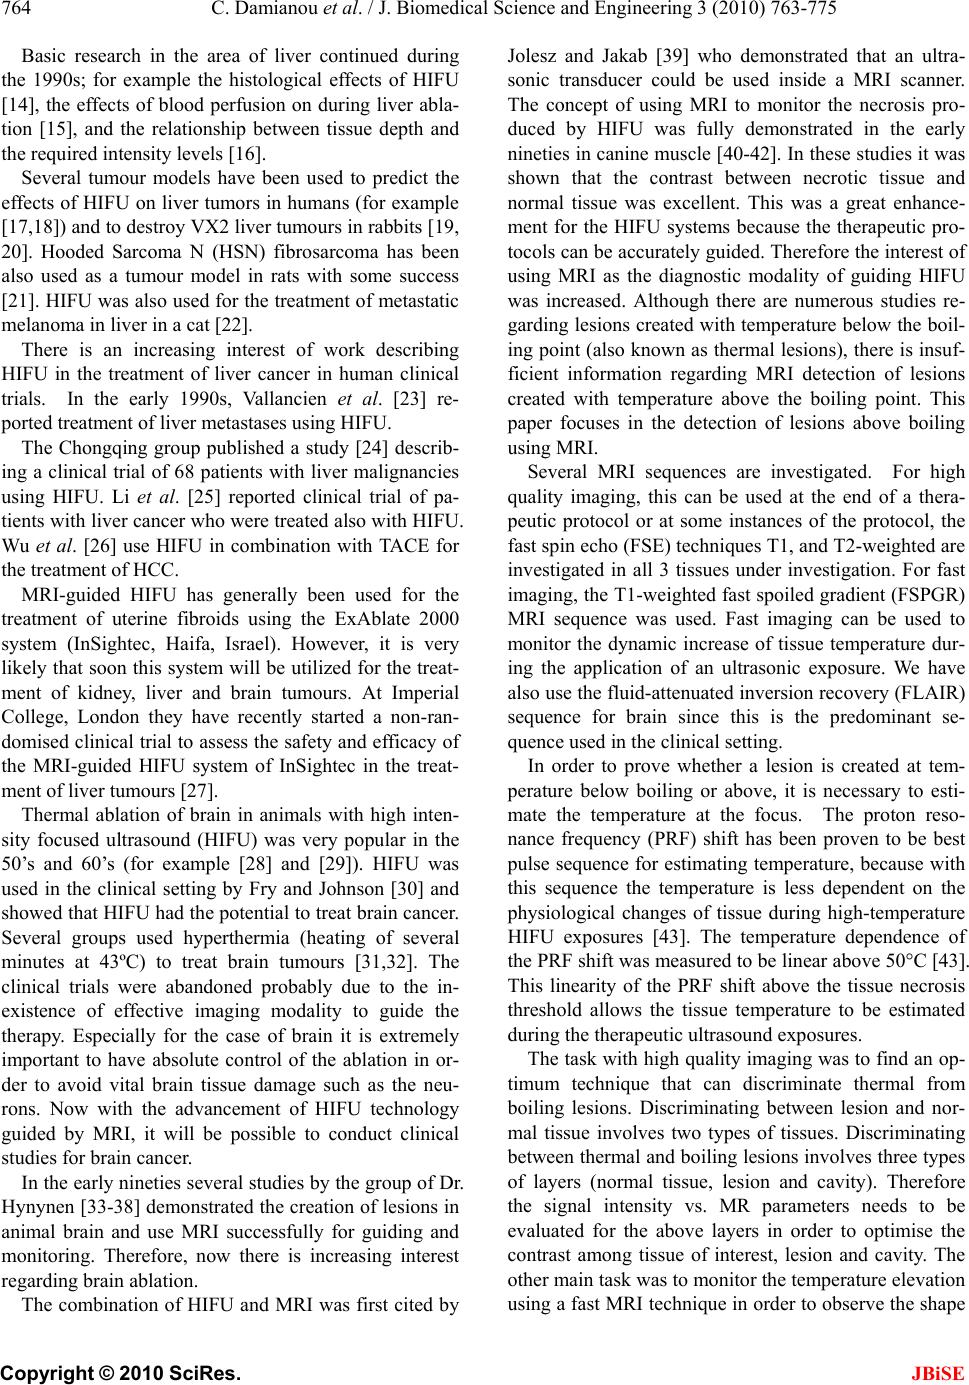 764 C. Damianou et al. / J. Biomedical Science and Engineering 3 (2010) 763-775 Copyright © 2010 SciRes. JBiSE Basic research in the area of liver continued during the 1990s; for example the histological effects of HIFU [14], the effects of blood perfusion on during liver abla- tion [15], and the relationship between tissue depth and the required intensity levels [16]. Several tumour models have been used to predict the effects of HIFU on liver tumors in humans (for example [17,18]) and to destroy VX2 liver tumours in rabbits [19, 20]. Hooded Sarcoma N (HSN) fibrosarcoma has been also used as a tumour model in rats with some success [21]. HIFU was also used for the treatment of metastatic melanoma in liver in a cat [22]. There is an increasing interest of work describing HIFU in the treatment of liver cancer in human clinical trials. In the early 1990s, Vallancien et al. [23] re- ported treatment of liver metastases using HIFU. The Chongqing group published a study [24] describ- ing a clinical trial of 68 patients with liver malignancies using HIFU. Li et al. [25] reported clinical trial of pa- tients with liver cancer who were treated also with HIFU. Wu et al. [26] use HIFU in combination with TACE for the treatment of HCC. MRI-guided HIFU has generally been used for the treatment of uterine fibroids using the ExAblate 2000 system (InSightec, Haifa, Israel). However, it is very likely that soon this system will be utilized for the treat- ment of kidney, liver and brain tumours. At Imperial College, London they have recently started a non-ran- domised clinical trial to assess the safety and efficacy of the MRI-guided HIFU system of InSightec in the treat- ment of liver tumours [27]. Thermal ablation of brain in animals with high inten- sity focused ultrasound (HIFU) was very popular in the 50’s and 60’s (for example [28] and [29]). HIFU was used in the clinical setting by Fry and Johnson [30] and showed that HIFU had the potential to treat brain cancer. Several groups used hyperthermia (heating of several minutes at 43ºC) to treat brain tumours [31,32]. The clinical trials were abandoned probably due to the in- existence of effective imaging modality to guide the therapy. Especially for the case of brain it is extremely important to have absolute control of the ablation in or- der to avoid vital brain tissue damage such as the neu- rons. Now with the advancement of HIFU technology guided by MRI, it will be possible to conduct clinical studies for brain cancer. In the early nineties several studies by the group of Dr. Hynynen [33-38] demonstrated the creation of lesions in animal brain and use MRI successfully for guiding and monitoring. Therefore, now there is increasing interest regarding brain ablation. The combination of HIFU and MRI was first cited by Jolesz and Jakab [39] who demonstrated that an ultra- sonic transducer could be used inside a MRI scanner. The concept of using MRI to monitor the necrosis pro- duced by HIFU was fully demonstrated in the early nineties in canine muscle [40-42]. In these studies it was shown that the contrast between necrotic tissue and normal tissue was excellent. This was a great enhance- ment for the HIFU systems because the therapeutic pro- tocols can be accurately guided. Therefore the interest of using MRI as the diagnostic modality of guiding HIFU was increased. Although there are numerous studies re- garding lesions created with temperature below the boil- ing point (also known as thermal lesions), there is insuf- ficient information regarding MRI detection of lesions created with temperature above the boiling point. This paper focuses in the detection of lesions above boiling using MRI. Several MRI sequences are investigated. For high quality imaging, this can be used at the end of a thera- peutic protocol or at some instances of the protocol, the fast spin echo (FSE) techniques T1, and T2-weighted are investigated in all 3 tissues under investigation. For fast imaging, the T1-weighted fast spoiled gradient (FSPGR) MRI sequence was used. Fast imaging can be used to monitor the dynamic increase of tissue temperature dur- ing the application of an ultrasonic exposure. We have also use the fluid-attenuated inversion recovery (FLAIR) sequence for brain since this is the predominant se- quence used in the clinical setting. In order to prove whether a lesion is created at tem- perature below boiling or above, it is necessary to esti- mate the temperature at the focus. The proton reso- nance frequency (PRF) shift has been proven to be best pulse sequence for estimating temperature, because with this sequence the temperature is less dependent on the physiological changes of tissue during high-temperature HIFU exposures [43]. The temperature dependence of the PRF shift was measured to be linear above 50°C [43]. This linearity of the PRF shift above the tissue necrosis threshold allows the tissue temperature to be estimated during the therapeutic ultrasound exposures. The task with high quality imaging was to find an op- timum technique that can discriminate thermal from boiling lesions. Discriminating between lesion and nor- mal tissue involves two types of tissues. Discriminating between thermal and boiling lesions involves three types of layers (normal tissue, lesion and cavity). Therefore the signal intensity vs. MR parameters needs to be evaluated for the above layers in order to optimise the contrast among tissue of interest, lesion and cavity. The other main task was to monitor the temperature elevation using a fast MRI technique in order to observe the shape  C. Damianou et al. / J. Biomedical Science and Engineering 3 (2010) 763-775 765 Copyright © 2010 SciRes. JBiSE of the beam during HIFU exposures. The growth of vapor bubbles due to boiling occurs due to the temperature induced by HIFU. Boiling is dif- ferent form cavitation which occurs due to pressure os- cillations induced by HIFU. Vapor bubbles created by boiling can grow rapidly to a size of few millimetres [44]. This growth can be explosive due to the super heating caused by HIFU. Therefore the cavities pro- duced of few mms can be easily monitored by MRI. There are two reasons for studying the MRI appear- ance of boiling lesions that could be of importance: 1) Since boiling provides enhanced heating, it could be possible for large tumours (for example giant fi- broadenomas) to use this type of heating (especially in the center of the tumor) in order to accelerate the abla- tion, 2) since the rabbit model is used extensively by many researchers in MRI animal experiments (for example [33-37]), then it is very useful for them to know the ap- pearance of boiling lesions. 2. MATERIALS AND METHODS 2.1. HIFU/MRI System Figure 1 shows the block diagram of the HIFU/MRI system which includes the following subsystems: 1) HIFU system, 2) MR imaging, 3) Positioning de- vice (robot) and associate drivers, 4) Temperature meas- urement, 5) Cavitation detection, 6) MRI compatible camera, 7) Software. 2.1.1. HIFU System The HIFU system consists of a signal generator (HP 33120A, Agilent technologies, Englewood, CO, USA), a RF amplifier (250 W, AR, Souderton, PA, USA), and a spherically shaped bowl transducer made from piezo- electric ceramic of low magnetic susceptibility (Etalon, Lebanon, IN, USA). The transducer used for the kidney and liver ablation operates with frequency of 4 MHz, and the transducer for brain ablation operates at 1 MHz. The transducer is rigidly mounted on the MRI-compati- ble positioning system (MEDSONIC LTD, Limassol, Cyprus) which is described shortly. 2.1.2. MRI Imaging The 3-d positioning device and the transducer were placed inside a MRI scanner (Signa 1.5 T, by General Electric, Fairfield, CT, USA). The spinal coil (USA in- struments, Cleveland, OH, USA) was used to acquire the MRI signal for the case of kidney and liver, whereas a brain coil (USA instruments, Cleveland, OH, USA) was used to acquire the MRI signal from the brain tissue. 2.1.3. Po sitioni n g De vice/Drivers The robot has been developed initially for three de- grees-of-freedom, but it can be easily developed for 5 degrees of motion. Since the positioning device is placed on the table of the MRI scanner its height should be around 55 cm (bore diameter of the MRI scanner). The length of the positioning device is 45 cm and its width 30 cm. The weight of the positioning device is only 6 kg and therefore it can be considered portable. Figure 2 shows the schematic the positioning device illustrating the 3 stages, transducer, and coupling method. The posi- tioning device operates by means of 3 piezoelectric mo- tors (USR60-S3N, Shinsei Kogyo Corp., Tokyo, Japan). More details of this positioning device can be found in [31]. The movement of the positioning device is moni- tored by an MRI compatible camera (not shown in the figure) which is placed on a non-magnetic holder. More- over, the positioning system includes optoelectronic en- coders for providing signals indicating the relative posi- tions of the movable elements in the positioning system. The resolution of all 3 axes of the positioning device is 0.1 mm. 2.1.4. MRI Compa tibl e Cam era In order to monitor the condition of the animal or humans Signal generator Figure 1. HIFU system under MRI guidance showing the vari- ous functionalities of the HIFU/MRI system. Figure 2. Schematic of the robot showing all of its stages.  766 C. Damianou et al. / J. Biomedical Science and Engineering 3 (2010) 763-775 Copyright © 2010 SciRes. JBiSE (future use), a MRI compatible camera (MRC Systems GmbH, Heidelberg, Germany) was mounted on the sys- tem. The camera was interfaced by means of a video card. With the aid of the MRI compatible camera, the researcher can monitor the welfare of the animal. 2.1.5. Temper ature Measu rement Temperature was measured in few experiments in order to confirm that the temperature estimated using the PRF method was accurate enough. Temperature is measured using a data acquisition system (HP 34970A, Agilent technologies, Englewood, CO, USA). Temperature is sensed using a 50-μm diameter T-type copper-costantan thermocouple (Physitemp Instruments, Inc. New Jersey, USA) which is MRI compatible. The thermocouple is placed in the tissue by means of a catheter. The thermo- couple measures the temperature at the focus. This is achieved by applying low-intensity (low enough not to cause tissue damage) and during the application of ul- trasound the transducer is scanned accordingly in order to detect the maximum temperature. This establishes positioning of the thermocouple in the focus of the transducer. The temperature error of the thermocouple is in the order of 0.1ºC. 2.1.6. C a vitation Detector From a scientific point of view it will be useful to sepa- rate lesions developed based on thermal and based on cavitation mechanisms. In this system we use a passive MRI compatible cavitation detector (Etalon, Lebanon, IN, USA), which is placed perpendicularly to the beam of the HIFU transducer (method described in [45]). Since the HIFU protocol is applied inside the magnet of an MRI scanner, the detector must be MRI compatible. The diameter of the detector was 1 cm, its radius of cur- vature was 10 cm and operated between 1 and 13 MHz (centre frequency is 7 MHz). The detector was me- chanically coupled to the HIFU transducer. The voltage from the detector was fed to an analogue to digital (A/D) card (CS1250, A/D 12 bit, 50 MHz, from GAGE, La- chine, Canada). The A/D card was synchronised to re- ceive the signal when the HIFU transducer was activated. The received signal was stored in a PC (Dell Inc. Round Rock, Texas, USA). The signal was then displayed using EXCEL (Microsoft Corporation, Redmond, WA USA) in order to visualize whether cavitation occurs or not. 2.1.7. So ft ware A user-friendly program written in MATLAB (The Mathworks Inc., Natick, MA) has been developed in order to control the system. The software serves the fol- lowing main tasks: 1) Displaying of MR images, 2) transducer movement (the user may move the robotic arm in a specific direction or customize the automatic movement of the robotic arm in any rectangular forma- tion by specifying the pattern, the step and the number of steps), 3) messaging (starting time, treatment time left etc), 4) Patient data (age, weight, etc), 5) Display of mo- tor position, and 6) Display of the contents of an MR compatible camera, 7) Cavitation detection window, 8) temperature measurement, and 9) MR estimated tem- perature using the PRF method. 2.2. In Vitro Expe riments The tissue was placed on top of an absorbing material in order to shield adjacent tissue form stray radiation from the bottom. The transducer was placed on the arm of the positioning device and was immersed in the water tank, thus providing good acoustical coupling between tissue and transducer. Any bubbles that may have collected under the face of the transducer face were removed in order to eliminate any reflections. In all experiments the tissues used (kidney, liver and brain) were extracted from freshly killed lamb, and the experiment was con- ducted in the same day. Totally 22 kidneys, 8 liver and 16 brains were ablated for investigating various issues. 2.3. In Vivo Experim ents For the in vivo experiments, adult rabbits from Cyprus were used weighting approximately 3.5-4 kg. Totally 8 rabbits were used in the experiments. The rabbits were anaesthetized using a mixture of 500 mg of ketamine (100 mg/mL, Aveco, Ford Dodge, IA), 160 mg of xy- lazine (20 mg/mL, Loyd Laboratories, Shenandoah, IA), and 20 mg of acepromazine (10 mg/mL, Aveco, Ford Dodge, IA) at a dose of 1 mL/kg. Presence of the skull in the ultrasonic path not only distorts the field by reflection, but may also destroys the underlying tissue in contact with it by absorbing ultra- sonic energy and dissipating it as heat. A craniotomy adequate in extent to permit unimpeded passage of the cone of sound was imperative. The extent of the crani- otomy depends on the solid angle of radiation and the depth of the target from the cranial surface. The larger the angle and the deeper the target, the larger the size of craniotomy needed. For the transducer used and a target depth of 1 cm, a circular craniotomy of 3 cm in diameter was adequate. The animal experiments protocol was approved by the national body in Cyprus responsible for animal studies (Ministry of Agriculture, Animal Ser- vices). 2.4. HIFU Parameters The in situ spatial average intensity was estimated based on the applied power and the half-power width of the beam of the transducer. The details of the intensity esti- mation can be found in Damianou 2003 [1]. In order to create large lesions, a grid pattern of 3 × 3 or 4 × 4 over-  C. Damianou et al. / J. Biomedical Science and Engineering 3 (2010) 763-775 767 Copyright © 2010 SciRes. JBiSE lapping lesions was used. The spacing between succes- sive transducer movements was 2 mm, which creates overlapping lesions for the intensity and pulse duration used. In all the exposure, unless stated otherwise the ultrasound was turn on for 5 s. The delay between suc- cessive ultrasound firings was 10 s for the scanned abla- tion. The intensity indicated through this paper is in situ spatial average intensity. 2.5. MRI Parameters The various MRI parameters used for the various pulse sequences are listed in Tabl e 1. The Region of Interest (ROI) was circular with diameter of nearly 2 mm. The temperature change (T) has been estimated using the equation stated in Chung et al. 1996 [46] which is as follows: 0B TTE (1) where is the temperature-dependent phase shift which is the phase acquired before and during tempera- ture elevation and which accumulates during the echo time TE using the gradient-echo pulse sequence FSPGR. The other terms are which is the gyromagnetic ratio of proton, 42.58 MHz/T, is the average proton resonance frequency coefficient and B0 is the flux density of the static magnetic field. The measured temperature eleva- tion can be added to the base-line temperature to obtain the absolute temperature. The average temperature coef- ficient for the frequency shift was taken from the study of Vykhodtseva et al. [47]. 3. RESULTS Figure 3 shows an MRI image of 4 lesions in vitro kid- ney (plane perpendicular to the beam) resulting from intensities ranging from 1000 to 2500 W/cm2 using T1-weighted FSE (Figure 3(a)), T2-weighted FSE (Fig- ure 3(b)) and T1-weigthed FSPGR (Figure 3(c)) with pulse duration of 5 s. The MRI parameters used are shown in Ta b l e 1 (row 1, 2 and 4). The MRI estimated maximum temperature at the focus was 55ºC for the intensity of 1000 W/cm2, 83ºC for 1500 W/cm2, 105ºC for 2000 W/cm2 and 123ºC for 2500 W/cm2. The temperature measured using the thermocouple for the 1000 W/cm2 was 53ºC, which is very close to the tem- perature estimated using the PRF method. Note that with T2-weighted FSE (Figure 3(b)) white spots (cavity) within the dark thermal lesion are seen for intensities higher than 2000 W/cm2. T1-W FSE and FSPGR show some indication of these cavities, but the resolution is weaker than T2-w FSE. Figure 4 shows MRI images (in a plane parallel to the transducer beam) of 3 lesions in kidney in vitro at inten- sities of 1000, 2000 and 3000 W/cm2. Again T2- weighted FSE shows cavities (due to boiling) within the thermal lesion. T1-W FSE and T1-W FSPGR fail to pro- vide good resolution in this axis. Having observed that T2-W FSE was probably a suc- cessful MRI sequence to detect boiling lesions, this pulse sequence was investigated further by evaluating the Contrast to Noise Ratio (CNR) vs. Echo Time (TE). Figure 5 shows the plot of CNR vs. TE for kidney tissue, lesion and cavity of the lesion of Figure 4(b) (intensity of 3000 W/cm2) demonstrating that good contrast be- tween lesion and cavity is achieved using T2-weighted FSE between 20 and 50 ms. Figure 6 shows a T2-weighted FSE image of 3 lesions in rabbit kidney in vivo using different intensities (1000, 2000 and 2500 W/cm2) for a 5 s pulse. The estimated temperature was 52ºC, 95ºC and 115ºC. The lesion created using 2500 W/cm2 appears to have a white spot (cavity). These temperatures are lower than the corresponding temperatures in vitro (Figure 4) for the same intensity due to the removal of heat due to blood flow or possibly due to reflection from various interfaces. Figure 7(a) shows an MR image of a lesion acquired using T1-weighted FSPGR (for MRI parameters see Table 1, row 4). Figure 7(b) shows the photograph of the kidney showing cavity within the large thermal lesion. Note that this large lesion was created using a matrix of 4 × 4 single lesions with intensity of 1500 W/cm2. Out of these 16 lesions, one lesion was created possibly due to the mechanism of cavitation, which results to tissue evaporation or boiling. The estimated temperature during Table 1. Parameters used for the various MRI pulse sequences. Series NAME TR (ms) TE (ms) Slice thickness (mm) Matrix FOV (cm) NEX BW (KHz) ETL Other 1 T1-weighted FSE 500 9.2 3, (gap 0.3 mm) 256 × 25616 1 31.25 8 - 2 T2-weighted FSE 2500 8,16,32,48,64,80 3, (gap 0.3 mm) 256 × 25616 1 31.25 8 - 3 PD 2500 7.2 3, (gap 0.3 mm) 256 × 25616 1 31.25 8 - 4 FSPGR T1-weighted 50 2.7 3, (gap 0.3 mm) 256 × 25616 1 62.50 - Flip angle 50 5 FLAIR 8000 80 3, (gap 0.3 mm) 256 × 25616 1 6.9 8 Inversion Time 1200-2200  768 C. Damianou et al. / J. Biomedical Science and Engineering 3 (2010) 763-775 Copyright © 2010 SciRes. JBiSE (a) (b) (c) Figure 3. MR images (in a plane perpendicular to the beam) of four lesions (intensities 1000, 1500, 2000 and 2500 W/cm2) in kidney in vitro using. (a) T1-weighted FSE; (b) T2-weighted FSE; (c) T1-weighted FSPGR. With intensities above 2000 W/cm2 the lesions exhibit boiling activity. The discrimination between boiling and non-boiling lesion is best monitored using T2-W FSE. (a) (b) (c) Figure 4. MR images (in a plane parallel to the beam) of 3 lesions in kidney in vitro using. (a) T1-weighted FSE; (b) T2-weighted FSE; (c) T1-weighted FSPGR. With intensities above 2000 W/cm2 the lesions exhibit boiling activity. The dis- crimination between boiling and thermal lesion is best moni- tored using T2-W FSE. Figure 5. CNR vs. TE for the lesion, kidney and cavity for the lesion of Figure 8(b) with intensity of 3000 W/cm2. Figure 6. MRI image using T2-weighted FSE of 3 lesions in rabbit kidney in vivo at different intensities (1000, 2000, and 2500 W/cm2) for a 5 s pulse. The lesion with intensity of 2500 W/cm2 is affected by tissue boiling. the creation of this lesion was 120ºC, whereas the tem- perature for the rest of the lesions (non-boiling) varied from 80 to 85ºC. This bubbly lesion exhibits low-signal lesion (dark spot) and lies inside the large lesion (white spot within the kidney tissue). At the location of the boiling lesion, the passive cavitation detector confirmed the occurrence of cavitation since broadband emission was detected (see Figure 7(c) which shows the frequency spectrum of the HIFU transducer). Although with this intensity bubbly lesions should not be produced, the high temperature estimated for this one lesion, should be attributed to cavitation. Cavitation was possibly initiated by bubbles that are trapped in the in vitro tissue due to the absence of blood in the vasculature. Figure 8 demonstrates the temperature increase in vi- tro kidney using HIFU and MRI monitoring. The MRI images were acquired using the dynamic sequence T1- weighted FSPGR. Each image was acquired in 5 s. In Figure 8(a) ultrasound was OFF. In the next 5 images 0.00 5.00 10.00 15.00 20.00 25.00 30.00 020406080100120 140160 TE (ms) CN R Lesion Cavity  C. Damianou et al. / J. Biomedical Science and Engineering 3 (2010) 763-775 769 Copyright © 2010 SciRes. JBiSE (a) (b) 0 20 40 60 80 012345678910111213 Frequency (MHz) Spectral Power (mW ) (c) Figure 7. (a) MR image (in a plane perpendicular to the beam) of large lesion in kidney in vitro using T1-weighted FSPGR (TR = 50 ms), showing one cavitation lesion; (b) Photograph of the kidney showing the cavitation lesion within the large thermal lesion; (c) Frequency spectrum of the HIFU transducer exhibiting cavitation activity. the applied spatial average intensity was 1000 W/cm2 (for 25 s), and in the last 2 images ultrasound is turned OFF. Due to the heating a dark spot is observed (see arrows). The estimated maximum temperature was 55ºC. Figure 9 shows the corresponding temperature in- crease using T1-weighted FSPGR influenced by boiling. In Figure 9(a) ultrasound was OFF. In the next 5 images the applied spatial average intensity was 3500 W/cm2 (for 25 s). Note that compared to Figure 7 where the focal beam is circular, the focal beam in this figure is distorted, which is attributed to the occurrence of boiling confirmed also by the temperature of 112ºC measured. Figure 10 shows MRI image of lesion in liver. The image was acquired using Proton density. The lesion was created using low intensity (1000 W/cm2) for long time (30 s). These ultrasonic parameters produce temperature elevation which is above the boiling point (120ºC). Thus, the evaporation of tissue causes a cavity that follows the shape of the beam. Figure 11 shows the MRI image a large lesion in lamb brain in vitro created by scanning the transducer with a 4 × 4 grid using 2000 W/cm2 using T1-w FSE resulting to a large bubbly lesion. The maximum esti- mated temperature for this lesion was 110ºC. Note that in some location no lesion was created due to poor ul- trasound penetration due to the air bubbles possibly trapped in the blood vessels. This image shows once more the excellent contrast between normal brain and lesions (in this case boiling lesions). Figure 12 shows ablation in rabbit in vivo using a 4 × 4 grid with intensity of 2000 W/cm2 for 20 s. This large lesion was created using thermal mechanisms and there- fore the lesion appears bright. The maximum estimated temperature for this exposure was 90ºC. The contrast of thermal lesions is definitely much better than the case of boiling lesions. Unlike the in vitro case of Figure 11 where with this level of intensity boiling lesions were created, in this in vivo example in none of the 16 lesions a boiling lesion was produced. This proves that in vitro brain includes bubbles which are responsible for pro- ducing boiling lesions possibly due to enhanced heating or cavitation. Both of these mechanisms possibly pro- duced temperatures above boiling and therefore bubbly lesions were created. The methodology applied for kidney which evaluates T1-W FSE, T2-W FSE and FSPGR (Figures 3 and 5) was also applied for liver. In brain in addition to these 3 pulse sequences, FLAIR was also evaluated because this MRI sequence is widely used clinically for the case of brain. It was found that for liver the best pulse sequence to evaluate boiling lesions was T2-w FSE with minimum TE (i.e. proton density). For brain T1-W FSE was the best pulse sequence to monitor both boiling and non-boiling lesions. Table 2 summarizes the recommended MRI sequence according to our experience for monitoring boiling lesions. 4. DISCUSSION So far it was concluded by several studies (for example Quesson et al. [48], Salomir et al. [49], McDannold et al. [50]) that MRI-guidance of HIFU serves mainly 4 pur- poses: 1) localisation of the focus, 2) imaging of the temperature elevation, 3) imaging at the end of the treatment protocol, in order to evaluate the necrosis and Table 2. Recommended pulse sequences for discriminating between (a) normal and thermal lesions; and (b) normal tissue, lesions created with temperature below boiling and lesions cre- ated with temperature above boiling. Tissue type Contrast between lesion below boiling and tissue Contrast between lesion below boiling, tissue, and lesion above boiling Kidney T1-W FSE, T2-W FSE T2-W FSE Liver T1-W FSE, T2-W FSE T2-W FSE Brain T1-W FSE T1-W FSE  770 C. Damianou et al. / J. Biomedical Science and Engineering 3 (2010) 763-775 Copyright © 2010 SciRes. JBiSE Figure 8. Temperature evolution in vitro kidney using T1- weighted FSPGR (thermal mechanism). Each image was acquired in 5 s. (a) Ultrasound is OFF; (b)-(f) Applied spatial average intensity: 1000 W/cm2 (for 25 s); (g)-(h) Ultrasound is OFF. 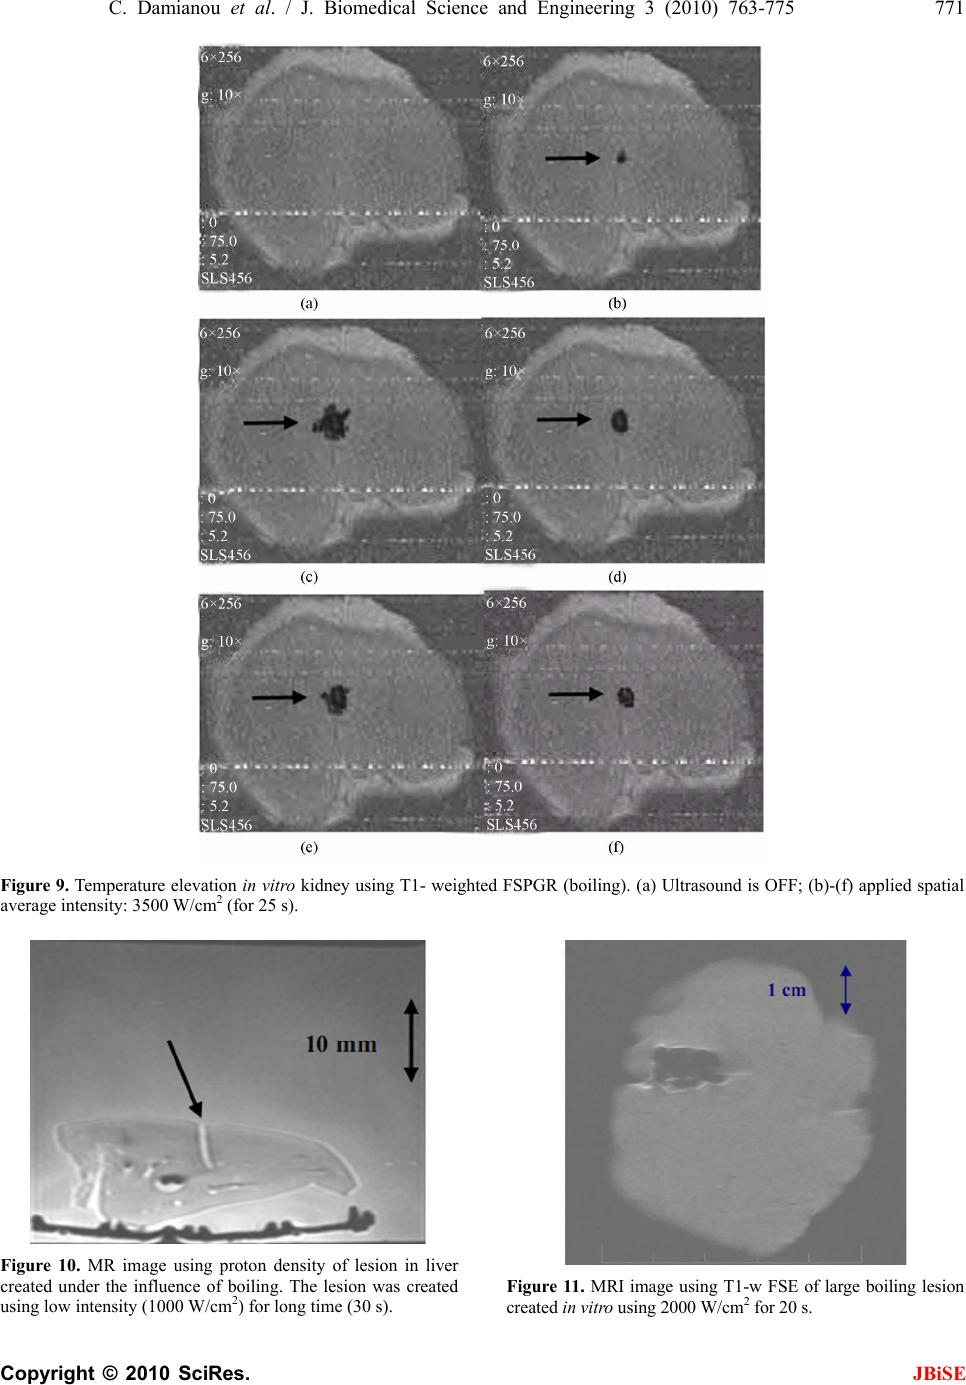 C. Damianou et al. / J. Biomedical Science and Engineering 3 (2010) 763-775 771 Copyright © 2010 SciRes. JBiSE Figure 9. Temperature elevation in vitro kidney using T1- weighted FSPGR (boiling). (a) Ultrasound is OFF; (b)-(f) applied spatial average intensity: 3500 W/cm2 (for 25 s). Figure 10. MR image using proton density of lesion in liver created under the influence of boiling. The lesion was created using low intensity (1000 W/cm2) for long time (30 s). Figure 11. MRI image using T1-w FSE of large boiling lesion created in vitro using 2000 W/cm2 for 20 s.  772 C. Damianou et al. / J. Biomedical Science and Engineering 3 (2010) 763-775 Copyright © 2010 SciRes. JBiSE Figure 12. MRI image using T1-w FSE of large thermal lesion created in vivo using 2000 W/cm2 for 20 s. possibly re-planning the treatment protocol in the event of incomplete coverage of the target and 4) follow-up imaging, evaluating the effectiveness of HIFU ablation, several days after the treatment. The main goal in this paper was to develop methods for detecting lesions cre- ated at temperature below boiling point and lesions cre- ated above boiling using MRI techniques. This paper enhances the role of MRI guidance in HIFU because it provides techniques to discriminate between non-boiling and boiling lesions. In kidney the best MRI sequence to detect boiling le- sions was T2-W FSE. T2-W FSE was evaluated further by plotting the CNR vs. TE for the three regions of interest (kidney, lesion and cavity). It was concluded that be- tween TE’s of 20 and 50 ms, the signal difference, and hence the contrast between the three regions of interest (kidney, lesion and cavity) is maximum (Figure 5). Ac- cording to Figure 5, the cavity, which appears inside the lesion, has stronger signal and decays slower. T1-weighted FSE and T1-weighted FSPGR do not consistently show boiling lesions in kidney, and even when cavities are visible the contrast is not very good. In liver T2-W FSE with low TE (i.e. Proton density) is recommended as an MRI sequence to detect non-boiling lesions and boiling lesions. Previous literature [36,37] demonstrated that lesions in the brain can be monitored with excellent contrast using T1-W FSE. However in the previous studies only thermal lesions were shown. In this paper we have ex- plored extensively the use of MRI to image both lesions created under thermal mechanisms and under boiling. With T1-w FSE the signal intensity of the brain tissue is homogeneous and therefore the contrast with thermal lesions or with bubbly lesions is excellent. In this study it was concluded that in brain T1-weighted FSE was the optimum MRI sequence not only to detect non-boiling lesions, but also boiling lesions. It was observed that bubbly lesions appear darker than thermal lesions. Bubbly lesions appear dark, due to the air spaces resulting from cavities caused by boiling or sometimes by cavitation. In the brain tissue in vitro it was demonstrated that non-degassed excised tissue is a good model for easily initiating enhanced heating or cavitation since air is trapped in the vasculature of the brain. This model of cavitation might not be of any sig- nificant for clinical use since in live tissue cavitation will not occur with such exposure; however, this model of initiating cavitation is very useful for the purpose of studying the MRI appearance of bubbly lesions. The exposure of using 2000 W/cm2 in brain results to tem- peratures of around 90ºC (Figure 12) in vivo. However with the same exposure in vitro the resulting estimated maximum temperature was 110ºC. This is probably due to enhanced heating or cavitation which results to tissue boiling. The enhanced heating due to bubbles was also noted in the studies by Fry et al. [51], by ter Haar [52], and by Chavier et al. [53]. This is the first paper demonstrating creation of large lesions in brain formed by scanning the transducer in grid formation. Both thermal and bubbly lesions were monitored successfully using T1-w FSE with excellent contrast, proving the potential of HIFU to treat reliably tumours in the brain in the future. The proposed system effectively creates large lesion in brain and on the same time these lesions are effectively monitored using MRI with strong confidence on the margins of these lesions especially using T1-w FSE. Boiling bubbles scatter and reflect ultrasound. These reflections result in shielding the HIFU focus and thus increased prefocal heating is observed. Therefore boiling bubbles, similar to cavitation bubbles, result to distortion of the lesion from a cigar shape into a tadpole shape (Figure 4). In addition to this the growth of the lesion is shifted towards the transducer. This phenomenon which is attributed to bubbles, either due to ultrasound-induced cavitation or to boiling has been observed also in the study by ter Haar [53], and by Chavier et al. [52]. For the scanned lesions the focus is not shifted towards the transducer, because while boiling begins in a very short time in both single and scanned lesions, it cannot distort the lesion for scanned exposures because the focus of the transducer moves away from the boiling site. This speculation is also supported in the paper by Khokhlova [44].  C. Damianou et al. / J. Biomedical Science and Engineering 3 (2010) 763-775 773 Copyright © 2010 SciRes. JBiSE This paper also showed by means of MRI images that focal beam is distorted during the occurrence of boiling. Initially low intensity was used (1000 W/cm2) and the temperature elevation was monitored using T1-weigthed FSPGR. The shortest acquisition time that we could achieve with our system was 5 s. Modifying any MRI parameter to decrease the time resulted to poor contrast or low signal to noise ratio (SNR). If we had achieved faster acquisitions (less than 5 s), then it would have possible to see more drastic changes. A decrease in the signal (black spot) demonstrated the increase in the temperature (also observed by Hynynen at al [54]). The shape of the black spot was circular. The black spot in- creased gradually with increased temperature, and the shape remains circular at all times (Figure 8). When the intensity was increased to 3500 W/cm2, the shape of the black spot was irregular indicating that boiling occurred (Figure 9). REFERENCES [1] Damianou, C. (2003) In vitro and in vivo ablation of porcine renal tissues using high intensity focused ultra- sound. Ultrasound in Medicine & Biology, 29(9), 1321- 1330. [2] Damianou, C., Pavlou, M., Velev, O., Kyriakou, K. and Trimikliniotis, M. (2004) High intensity focused ultra- sound ablation of kidney guided by ΜRI. Ultrasound in Medicine & Biology, 30(3), 397-404. [3] Watkin, N.A., Morris, S.B., Rivens, I.H. and Ter Haar, G.R. (1997) Highintensity focused ultrasound ablation of the kidney in a large animal model. Journal of En- dourology, 11(3 ), 191-196. [4] Roberts, W.W., Hall, T.L., Ives, K., Wolf, J.S., Jr., Fowlkes, J.B. and Cain, C.A. (2006) Pulsed cavitational ultrasound: A noninvasive technology for controlled tissue ablation (histotripsy) in the rabbit kidney. Journal of Urology, 175(2), 734-738. [5] Vallancien, G., Chartier-Kastler, E., Harouni, M., Chopin, D. and Bougaran, J. (1993) Focused extracorporeal py- rotherapy: Experimental study and feasibility in man. Seminars in Urology, 11(1 ), 7-9. [6] Susani, M., Madersbacher, S., Kratzik, C., Vingers, L. and Marberger, M. (1993) Morphology of tissue destruction induced by focused ultrasound. European Urology, 23(1), 34-38. [7] Wu, F., Wang, Z.B., Chen, W.Z., Bai, J., Zhu, H. and Qiao, T.Y. (2003) Preliminary experience using high in- tensity focused ultrasound for the treatment of patients with advanced stage renal malignancy. Journal of Urol- ogy, 170(6), 2237-2240. [8] Marberger, M., Schatzl, G., Cranston, D. and Kennedy, J.E. (2005) Extracorporeal ablation of renal tumours with high-intensity focused ultrasound. British Journal of Urology International, 95(2), 52-55. [9] Hacker, A., Michel, M.S., Marlinghaus, E., Kohrmann, K.U. and Alken, P. (2006) Extracorporeally induced ab- lation of renal tissue by high-intensity focused ultrasound. British Journal of Urology International, 97(4), 779-785. [10] Klingler, C., Susani, M., Seip, R., Mauermann, J., Sanghvi, N. and Marberger, M. (2008) A novel approach to energy ablative therapy of small renal tumours: Laparoscopic high-intensity focused ultrasound. European Urology, 53(4), 810-818. [11] Taylor, K.J. and Connolly, C.C. (1969) Differing hepatic lesions caused by the same dose of ultrasound. Journal of Pathology, 98(4), 291-293. [12] Linke, C.A., Carstensen, E.L., Frizzell, L.A., Elbadawi, A. and Fridd, C.W. (1973) Localized tissue destruction by high-intensity focused ultrasound. Archives of Surgery, 107(6), 887-891. [13] Frizzell, L.A. (1988) Threshold dosages for damage to mammalian liver by high intensity focused ultrasound. IEEE Transactions on Ultrasonics, Ferroelectrics and Frequency Control, 35(5), 578-581. [14] Ter Haar, G. and Robertson, D. (1993) Tissue destruction with focused ultrasound in vivo. European Urology, 23(1), 8-11. [15] Chen, L., Ter Haar, G., Hill, C.R., Dworkin, M., Carno- chan, P., Young, H. and Bensted, J.P. (1993) Effect of blood perfusion on the ablation of liver parenchyma with high-intensity focused ultrasound. Physics in Medicine and Biology, 38(11), 1661-1673. [16] Sibille, A., Prat, F., Chapelon, J.Y., Abou el Fadil, F., Henry, L., Theillere, Y., Ponchon, T. and Cathignol, D. (1993) Extracorporeal ablation of liver tissue by high- intensity focused ultrasound. Oncology, 50(2), 375-379. [17] Moore, W.E., Lopez, R.-M., Mathews, D.E., Sheets, P.W., Etchison, M.R., Hurwitz, A.S., Chalian, A.A., Fry, F.J., Vane, D.W. and Grosfeld, J.L. (1989) Evaluation of high- intensity therapeutic ultrasound irradiation in the treat- ment of experimental hepatoma. Journal of Pediatric Surgery, 24(1), 30-33. [18] Yang, R., Reilly, C.R., Rescorla, F.J., Faught, P.R., Sanghvi, N.T., Fry, F.J., Franklin, T.D., Jr., Lumeng, L. and Gros- feld, J.L. (1991) Highintensity focused ultrasound in the treatment of experimental liver cancer. Archives of Sur- gery, 126(8), 1002-1010. [19] Sibille, A., Prat, F., Chapelon, J.Y., Abou el Fadil, F., Henry, L., Theilliere, Y., Ponchon, T. and Cathignol, D. (1993) Characterization of extracorporeal ablation of normal and tumor-bearing liver tissue by high intensity focused ultrasound. Ultrasound in Medicine & Biology, 19(9), 803-813. [20] Prat, F., Centarti, M., Sibille, A., Abou el Fadil, F.A., Henry, L., Chapelon, J.Y. and Cathignol, D. (1995) Ex- tracorporeal high-intensity focused ultrasound for VX2 liver tumors in the rabbit. Hepatology, 21(3), 832-836. [21] Ter Haar, G., Rivens, I., Chen, L. and Riddler, S. (1991) High intensity focused ultrasound for the treatment of rat tumours. Physics in Medicine and Biology, 36(11), 1495- 1501. [22] Ter Haar, G., Clarke, R.L., Vaughan, M.G. and Hill, C.R. (1991) Trackless surgery using focused ultrasound: Tech- nique and case report. Minimally Invasive Therapy and Allied Tech nolo gies , 1(1), 13-19. [23] Vallancien, G., Harouni, M., Veillon, B., Mombet, A., Pra- potnich, D., Brisset, J.M. and Bougaran, J. (1992) Fo- cused extracorporeal pyrotherapy: Feasibility study in man. Journal of Endourology, 6, 173-181.  774 C. Damianou et al. / J. Biomedical Science and Engineering 3 (2010) 763-775 Copyright © 2010 SciRes. JBiSE [24] Wu, F., Chen, W. and Bai, J. (1999) Effect of high-inten- sity focused ultrasound on patients with hepatocellular cancer–preliminary report. Chines e Journal of Ult rasonog, 8, 213-216. [25] Li, C.X., Xu, G.L., Jiang, Z.Y., Li, J.J., Luo, G.Y., Shan, H.B., Zhang, R. and Li, Y. (2004) Analysis of clinical ef- fect of high-intensity focused ultrasound on liver cancer. World Journal of Gastroenterology, 10(15), 2201-2204. [26] Wu, F., Wang, Z.B., Chen, W.Z., Zou, J.Z., Bai, J., Zhu, H., Li, K.Q., Jin, C.B., Xie, F.L. and Su, H.B. (2005) Advanced hepatocellular carcinoma: Treatment with high- intensity focused ultrasound ablation combined with transcatheter arterial embolization. Radiology, 235(5), 659- 667. [27] Gedroyc, W.M. (2006) Magnetic resonance guided fo- cused ultrasound (MRgFUS) treatment of liver tumours. In: Coussios, C.C., Ed., 6th International Symposium on Therapeutic Ultrasound, Oxford, 30 August-2 September 2006, 539-547. [28] Fry, W., Mosberg, W., Barnard, J. and Fry, F. (1954) Pro- duction of focal destructive lesions in the central nervous system with ultrasound. Journal of Neurosurgery, 11(2 ), 471-478. [29] Lele, P.P. (1962) A simple method for production of trackless focal lesions with focused ultrasound. Journal of Physiology, 160(3), 494-512. [30] Fry, F. and Johnson, L.K. (1978) Tumor irradiation with intense ultrasound. Ultrasound in Medicine & Biology, 4(4), 337-341. [31] Britt, R.H., Lyons, B.E., Pounds, D.W. and Prionas, S.D. (1983) Feasibility of ultrasound hyperthermia in the treat- ment of malignant brain tumors. Medical Instrumentation, 7(2), 172-177. [32] Guthkelch, A.N., Carter, L.P., Cassady, J.R., Hynynen, K.H., Iacono, R.P., Johnson, P.C., Obbens, E.A., Roemer, R.B., Seeger, J.F. and Shimm, D.S. (1991)Treatment of malignant brain tumors with focused ultrasound hyper- thermia and radiation: results of a phase I trial. Journal of Neuro-Oncology, 10(3), 271-284. [33] Vykhodtseva, N.I., Hynynen, K. and Damianou, C. (1994) Pulse duration and peak intensity during focused ultra- sound surgery: Theoretical and experimental effects in rabbit brain in vivo. Ultrasound in Medicine & Biology, 20(9), 987-1000. [34] Hynynen, K., Vykhodtseva, N.I., Chung, A.H., Sorren- tino, V., Colucci, V. and Jolesz, F.A. (1997) Thermal ef- fects of focused ultrasound on the brain: Determination with MR imaging. Radiology, 204(1), 247-253. [35] Vykhodtseva, N., Sorrentino, V., Jolesz, F.A., Bronson, R.T. and Hynynen, K. (2000) MRI detection of the ther- mal effects of focused ultrasound on the brain. Ultra- sound in Medicine & Biology, 26(5), 871-880. [36] Hynynen, K., McDannold, N., Vykhodtseva, N. and Jolesz, F. (2001) Noninvasive MR imaging-guided focal opening of the blood-brain-barrier in rabbits. Radiology, 220(3), 640-646. [37] Hynynen, K., McDannold, N., Martin, H., Jolesz, F., Vy- khodtseva, N. (2003) The threshold for brain damage in rabbits induced by bursts of ultrasound in the presence of an ultrasound contrast agent (optison). Ultrasound in Medicine & Biology, 29(3), 473-481. [38] Hynynen, K., McDannold, N., Sheikov, N., Jolesz, F., Vykhodtseva, N. (2005) Local and reversible blood-brain barrier disruption by noninvasive focused ultrasound at frequencies suitable for trans-skull sonications. NeuroI- mage, 24(1), 12-20. [39] Jolesz, F.A. and Jakab, P.D. (1991) Acoustic pressure wave generation within a magnetic resonance imaging system: Potential medical applications. Magnetic Reso- nance Imaging, 1(5), 609-613. [40] Hynynen, K., Darkazanli, A., Damianou, C., Unger, E. and Schenck, J.F. (1992) MRI-guided ultrasonic hyper- thermia. 1992 Radiological Society of North America Annual Meeting, September 1992. [41] Hynynen, K., Damianou, C., Darkazanli, A., Unger, E. and Schenck, J.F. (1993) The feasibility of using MRI to monitor and guide noninvasive ultrasound surgery. Ul- trasound in Medicine & Biology, 19(1), 91-92. [42] Hynynen, K., Darkazanli, A., Damianou, C.A., Unger, E. and Schenck, J.F. (1993) Tissue thermometry during ul- trasound exposure. European Urology, 23(1), 12-16. [43] Hynynen, K., Freund, W.R., Cline, H.E., Chung, A.H., Watkins, R.D., Vetro, J.P. and Jolesz, F.A. (1996) A clini- cal, noninvasive, MR imaging-monitored ultrasound sur- gery method. Radiographics, 16(1), 185-195. [44] Khokhlova, V., Bailey, M., Reed, J., Cunitz, B., Kacz- kowski, P. and Crum, L. (2006) Effects of nonlinear propagation, cavitation, and boiling in lesion formation by high intensity focused ultrasound, in a gel phantom. Journal of the Acoustical Society of America, 119(3), 1834- 1848. [45] Coussios, C., Farny, C., Ter Haar, G. and Roy, R. (2007) Role of acoustic cavitation in the delivery and monitor- ing of cancer treatment by high-intensity focused ultra- sound (HIFU). I nter national Journal of Hyp erthermia, 23(2), 105-120. [46] Chung, A.H., Hynynen, K., Colucci, V., Oshio, K., Cline, H.E. and Jolesz, F.A. (1996) Optimization of spoiled gra- dient-echo phase imaging for in vivo localization of a focused ultrasound beam. Magnetic Resonance in Medi- cine, 36(5), 745-752. [47] Vykhodtseva, V., Sorrentino, V., Jolesz, F., Bronson, R. and Hynynen, K. (2000) MRI detection of the thermal effects of focused ultrasound on the brain. Ultrasound in Medicine & Biology, 26(5), 871-880. [48] Quesson, B., Zwart, J. and Moonen, C. (2000) Magnetic resonance temperature imaging for guidance of ther- motherapy. Journal of Magnetic Resonance Imaging, 12(4), 525-533. [49] Salomir, R., Palussière, J., Vimeux, F.C., de Zwart, J.A., Quesson, B., Gauchet, M., Lelong, P., Pergrale, J., Grenier, N. and Moonen, C.T.W (2000) Local hyperthermia with MR-guided focused ultrasound: Spiral trajectory of the focal point optimized for temperature uniformity in the target region. Journal of Magnetic Resonance Imaging, 12(4), 571-583. [50] McDannold, N., Hynynen, K. and Jolesz, F. (2000) MRI monitoring of the thermal ablation of tissue: Effects of long exposure times. Journal of Magnetic Resonance Imaging, 13(3), 421-427. [51] Fry, F.J., Kossoff, G., Eggleton, R.C. and Dunn, F. (1970) Threshold ultrasound dosages for structural changes in  C. Damianou et al. / J. Biomedical Science and Engineering 3 (2010) 763-775 775 Copyright © 2010 SciRes. JBiSE the mammalian brain. Journal of the Acoustical Society of America , 48(6), 1413-1417. [52] ter Haar, G. (1995) Ultrasound focal beam surgery. Ul- trasound in Medicine & Biology, 21(9), 1089-1100. [53] Chavrier, F., Chapelon, Y., Gelet, A. and Cathignol, D. (2000) Modelling of high-intensity focused ultrasound- induced lesions in the presence of cavitation bubbles. Journal of the Acoustical Society of America, 108(1), 432-440. [54] Hynynen, K., Damianou, C.A., Colucci, V., Unger, E., Cline, H.H. and Jolesz, F.A. (1995) MR monitoring of focused ultrasonic surgery of renal cortex: Experimental and simulation studies. Journal of Magnetic Resonance Imaging, 5(3), 259-266. |