Journal of Water Resource and Protection, 2012, 4, 885-890
http://dx.doi.org/10.4236/jwarp.2012.410104 Published Online October 2012 (http://www.SciRP.org/journal/jwarp)
Geophysical Contribution for the Determination of Aquifer
Properties in Memve Ele, South Cameroon
Harlin L. Ekoro Nkoungou1, Philippe Njandjock Nouck1,2*, Dieudonné Bisso3,4,
Stéphane Assembe1, Eliézer Manguelle Dicoum1
1Department of Physics, Faculty of Science, University of Yaounde I, Yaounde, Cameroon
2International Institute for Water and Environmental Engineering, Ouagadougou, Burkina-Faso
3Department of Earth Sciences, Faculty of Science, University of Yaounde I, Yaounde, Cameroon
4Memve Ele Dam Project, Yaounde, Cameroon
Email: *pnnouck@yahoo.com
Received July 31, 2012; revised August 31, 2012; accepted September 29, 2012
ABSTRACT
This article aims to localise aquifer and to estimate hydraulic parameters such as transmissivity and tranverse resistance
in the Memve Ele dam site (26.35 km²) in South-Cameroon region, using audiomagnetotelluric (AMT) method. For this
purpose, resistivity data are collected at twenty-two measurement stations distributed along two perpendicular profiles
in the study area. The sounding curves of phase and impedance are modelled and interpreted. The geological models
and geoelectrical sections are also provided. The transverse resistivity and transmissivity field maps are plotted. The
audiomagnetotellurics insights have been compared with boreholes. All these results allow us to localise the area which
may be suitable to set up monitoring wells.
Keywords: Hydraulic Parameters; Aquifer; Audio-Magnetotelluric Method; Sounding Curves; Memve Ele
1. Introduction
Construction of great structures as dams implies delocal-
ization of populations from the targeted area. This is the
case of the Memve-Ele dam site project. The Choice of the
rehousing zones depends both on the qualitative and the
quantitative availability of water. Conventionally, these
parameters are estimated through pumping tests carried
out on water wells. Few boreholes are available and car-
rying out pumping tests at several sites may be costly and
time consuming. The application of geophysical methods
presents a cost-effective and efficient alternative to esti-
mate aquifer parameters [1]. This paper discusses the re-
sults obtained from twenty-two soundings carried out
through two perpendicular profiles using the audiomag-
netotelluric (AMT) method. The survey consists of a quite
fast and versatile geophysical investigation (AMT) tech-
nique applied to environmental studies focused on ground-
water, along with correlated mechanical drillings [2]. The
study was conducted in the Memve Ele dam site area.
The main objectives of these geophysical surveys were to
characterize aquifer lithology and main hydraulic
parameters, to describe the aquifer nature, characterize
the optimal drilling zone and the potential pollution risk
zone.
2. Geology
The Memve Ele site, in the lower reaches of the Ntem
basin, is located between latitudes N02˚15' and N02˚30',
E10˚15' and E10˚30'. Its catchment area is 26,350 km2.
At this site the Memve Ele waterfalls with about 35 m
head offer favourite site for a hydroelectric power plant
development. The geologic background suggests that the
formations encountered are widely composed of pyrox-
ene hornblende. These are essentially gneisseses and
granitic gneisses that come from metamorphosed pre-
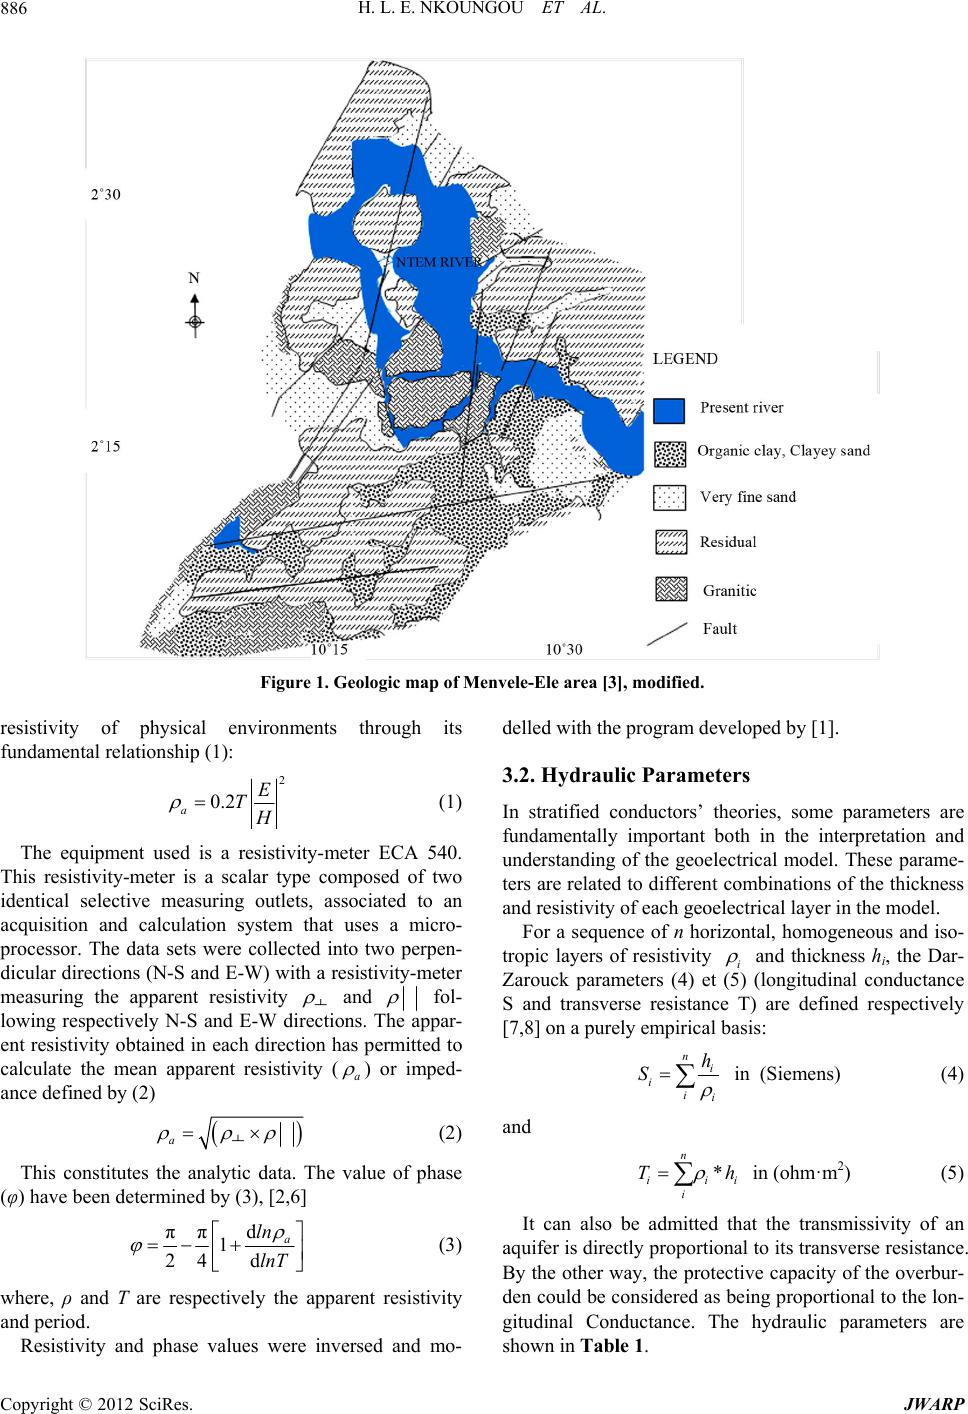
cambrian sedimentary rocks [3]. The geological map of
the dam site is shown in Figure 1. The site’s geological
feature is characterized by the development and distribu-
tion of faults and schiscosity in the same direction [4].
The result of seismicity analysis shows that only three
events had affected the site during past some 300 years
[3]. The area’s earthquaque coefficient (k) for the return
period of 100 years is given by k = 0.001 G. There is no
geological evidence regarding the active faults that re-
sults from investigations.
3. Methodology
3.1. Data Acquisition
The acquisition of data is based on the magnetotelluric
method principle [5] which mainly measures the apparent
*Corresponding author.
C
opyright © 2012 SciRes. JWARP
H. L. E. NKOUNGOU ET AL.
886
Figure 1. Geologic map of Menvele-Ele area [3], modified.
resistivity of physical environments through its
fundamental relationship (1):
2
0.2
a
E
T
H
(1)
The equipment used is a resistivity-meter ECA 540.
This resistivity-meter is a scalar type composed of two
identical selective measuring outlets, associated to an
acquisition and calculation system that uses a micro-
processor. The data sets were collected into two perpen-
dicular directions (N-S and E-W) with a resistivity-meter
measuring the apparent resistivity
and
fol-
lowing respectively N-S and E-W directions. The appar-
ent resistivity obtained in each direction has permitted to
calculate the mean apparent resistivity (a
) or imped-
ance defined by (2)

a


(2)
This constitutes the analytic data. The value of phase
(φ) have been determined by (3), [2,6]
d
ππ
1d
a
ln
lnT24



(3)
where, ρ and T are respectively the apparent resistivity
and period.
Resistivity and phase values were inversed and mo-
delled with the program developed by [1].
3.2. Hydraulic Parameters
In stratified conductors’ theories, some parameters are
fundamentally important both in the interpretation and
understanding of the geoelectrical model. These parame-
ters are related to different combinations of the thickness
and resistivity of each geoelectrical layer in the model.
For a sequence of n horizontal, homogeneous and iso-
tropic layers of resistivity i
and thickness hi, the Dar-
Zarouck parameters (4) et (5) (longitudinal conductance
S and transverse resistance T) are defined respectively
[7,8] on a purely empirical basis:
n
i
i
ii
h
S
in (Siemens) (4)
and
*
n
iii
i
Th
in (ohm·m2) (5)
It can also be admitted that the transmissivity of an
aquifer is directly proportional to its transverse resistance.
By the other way, the protective capacity of the overbur-
den could be considered as being proportional to the lon-
gitudinal Conductance. The hydraulic parameters are
shown in Table 1.
Copyright © 2012 SciRes. JWARP
H. L. E. NKOUNGOU ET AL. 887
4. Results and Discussion
4.1. Sounding Curves
The curves resulting from the whole soundings presented
a five layered earth’s model whose ranges of values led
us to a three group’s classification according to the cov-
ering resistivity values’ ranges and drillings results. The
low covering resistivity values (100 - 200 ·m) have
been obtained at stations A1 and A4, the middle covering
values of resistivity (200 - 300 ·m) have been obtained
at A2, A3, A5, B1 and B2 while the high resistivity val-
ues (300 - 1000 ·m) have been obtained at stations B3,
B4 and B5 (Figures 2 to 4 and Table 2).
4.2. Geoelectrical Sections
Gathering the sounding curves, we delineate four resisti-
vity values’ ranges suggesting a four layered earth model.
Moreover, a strong gradient of resistivity has been ob-
served between the third and the fourth layer. These lay-
ers have been assumed by comparing resistivity values’
ranges with data in Table 3. From the observation of
Table 1. Hydraulic par ameters.
Profile Station Aquifer Deep (m) Aquifer Resistivity Aquifer ThicknessLongitudinal Conductance Transverse Resistance
A1 51 38 9 0.24 342
A2 52 50 13 0.26 650
A3 51 62 20 0.32 1240
A4 52 43 15 0.35 645
A
A5 44 58 15 0.26 870
B1 53 52 13 0.25 676
B2 49 60 17 0.28 1020
B3 54 52 12 0.23 624
B4 46 79 19 0.24 1501
B
B5 54 60 14 0.23 840
Figure 2. A2 sounding curves (Aloum 1).
Copyright © 2012 SciRes. JWARP
H. L. E. NKOUNGOU ET AL.
888
Figure 3. A4 sounding curves (Nzog Yop).
Figure 4. B5 sounding curve s (E. P. Nnemeyong).
Table 2. Thicknesses and resistivity’s values resulting from
soundings curves.
A1 A2 A3 A4 A5
Layer ρ h ρ h ρh ρ h ρh
1 164 8 264 7 213 7 131 17 259 8
2 2079 43 1500 45 2267 44 984 35 1639 36
3 38 9 50 13 62 20 43 15 58 15
4 2955 4821 2386 2232 2761 2372 2429 1859 2956 4138
B1 B2 B3 B4 B5
Layer ρ h ρ h ρh ρ h ρh
1 246 16 246 21 696 18 461 19 3507
2 2539 37 2181 28 3231 36 5867 27 3325 47
3 52 13 60 17 52 12 79 19 60 14
4 2014 4157 2901 3106 2833 6833 2751 5499 2281 2508
Table 3. Geoelectrical model.
Lithology (prevalence) Resistivity (·m)
Captive aquifer 40 - 100 (·m)
Lateritic clay 100 - 200 (·m)
Organic deposit 200 - 300 (·m)
Weathered granite-gneiss 300 - 1000 (·m)
Granite-gneiss 1000 - 10,000 (·m)
sounding curves obtained and mechanical drillings car-
ried out in the study area, we obtained the following geo-
electrical models (Figure 5) which are similar to those
proposed by [9,10].
Copyright © 2012 SciRes. JWARP
H. L. E. NKOUNGOU ET AL. 889
O.O.
O.O.
O.O.
O.O.
O.O.
40 - 100 ·m
100 - 200 ·m
200 - 300 ·m
300 - 1000 ·m
1000 - 10000 ·
m
40 - 100 ·m
100 - 200 ·m
200 - 300 ·m
300 - 1000 ·m
1000 - 10000 ·m
Figure 5. Geoelectrical sections.
5. Structural Analysis
5.1. Aquifer Nature
It arises that the lithology of the area is not homogeneous
for the first two layers, due to old seismic movements.
This is materialized by the in subsurface uplift of deep
granite-gneisses in stations A3 and A5 for the first profile,
and between B2 and B5 for the second profile (Table 1).
This near surface presence of deep granite-gneisses sug-
gests that the area underwent intense tectonics after
which the aquifer layer has been set up [10,11]. We as-
sumed that the probable captive potable aquifer, which
correspond to the third layer regarding its resistivity
range (49 - 100 ·m) observed, was formed before seis-
mic events. Moreover, the geological map highlights the
presence of obvious faults at these places [3,4] because
seismic movements are noticeable on surface.
5.2. Optimal Drilling Zone
The analysis of the transmissivity field (Figure 7) esti-
mated from transverse resistance (Figure 6) highlights
the significant space variability of this parameter. The
transmissive zones are located in the north-eastern part of
the study area, between stations B3 and B5 where the
geological map (Figure 1) shows a significant network
of transverse faults; furthermore, these zones are marked
by old seismic activities evidenced by the appearance of
deep gneiss-granites at near subsurface. In addition, the
average depth for both profiles can be accessed around
50 meters and the optimal drilling zone is not set in the
future flooded zone.
5.3. Aquifer protection
Observation of conductivity’s variation maps resulting
from precedent data shows a weak variation (0.23 to 0.35
Siemens) of the ground water’s conductivity in the area,
inferring the quasi similar properties of the aquifer in this
area. In addition, the samples collected by the KOEI
Company did not present any physicochemical risk; this
implies the inexistence of risky zones in this area.
6. Conclusion
The geophysical survey allowed us to obtain lithological
identification and to characterize the conditions of the
underground flow of the studied area. One ground w-
terunit was identified. A map of the transverse unit resis-
tance illustrates the aquifer. In this map, the tendencies of
Figure 6. Transverse resistivity.
Figure 7. Transmissivity field map.
Copyright © 2012 SciRes. JWARP
H. L. E. NKOUNGOU ET AL.
Copyright © 2012 SciRes. JWARP
890
high values of Transverse resistance can be associated
with high transmissivity zones; hence, these zones are
suggested for the installation of monitoring wells for the
unconfined aquifer. The map of longitudinal conductance
associated to hydrochemical result illustrates that, in the
studied area, an eventual contamination risk zone was not
identified.
REFERENCES
[1] M. Pirttijärvi, “Joint Interpretation of Electromagnetic
and Geoelectrical Soundings Using 1-D Layered Earth
Model,” User’s Guide to Version 1.3, Oulu, 2004, 48 p.
[2] P. Weidelt “The Inverse Problem of Geomagnetic Induc-
tion,” Journal of Geophysics, Vol. 38, 1972, pp. 257-289.
[3] C. K. Nippon, “Faisability Study on Menve Ele Hydro
Electric, Power Development Project,” Final Report:
AES-SONEL, Cameroon, 1993, 74 p.
[4] V. Caron, E. Ekomane, G. Mahieux, P. Moussango and E.
Ndjeng, “The Mintom Formation (New): Sedimentology
and Geochemistry of Neoproterozoic, Paralic Succession
in South-East Cameroon,” Journal of African Earth Sci-
ences, Vol. 57, No. 4, 2009, pp. 367-385.
doi:10.1016/j.jafrearsci.2009.11.006
[5] L. Cagniard, “Basic Theory of the Magneto Telluric
Method of Geophysical Prospecting,” Geophysics, Vol.
18, 1953, pp. 605-635. doi:10.1190/1.1437915
[6] Y. Ogawa, “On Two-Dimensional Modeling of Mag-
netotelluric Field Data,” Geophysics Survey, Vol. 23, No.
2-3, 2002, pp. 251-273. doi:10.1023/A:1015021006018
[7] J. Asfahani, “Neogene Aquifer Properties Specified
through the Interpretation of Electrical Sounding Data,
Salamiyeh Region, Central Syria,” Hydrological Pro-
cesses, Vol. 21, 2007, pp. 2934-2943.
doi:10.1002/hyp.6510
[8] A. A. R. Zohdy, P. G. Eaton and R. D. Mabey, “Applica-
tion of Surface Geophysics to Groundwater Investiga-
tions,” US Geological Survey Techniques of Water Water
Resources investigations, Book 2, 1974.
[9] J. L. Meli’i, P. N. Njandjock and H. D. Gouet, “Mag-
netotelluric Method for Groundwater Exploration in Cry-
stalline Basement Complex, Cameroon,” Journal of En-
vironmental Hydrology, Vol. 19, 2011, p. 16.
[10] J. L. Melii, P. N. Njandjock, A. F. Mbanga and E. Man-
guelle-Dicoum, “Spatial Analyses of Magnetotelluric Da-
ta in the Northern Part of Congo Craton in South Came-
roon Region,” Journal of Emerging Trends in Engi-
neering and Applied, Vol. 3, N. 4, 2011, pp. 631-635.
[11] W. A. Teikeu, P. N. Njandjock, T. Ndougsa-Mbarga and
T. C. Tabod, “Geoelectric Investigation for Groundwater
Exploration in Yaoundé Area, Cameroon,” International
Journal of Geosciences, Vol. 3, 2012, pp. 640-649.