 Open Journal of Urology, 2012, 2, 198-205 http://dx.doi.org/10.4236/oju.2012.223035 Published Online October 2012 (http://www.SciRP.org/journal/oju) Endorectal Magnetic Resonance Imaging and Spectroscopy Are Useful for Selecting Candidates for Biopsy among Patients with Persistently Elevated Prostate Specific Antigen Josep Comet-Batlle1*, Carles Barceló-Vidal2, Joan Carles Vilanova-Busquets3, Roger Boix-Orri1, Albert Maroto-Genover4, Joan Areal-Calama5, Margarita Osorio-Fernandez4, Ferran Perez-Bueno6, Nuria Fuertes-Izquierdo1 1Urology Department, Hospital Dr. Josep Trueta, Catalonia, Spain 2Department of Computer Science and Applied Mathematics, University of Girona, Catalonia, Spain 3Ressonància Girona, Catalonia, Spain 4Radiology Department, Hospital Dr. Josep Trueta, Catalonia, Spain 5Urology Department, Hospital Trias Pujol, Catalonia, Spain 6Pathology Department, Hospital Dr. Josep Trueta, Catalonia, Spain Email: *28547jcb@comb.cat Received August 3, 2012; revised September 4, 2012; accepted September 19, 2012 ABSTRACT Objective: To evaluate the efficacy of endorectal Magnetic Resonance Imaging (MRI) and Magnetic Resonance Spet- roscopic Imaging (MRSI) combined with total prostate-specific antigen (tPSA) and free prostate-specific antigen (fPSA) in selecting candidates for biopsy. Subjects and Methods: 246 patients with elevated tPSA (median: 7.81 ng/ml) un- derwent endorectal MRI and MRSI before Transrectal Ultrasound (TRUS) biopsy (10 peripheral + 2 central cores); patients with positive biopsies were treated with radical intention; those with negative biopsies were followed up and underwent MRSI before each additional biopsy if tPSA rose persistently. Mean follow-up: 27.6 months. We compared MRI, MRSI, tPSA, and fPSA with histopathology by sextant and determined the association between the Gleason score and MRI and MRSI. We determined the most accurate combination to detect prostate cancer (PCa) using receiver oper- ating curves; we estimated the odds ratios (OR) and calculated sensitivity, specificity, and positive and negative predic- tive values. Results: No difference in tPSA was found between patients with and without PCa (p = 0.551). In the pe- ripheral zone, the risk of PCa increased with MRSI grade; patients with high-grade MRSI had the greatest risk of PCa over time (OR = 328.6); the model including MRI, MRSI, tPSA, and fPSA was more accurate (Area under Curve: AUC = 95.7%) than MRI alone (AUC = 85.1%) or fPSA alone (AUC = 78.1%), but not than MRSI alone (94.5%). In the transitional zone, the model was less accurate (AUC = 84.4%). The association (p = 0.005) between MRSI and Gleason score was significant in both zones. Co nclusions: MRSI is useful in patients with elevated tPSA. High-grade MRSI lesions call for repeated biopsies. Men with negative MRSI may forgo further biopsies because a significantly high Gleason lesion is very unlikely. Keywords: Endorectal MRI; Spectroscopy; Prostate Cancer; Diagnosis; Prostate Specific Antigen (PSA); Free to Total PSA Ratio (F/T PSA) 1. Introduction The two most common methods of screening for prostate cancer (PCa), digital rectal examination (DRE) and se- rum total prostate-specific antigen (tPSA) levels, yield suboptimal accuracy. The specificity of tPSA is poor for levels < 10 ng/ml [1,2]. Thus, 60% to 75% of men with tPSA between 4 ng/ml and 10 ng/ml undergo unneces- sary biopsies [3]. Moreover, men can have elevated tPSA and multiple previous negative biopsies before a diagno- sis of PCa is established. The use of %fPSA reduces the number of unnecessary biopsies whilst maintaining a high PCa detection rate [4,5]. Combined endorectal MRI and 3D-MRSI have proven accurate in determining the location of PCa [6,7]. We aimed to assess the value of endorectal MRI and 3D-MRSI combined with %fPSA to select patients for biopsy among men with elevated tPSA throughout long-term follow-up. *Corresponding author. C opyright © 2012 SciRes. OJU  J. COMET-BATLLE ET AL. 199 2. Material and Methods 2.1. Subjects Our institutional review board approved this prospective study, and all patients provided informed consent. We selected 246 patients (median age, 61.0 y; range, 44 - 77) to undergo endorectal MRI/3D-MRSI before 12- core transrectal ultrasound-guided (TRUS) biopsy. Inclu- sion criteria were rise in tPSA > 50% or tPSA velocity > 0.75 ng/ml/year and negative or inconclusive DRE. No patients with clear nodules or hardness of the prostate at DRE were included. Before entering the study, 3 pa- tients had undergone retropubic adenomectomy and 18 transurethral resection of the prostate (TURP) for symp- toms of benign prostatic hyperplasia (BPH), so the tran- sition zone was not biopsied in these 21 patients because of a lack of visible tissue at TRUS. Patients with negative biopsies were followed-up, and they underwent MRI/3D-MRSI before each additional biopsy (up to 3) if tPSA rose persistently. Patients who were found prostate cancer were treated with radical treatment (Radical prostatectomy or Radiotherapy) if indicated. Variables collected included tPSA level and %fPSA. 2.2. MRI and 3D-MRSI Techniques We used a 1.5-T whole-body MRI unit (Signa Horizon V.12.0; GE) with a body coil and a phased-array pelvic coil together with an expandable endorectal coil (Endo ATD Medrad; Warrendale, PA, USA) for signal recap- tion. We acquired A) axial T1-weighted sequences of the pelvic region and B) axial and coronal high resolution T2-weighted fast spin-echo sequences of the prostate and seminal vesicles. The 3D-MRSI data were processed and aligned with the corresponding MR image on a work- station using commercially available software (Functool, GE). Peak areas for choline, creatine, and citrate were calculated using numeric integration. Metabolic ratio maps of [choline + creatine]/citrate ([CC]/Ci) were gen- erated. The 3D-MRSI datasets were acquired as 16 × 8 × 8 phase-encoded spectral arrays (1024 voxels) with a spa- tial resolution of 0.24 - 0.34 cm³ and 1000130 . Image acquisition took 19 minutes and the entire examination, including coil placement, patient positioning, and MRI and 3D-MRSI acquisition took 50 to 60 minutes. 2.3. Image Interpretation Three radiologists with extensive experience in MRI and 3D-MRSI imaging interpretation (12, 6 and 4 years ex- perience, respectively) evaluated in consensus all MRI and MR spectroscopic findings. For tumor localization, the prostate was split along the midline and further di- vided into the apex, middle, and base of the gland (Fig- ure 1). Thus, the prostate was divided into 6 regions in the peripheral zone (PZ) and 2 in the transition zone (TZ). Image evaluation consisted of two parts. First, the three readers scored the T2-weighted images using a five-point scale. The presence of cancer, identified as an area of low signal intensity, was recorded for each region. Read- ers graded their confidence that cancer was present in each region on a five-point scale, as follows: grade 1 indicated definitely no tumor; 2, probably no tumor; 3, tumor possible; 4, tumor probable; and 5, tumor defini- tely present. Second, all 3D-MRSI data were read inde- pendently. All the voxels in the 8 regions were evaluated and each region was also scored on the five-point scale. Mean values of the [CC]/Ci ratio were categorized using different scores for the PZ and TZ, according to Kurha- newicz et al. [8]. In the PZ, a score of 1 was assigned to voxels with [CC]/Ci<0.5; 2 to voxels with 0.5 [CC]/Ci < 0.6; 3 to voxels with 0.6 [CC]/Ci < 0.7; 4 to voxels with 0.7 [CC]/Ci < 0.8; and 5 to voxels with [CC]/Ci 0.8. For the TZ, score 1 was assigned to voxels with a [CC]/Ci<0.8; 2 to voxels with 0.8 [CC]/Ci < 0.9; 3 to voxels with 0.9 [CC]/Ci < 1.0; 4 to voxels with 1.0 [CC]/Ci < 1.1; and 5 to voxels with [CC]/Ci 1.1. 2.4. Biopsy After standard preparation, all patients underwent TRUS biopsy by using a US scanner (Allegra; Siemens, Erlan- gen, Germany) with a 6.5 MHz sector probe. Twelve prostatic cores were obtained using an 18-gauge biopsy needle (Bard Urological; Covington, GA, USA) with a spring-loaded biopsy gun (Manan Medical Pruducts, Northbrook, Ill.). In patients without pathological images on MRI/3D-MRSI, 10 cores were obtained from the PZ Figure 1. Schematic representation of the different areas in which the prostate was divided (6 in the Peripheral Zone and 2 in the Transition Zone) and the cores taken from each area in every biopsy. Copyright © 2012 SciRes. OJU 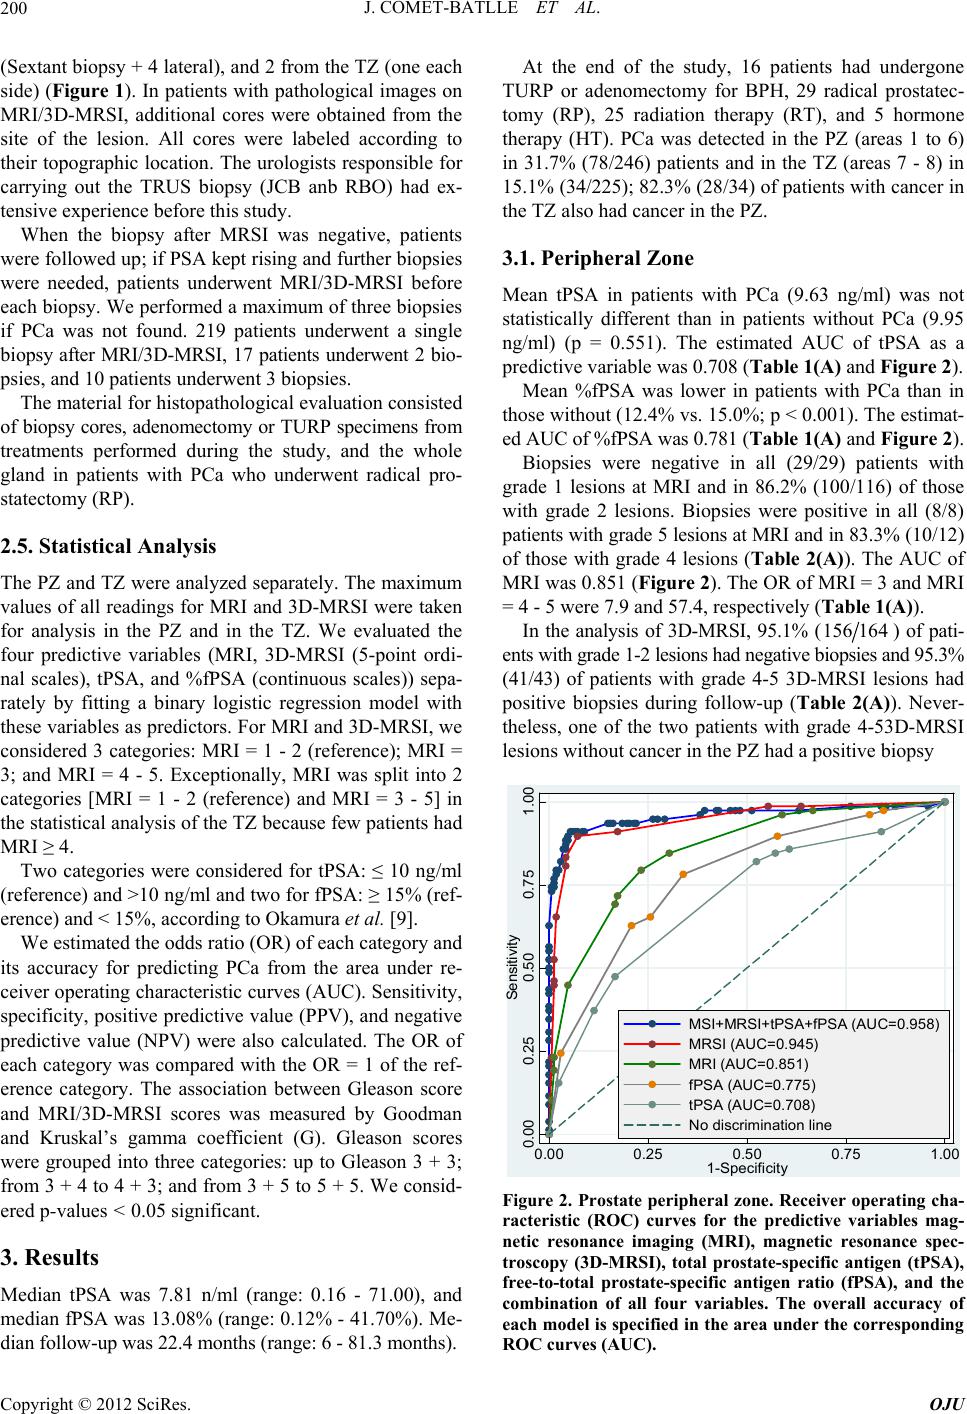 J. COMET-BATLLE ET AL. 200 (Sextant biopsy + 4 lateral), and 2 from the TZ (one each side) (Figure 1). In patients with pathological images on MRI/3D-MRSI, additional cores were obtained from the site of the lesion. All cores were labeled according to their topographic location. The urologists responsible for carrying out the TRUS biopsy (JCB anb RBO) had ex- tensive experience before this study. When the biopsy after MRSI was negative, patients were followed up; if PSA kept rising and further biopsies were needed, patients underwent MRI/3D-MRSI before each biopsy. We performed a maximum of three biopsies if PCa was not found. 219 patients underwent a single biopsy after MRI/3D-MRSI, 17 patients underwent 2 bio- psies, and 10 patients underwent 3 biopsies. The material for histopathological evaluation consisted of biopsy cores, adenomectomy or TURP specimens from treatments performed during the study, and the whole gland in patients with PCa who underwent radical pro- statectomy (RP). 2.5. Statistical Analysis The PZ and TZ were analyzed separately. The maximum values of all readings for MRI and 3D-MRSI were taken for analysis in the PZ and in the TZ. We evaluated the four predictive variables (MRI, 3D-MRSI (5-point ordi- nal scales), tPSA, and %fPSA (continuous scales)) sepa- rately by fitting a binary logistic regression model with these variables as predictors. For MRI and 3D-MRSI, we considered 3 categories: MRI = 1 - 2 (reference); MRI = 3; and MRI = 4 - 5. Exceptionally, MRI was split into 2 categories [MRI = 1 - 2 (reference) and MRI = 3 - 5] in the statistical analysis of the TZ because few patients had MRI ≥ 4. Two categories were considered for tPSA: ≤ 10 ng/ml (reference) and >10 ng/ml and two for fPSA: ≥ 15% (ref- erence) and < 15%, according to Okamura et al. [9]. We estimated the odds ratio (OR) of each category and its accuracy for predicting PCa from the area under re- ceiver operating characteristic curves (AUC). Sensitivity, specificity, positive predictive value (PPV), and negative predictive value (NPV) were also calculated. The OR of each category was compared with the OR = 1 of the ref- erence category. The association between Gleason score and MRI/3D-MRSI scores was measured by Goodman and Kruskal’s gamma coefficient (G). Gleason scores were grouped into three categories: up to Gleason 3 + 3; from 3 + 4 to 4 + 3; and from 3 + 5 to 5 + 5. We consid- ered p-values < 0.05 significant. 3. Results Median tPSA was 7.81 n/ml (range: 0.16 - 71.00), and median fPSA was 13.08% (range: 0.12% - 41.70%). Me- dian follow-up was 22.4 months (range: 6 - 81.3 months). At the end of the study, 16 patients had undergone TURP or adenomectomy for BPH, 29 radical prostatec- tomy (RP), 25 radiation therapy (RT), and 5 hormone therapy (HT). PCa was detected in the PZ (areas 1 to 6) in 31.7% (78/246) patients and in the TZ (areas 7 - 8) in 15.1% (34/225); 82.3% (28/34) of patients with cancer in the TZ also had cancer in the PZ. 3.1. Peripheral Zone Mean tPSA in patients with PCa (9.63 ng/ml) was not statistically different than in patients without PCa (9.95 ng/ml) (p = 0.551). The estimated AUC of tPSA as a predictive variable was 0.708 (Table 1(A) and Figure 2). Mean %fPSA was lower in patients with PCa than in those without (12.4% vs. 15.0%; p < 0.001). The estimat- ed AUC of %fPSA was 0.781 (Table 1(A) and Figure 2). Biopsies were negative in all (29/29) patients with grade 1 lesions at MRI and in 86.2% (100/116) of those with grade 2 lesions. Biopsies were positive in all (8/8) patients with grade 5 lesions at MRI and in 83.3% (10/12) of those with grade 4 lesions (Table 2(A)). The AUC of MRI was 0.851 (Figure 2). The OR of MRI = 3 and MRI = 4 - 5 were 7.9 and 57.4, respectively (Table 1(A)). In the analysis of 3D-MRSI, 95.1% (156164) of pati- ents with grade 1-2 lesions had negative biopsies and 95.3% (41/43) of patients with grade 4-5 3D-MRSI lesions had positive biopsies during follow-up (Table 2(A)). Never- theless, one of the two patients with grade 4-53D-MRSI lesions without cancer in the PZ had a positive biopsy 0.00 0.25 0.50 0.75 1.00 ensitivit 0.00 0.25 0.50 0.75 1.00 1-Specificity MSI+MRSI+tPSA+fPSA (AUC=0.958) MRSI (AUC=0.945) MRI (AUC=0.851) fPSA (AUC=0.775) tPSA (AUC=0.708) No discrimination line Figure 2. Prostate peripheral zone. Receiver operating cha- racteristic (ROC) curves for the predictive variables mag- netic resonance imaging (MRI), magnetic resonance spec- troscopy (3D-MRSI), total prostate-specific antigen (tPSA), free-to-total prostate-specific antigen ratio (fPSA), and the combination of all four variables. The overall accuracy of each model is specified in the area under the corresponding ROC curves (AUC). Copyright © 2012 SciRes. OJU 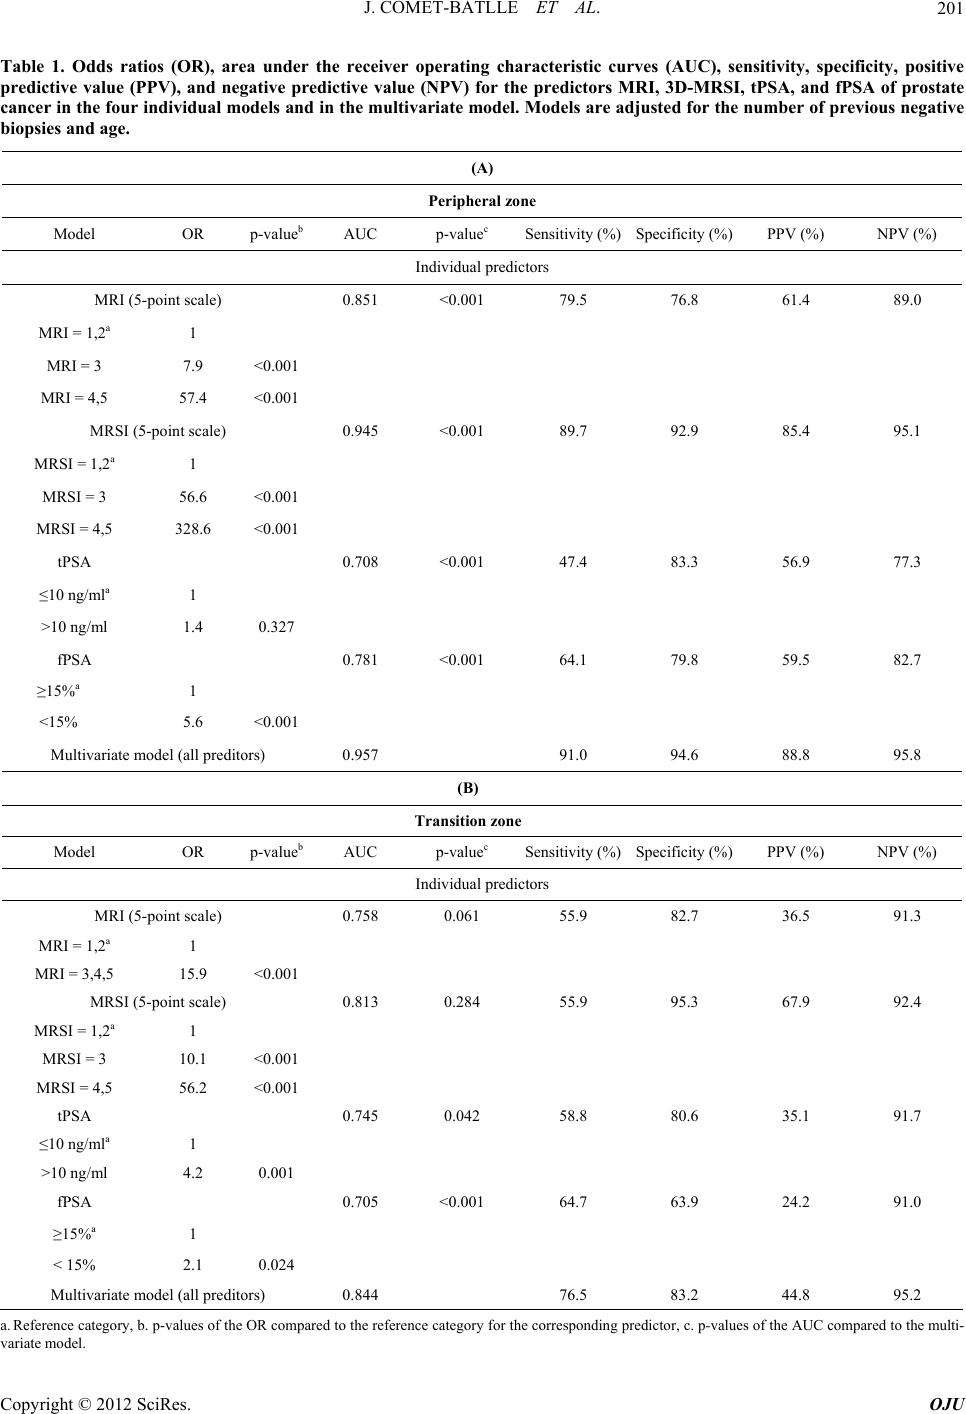 J. COMET-BATLLE ET AL. Copyright © 2012 SciRes. OJU 201 Table 1. Odds ratios (OR), area under the receiver operating characteristic curves (AUC), sensitivity, specificity, positive predictive value (PPV), and negative predictive value (NPV) for the predictors MRI, 3D-MRSI, tPSA, and fPSA of prostate cancer in the four individual models and in the multivariate model. Models are adjusted for the number of previous negative biopsies and age. (A) Peripheral zone Model OR p-valueb AUC p-valuec Sensitivity (%)Specificity (%) PPV (%) NPV (%) Individual predictors MRI (5-point scale) 0.851 <0.001 79.5 76.8 61.4 89.0 MRI = 1,2a 1 MRI = 3 7.9 <0.001 MRI = 4,5 57.4 <0.001 MRSI (5-point scale) 0.945 <0.001 89.7 92.9 85.4 95.1 MRSI = 1,2a 1 MRSI = 3 56.6 <0.001 MRSI = 4,5 328.6 <0.001 tPSA 0.708 <0.001 47.4 83.3 56.9 77.3 ≤10 ng/mla 1 >10 ng/ml 1.4 0.327 fPSA 0.781 <0.001 64.1 79.8 59.5 82.7 ≥15%a 1 <15% 5.6 <0.001 Multivariate model (all preditors) 0.957 91.0 94.6 88.8 95.8 (B) Transition zone Model OR p-valueb AUC p-valuec Sensitivity (%)Specificity (%) PPV (%) NPV (%) Individual predictors MRI (5-point scale) 0.758 0.061 55.9 82.7 36.5 91.3 MRI = 1,2a 1 MRI = 3,4,5 15.9 <0.001 MRSI (5-point scale) 0.813 0.284 55.9 95.3 67.9 92.4 MRSI = 1,2a 1 MRSI = 3 10.1 <0.001 MRSI = 4,5 56.2 <0.001 tPSA 0.745 0.042 58.8 80.6 35.1 91.7 ≤10 ng/mla 1 >10 ng/ml 4.2 0.001 fPSA 0.705 <0.001 64.7 63.9 24.2 91.0 ≥15%a 1 < 15% 2.1 0.024 Multivariate model (all preditors) 0.844 76.5 83.2 44.8 95.2 a. Reference category, b. p-values of the OR compared to the reference category for the corresponding predictor, c. p-values of the AUC compared to the multi- variate model. 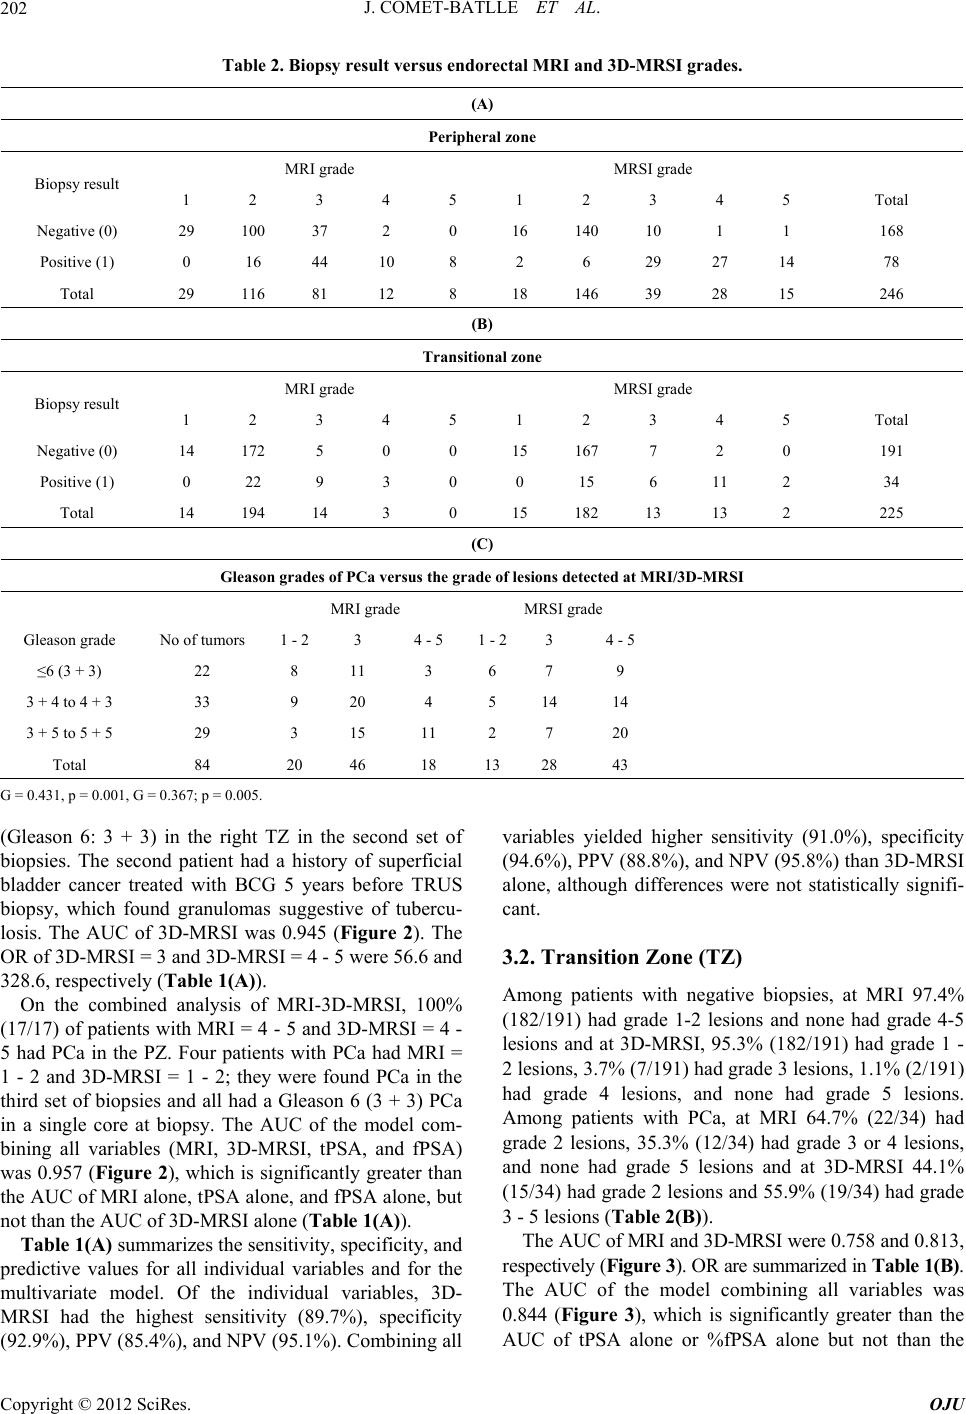 J. COMET-BATLLE ET AL. 202 Table 2. Biopsy result versus endorectal MRI and 3D-MRSI grades. (A) Peripheral zone MRI grade MRSI grade Biopsy result 1 2 3 4 5 1 2 3 4 5 Total Negative (0) 29 100 37 2 0 16 140 10 1 1 168 Positive (1) 0 16 44 10 8 2 6 29 27 14 78 Total 29 116 81 12 8 18 146 39 28 15 246 (B) Transitional zone MRI grade MRSI grade Biopsy result 1 2 3 4 5 1 2 3 4 5 Total Negative (0) 14 172 5 0 0 15 167 7 2 0 191 Positive (1) 0 22 9 3 0 0 15 6 11 2 34 Total 14 194 14 3 0 15 182 13 13 2 225 (C) Gleason grades of PCa versus the grade of lesions detected at MRI/3D-MRSI MRI grade MRSI grade Gleason grade No of tumors 1 - 2 3 4 - 5 1 - 23 4 - 5 ≤6 (3 + 3) 22 8 11 3 6 7 9 3 + 4 to 4 + 3 33 9 20 4 5 14 14 3 + 5 to 5 + 5 29 3 15 11 2 7 20 Total 84 20 46 18 13 28 43 G = 0.431, p = 0.001, G = 0.367; p = 0.005. (Gleason 6: 3 + 3) in the right TZ in the second set of biopsies. The second patient had a history of superficial bladder cancer treated with BCG 5 years before TRUS biopsy, which found granulomas suggestive of tubercu- losis. The AUC of 3D-MRSI was 0.945 (Figure 2). The OR of 3D-MRSI = 3 and 3D-MRSI = 4 - 5 were 56.6 and 328.6, respectively (Table 1(A)). On the combined analysis of MRI-3D-MRSI, 100% (17/17) of patients with MRI = 4 - 5 and 3D-MRSI = 4 - 5 had PCa in the PZ. Four patients with PCa had MRI = 1 - 2 and 3D-MRSI = 1 - 2; they were found PCa in the third set of biopsies and all had a Gleason 6 (3 + 3) PCa in a single core at biopsy. The AUC of the model com- bining all variables (MRI, 3D-MRSI, tPSA, and fPSA) was 0.957 (Figure 2), which is significantly greater than the AUC of MRI alone, tPSA alone, and fPSA alone, but not than the AUC of 3D-MRSI alone (Table 1(A)). Table 1(A) summarizes the sensitivity, specificity, and predictive values for all individual variables and for the multivariate model. Of the individual variables, 3D- MRSI had the highest sensitivity (89.7%), specificity (92.9%), PPV (85.4%), and NPV (95.1%). Combining all variables yielded higher sensitivity (91.0%), specificity (94.6%), PPV (88.8%), and NPV (95.8%) than 3D-MRSI alone, although differences were not statistically signifi- cant. 3.2. Transition Zone (TZ) Among patients with negative biopsies, at MRI 97.4% (182/191) had grade 1-2 lesions and none had grade 4-5 lesions and at 3D-MRSI, 95.3% (182/191) had grade 1 - 2 lesions, 3.7% (7/191) had grade 3 lesions, 1.1% (2/191) had grade 4 lesions, and none had grade 5 lesions. Among patients with PCa, at MRI 64.7% (22/34) had grade 2 lesions, 35.3% (12/34) had grade 3 or 4 lesions, and none had grade 5 lesions and at 3D-MRSI 44.1% (15/34) had grade 2 lesions and 55.9% (19/34) had grade 3 - 5 lesions (Table 2(B)). The AUC of MRI and 3D-MRSI were 0.758 and 0.813, respectively (Figure 3). OR are summarized in Table 1(B). The AUC of the model combining all variables was 0.844 (Figure 3), which is significantly greater than the AUC of tPSA alone or %fPSA alone but not than the Copyright © 2012 SciRes. OJU 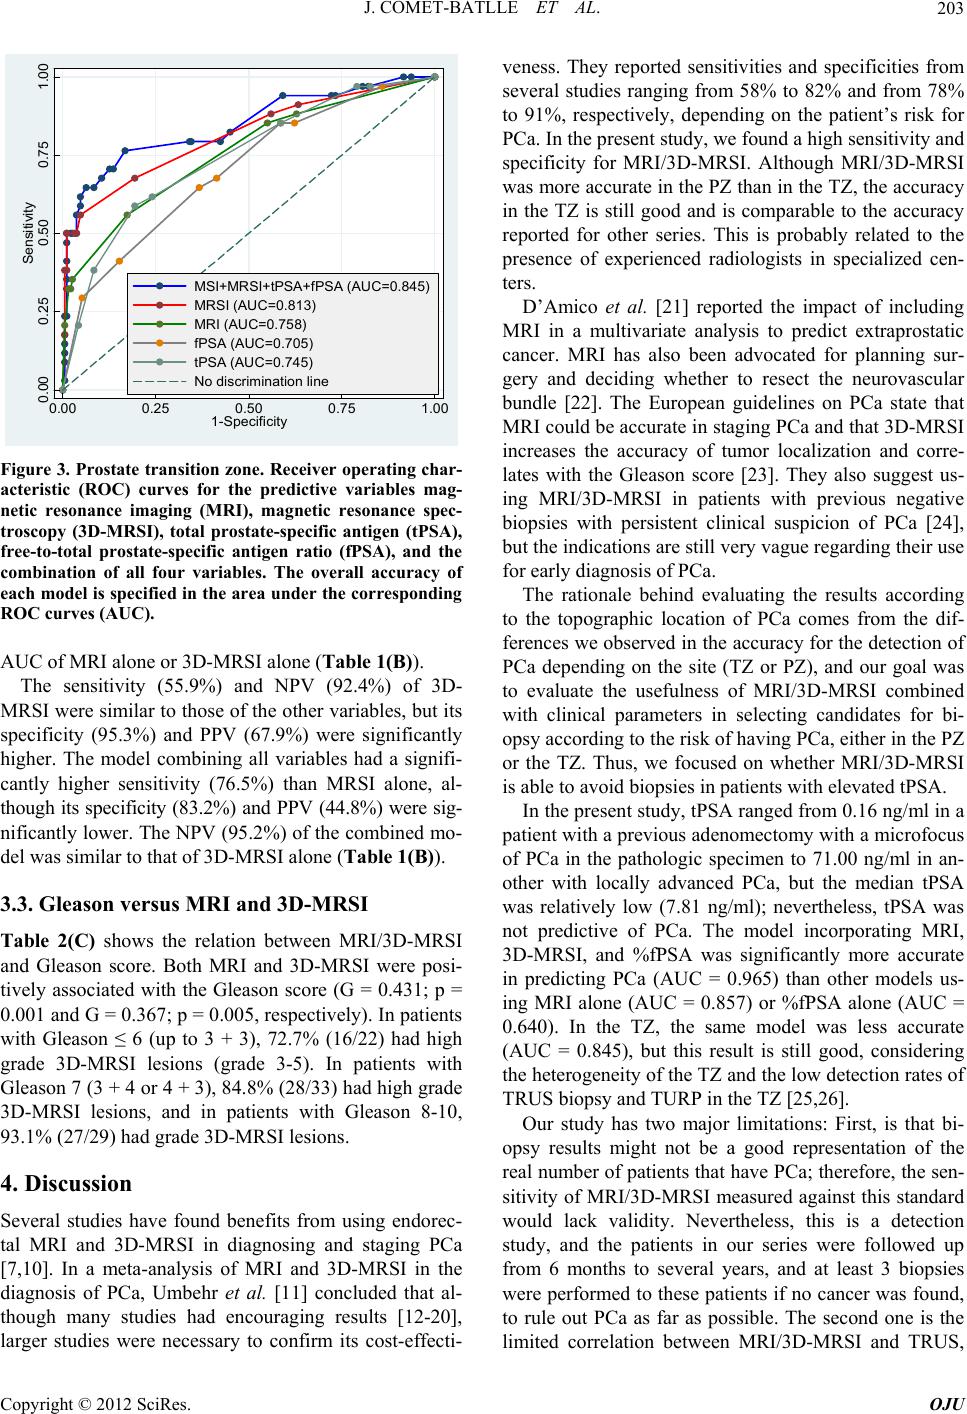 J. COMET-BATLLE ET AL. 203 0.00 0.25 0.50 0.75 1.00 Sensitivity 0.00 0.25 0.50 0.75 1.00 1-Specificity MSI+MRSI+tPSA+fPSA (AUC=0.845) MRSI (AUC=0.813) MRI (AUC=0.758) fPSA (AUC=0.705) tPSA (AUC=0.745) No discrimination line Figure 3. Prostate transition zone. Receiver operating char- acteristic (ROC) curves for the predictive variables mag- netic resonance imaging (MRI), magnetic resonance spec- troscopy (3D-MRSI), total prostate-specific antigen (tPSA), free-to-total prostate-specific antigen ratio (fPSA), and the combination of all four variables. The overall accuracy of each model is specified in the area under the corresponding ROC curves (AUC). AUC of MRI alone or 3D-MRSI alone (Table 1(B)). The sensitivity (55.9%) and NPV (92.4%) of 3D- MRSI were similar to those of the other variables, but its specificity (95.3%) and PPV (67.9%) were significantly higher. The model combining all variables had a signifi- cantly higher sensitivity (76.5%) than MRSI alone, al- though its specificity (83.2%) and PPV (44.8%) were sig- nificantly lower. The NPV (95.2%) of the combined mo- del was similar to that of 3D-MRSI alone (Table 1(B)). 3.3. Gleason versus MRI and 3D-MRSI Table 2(C) shows the relation between MRI/3D-MRSI and Gleason score. Both MRI and 3D-MRSI were posi- tively associated with the Gleason score (G = 0.431; p = 0.001 and G = 0.367; p = 0.005, respectively). In patients with Gleason ≤ 6 (up to 3 + 3), 72.7% (16/22) had high grade 3D-MRSI lesions (grade 3-5). In patients with Gleason 7 (3 + 4 or 4 + 3), 84.8% (28/33) had high grade 3D-MRSI lesions, and in patients with Gleason 8-10, 93.1% (27/29) had grade 3D-MRSI lesions. 4. Discussion Several studies have found benefits from using endorec- tal MRI and 3D-MRSI in diagnosing and staging PCa [7,10]. In a meta-analysis of MRI and 3D-MRSI in the diagnosis of PCa, Umbehr et al. [11] concluded that al- though many studies had encouraging results [12-20], larger studies were necessary to confirm its cost-effecti- veness. They reported sensitivities and specificities from several studies ranging from 58% to 82% and from 78% to 91%, respectively, depending on the patient’s risk for PCa. In the present study, we found a high sensitivity and specificity for MRI/3D-MRSI. Although MRI/3D-MRSI was more accurate in the PZ than in the TZ, the accuracy in the TZ is still good and is comparable to the accuracy reported for other series. This is probably related to the presence of experienced radiologists in specialized cen- ters. D’Amico et al. [21] reported the impact of including MRI in a multivariate analysis to predict extraprostatic cancer. MRI has also been advocated for planning sur- gery and deciding whether to resect the neurovascular bundle [22]. The European guidelines on PCa state that MRI could be accurate in staging PCa and that 3D-MRSI increases the accuracy of tumor localization and corre- lates with the Gleason score [23]. They also suggest us- ing MRI/3D-MRSI in patients with previous negative biopsies with persistent clinical suspicion of PCa [24], but the indications are still very vague regarding their use for early diagnosis of PCa. The rationale behind evaluating the results according to the topographic location of PCa comes from the dif- ferences we observed in the accuracy for the detection of PCa depending on the site (TZ or PZ), and our goal was to evaluate the usefulness of MRI/3D-MRSI combined with clinical parameters in selecting candidates for bi- opsy according to the risk of having PCa, either in the PZ or the TZ. Thus, we focused on whether MRI/3D-MRSI is able to avoid biopsies in patients with elevated tPSA. In the present study, tPSA ranged from 0.16 ng/ml in a patient with a previous adenomectomy with a microfocus of PCa in the pathologic specimen to 71.00 ng/ml in an- other with locally advanced PCa, but the median tPSA was relatively low (7.81 ng/ml); nevertheless, tPSA was not predictive of PCa. The model incorporating MRI, 3D-MRSI, and %fPSA was significantly more accurate in predicting PCa (AUC = 0.965) than other models us- ing MRI alone (AUC = 0.857) or %fPSA alone (AUC = 0.640). In the TZ, the same model was less accurate (AUC = 0.845), but this result is still good, considering the heterogeneity of the TZ and the low detection rates of TRUS biopsy and TURP in the TZ [25,26]. Our study has two major limitations: First, is that bi- opsy results might not be a good representation of the real number of patients that have PCa; therefore, the sen- sitivity of MRI/3D-MRSI measured against this standard would lack validity. Nevertheless, this is a detection study, and the patients in our series were followed up from 6 months to several years, and at least 3 biopsies were performed to these patients if no cancer was found, to rule out PCa as far as possible. The second one is the limited correlation between MRI/3D-MRSI and TRUS, Copyright © 2012 SciRes. OJU  J. COMET-BATLLE ET AL. 204 to ensure that cores were taken from the suspicious MRI area. For this reason, when performing the biopsies for this study, radiologists and urologists worked together to ensure as much as possible the best location of lesions detected at MRI/MRSI. We confirm the relation between 3D-MRSI and Glea- son score reported by Zakian et al. [27], who suggested the potential of 3D-MRSI for noninvasive assessment of PCa aggressiveness. We aimed to evaluate the predictive value of MRI/3D- MRSI in patients with suspected PCa and to correlate MRI/3D-MRSI findings with the clinical and pathologi- cal findings during long-term follow-up to establish the indication for MRI/3D-MRSI in these patients. We sug- gest patients with the following findings undergo TRUS biopsy: 1) Grade 4 or 5 3D-MRSI. 2) Grade 3 3D-MRSI and grade 3, 4, or 5 MRI. Finally, we are aware that multiparametric MRI has the advantages of being quicker and more widely avail- able [28] than 3D-MRSI, which is time consuming and requires special software. However, MRI/3D-MRSI is cost-effective because it is less expensive and has similar accuracy to diffusion for PCa detection in the PZ and may be more accurate than multiparametric MRI in the TZ [29]. Thus, MRI/3D-MRSI remains a good tool for centers with experience. 5. Conclusions 1) In patients with an elevated tPSA and fPSA < 15%, suspicious lesions at MRI/3D-MRSI must be biopsied. Negative biopsy results call for follow-up including re- peat biopsies 2) In patients without suspicious lesions at 3D-MRSI, biopsies for high tPSA might be unnecessary. 3) Negative MRI/3D-MRSI findings suggest that sig- nificant PCa, either in volume or in grade, is unlikely; therefore, MRI/3D-MRSI may obviate subsequent biop- sies in patients with high PSA or candidates for active surveillance. 6. Acknowledgements This research was partially supported by the Spanish Mi- nistry of Science and Innovation under project CODA- RSS (Ref. MTM2009-13272) and by the Agència de Gestió d’Ajuts Universitaris i de Recerca of the Gener- alitat de Catalunya (Ref. 2009SGR424). The authors also thank John Giba for his help with the English language. REFERENCES [1] I. M. Thompson, D. K. Pauler and P. J. Goodman, “Prevalence of Prostate Cancer among Men with a Pros- tate-Specific Antigen Level < or =4.0 ng per Milliliter,” The New England Journal of Medicine, Vol. 350, No. 22, 2004, pp. 2239-2246. doi:10.1056/NEJMoa031918 [2] C. G. Arcangeli, D. K. Ornstein and D. W. Keetch, “Pros- tate-Specific Antigen as a Screening Test for Prostate Cancer. The United States Experience,” Urologic Clinics of North America, Vol. 24, No. 2, 1997, pp. 299-306. doi:10.1016/S0094-0143(05)70376-1 [3] G. L. Andriole and W. J. Catalona, “Using PSA to Screen for Prostate Cancer. The Washington University Experi- ence,” Urologic Clinics of North America, Vol. 20, No. 4, 1993, pp. 647-651. [4] J. B. Shah, A. C. Reese and J. M. McKiernan, “PSA Up- dated: Still Relevant in the New Millennium?” European Urology, Vol. 47, No. 4, 2005, pp. 427-432. doi:10.1016/j.eururo.2004.12.020 [5] A. W. Roddam, M. J. Duffy and F. C. Hamdy, “Use of Prostate-Specific Antigen (PSA) Isoforms for the Detec- tion of Prostate Cancer in Men with a PSA Level of 2 - 10 ng/ml: Systematic Review and Meta-Analysis,” European Urology, Vol. 48, No. 3, 2005, pp. 386-399. doi:10.1016/j.eururo.2005.04.015 [6] J. Scheidler, H. Hricak and D. B. Vigneron, “Prostate Cancer: Localization with Three-Dimensional Proton MR Spectroscopic Imaging—Clinicopathologic Study,” Radi- ology, Vol. 213, No. 2, 1999, pp. 473-480. [7] A. E. Wefer, H. Hricak and D. B. Vigneron, “Sextant Localization of Prostate Cancer: Comparison of Sextant Biopsy, Magnetic Resonance Imaging and Magnetic Re- sonance Spectroscopic Imaging with Step Section Histo- logy,” Journal of Urology, Vol. 164, No. 2, 2000, pp. 400-404. doi:10.1016/S0022-5347(05)67370-3 [8] J. Kurhanewicz, D. B. Vigneron and H. Hricak, “Three Dimensional H-1 MR Spectroscopic Imaging of the in Situ Human Prostate with High (0.24 - 0.7 cm3) Spatial Resolution,” Radiology, Vol. 198, No. 3, 1996, pp. 795- 805. [9] K. Okamura, H. Takaba and O. Kamihira, “Determination of the Relative Probability for Prostate Cancer to Avoid Unnecessary Biopsies,” International Journal of Urology, Vol. 12, No. 4, 2005, pp. 346-352. doi:10.1111/j.1442-2042.2005.01056.x [10] J. Nakashima, A. Tanimoto and Y. Imai, “Endorectal MRI for Prediction of Tumour Site, Tumour Size, and Local Extension of Prostate Cancer,” Journal of Urology, Vol. 64, No. 1, 2004, pp. 101-105. doi:10.1016/j.urology.2004.02.036 [11] M. Umberh, L. M. Bachmann and U. Held, “Combined Magnetic Resonance Imaging and Magnetic Resonance Spectroscopy Imaging in the Diagnosis of Prostate Can- cer: A Systematic Review and Meta-Analysis,” European Urology, Vol. 55, No. 3, 2009, pp. 575-591. doi:10.1016/j.eururo.2008.10.019 [12] J. S. P Yuen, C. H. Thng and P. H. Tan, “Endorectal Magnetic Resonance Imaging and Spectroscopy for the Detection of Tumor Foci in Men with Prior Negative Transrectal Ultrasound Prostate Biopsy,” Journal of Uro- logy, Vol. 171, No. 4, 2004, pp. 1482-1486. Copyright © 2012 SciRes. OJU  J. COMET-BATLLE ET AL. Copyright © 2012 SciRes. OJU 205 doi:10.1097/01.ju.0000118380.90871.ef [13] D. Amsellem-Ouazana, P. Younes and S. Conquy, “Ne- gative Prostatic Biopsies in Patients with a High Risk of Prostate Cancer. Is the Combination of Endorectal MRI and Magnetic Resonance Spectroscopic Imaging (MRSI) a Useful Tool? A Preliminary Study,” European Urology, Vol. 47, No. 5, 2005, pp. 582-586. doi:10.1016/j.eururo.2005.01.015 [14] A. Shukla-Dave, H. Hricak and N. Ishill, “Correlation of MR Imaging and MR Spectroscopic Imaging Findings with Ki-67, Phospho-Akt, and Androgen Receptor Ex- pression in Prostate Cancer,” Radiology, Vol. 250, No. 3, 2009, pp. 803-807. doi:10.1148/radiol.2503080473 [15] S. Ikonen, P. Kärkkainen and L. Kivisaar, “Magnetic Resonance Imaging of Prostatic Cancer: Does Detection Vary between High and Low Gleason Score Tumors?” Prostate, Vol. 43, No. 1, 2000, pp. 43-48. doi:10.1002/(SICI)1097-0045(20000401)43:1<43::AID-P ROS6>3.0.CO;2-S [16] Y. Kubota, S. Kamei and M. Nakano, “The Potential Role of Prebiopsy Magnetic Resonance Imaging Combined with Prostate Specific Antigen Density in the Detection of Prostate Cancer,” International Journal of Urology, Vol. 15, No. 4, 2008, pp. 322-327. doi:10.1111/j.1442-2042.2008.01991.x [17] L. Wang, H. Hricak and M. Kattan, “Combined Endorec- tal and Phased-Array MRI in the Prediction of Pelvic Lymph Node Metastasis in Prostate Cancer,” American Journal of Roentgenology, Vol. 186, No. 3, 2006, pp. 743-748. doi:10.2214/AJR.04.1682 [18] J. Q. Zhang, K. R. Loughlin and K. H. Zou, “Role of Endorectal Coil Magnetic Resonance Imaging in Treat- ment of Patients with Prostate Cancer and in Determining Radical Prostatectomy Surgical Margin Status: Report of a Single Surgeon’s Practice,” Journal of Urology, Vol. 69, No. 6, 2007, pp. 1134-1137. doi:10.1016/j.urology.2007.01.094 [19] A. P. S. Kirkham, M. Emberton and C. Allen, “How Good Is MRI at Detecting and Characterising Cancer within the Prostate?” European Urology, Vol. 50, No. 6, 2006, pp. 1163-1175. doi:10.1016/j.eururo.2006.06.025 [20] N. G. Costouros, F. V. Coakley and A. C. Westphalen, “Diagnosis of Prostate Cancer in Patients with an Ele- vated PSA Level: Role of Endorectal MRI and MR Spec- troscopic Imaging,” American Journal of Roentgenology, Vol. 188, No. 3, 2007, pp. 812-816. doi:10.2214/AJR.06.0165 [21] A. V. D’Amico, R. Whittington and M. Schnall, “The Impact of the Inclusion of Endorectal Coil Magnetic Resonance Imaging in a Multivariate Analysis to Predict Clinically Unsuspected Extraprostatic Cancer,” Cancer, Vol. 75, No. 9, 1995, pp. 2368-2372. doi:10.1002/1097-0142(19950501)75:9<2368::AID-CNC R2820750929>3.0.CO;2-# [22] H. Hricak, L. Wang and D. C. Wei, “The Role of Preo- perative Endorectal Magnetic Resonance Imaging in the Decision Regarding Whether to Preserve or Resect Neu- rovascular Bundles during Radical Retropubic Prostatec- tomy,” Cancer, Vol. 100, 2004, pp. 2655-2663. doi:10.1002/cncr.20319 [23] “European Guidelines on Prostate Cancer of the European Association of Urology,” 2012. [24] “European Guidelines on Prostate Cancer of the European Association of Urology,” 2012. [25] R. Zigeuner, L. Schips and K. Lipsky, “Detection of Prostate Cancer by TURP or Open Surgery in Patients with Previously Negative Transrectal Prostate Biopsies,” Urology, Vol. 62, No. 5, 2003, pp. 883-887. doi:10.1016/S0090-4295(03)00663-0 [26] A. E. Pelzer, J. Bektic and A. P. Berger, “Are Transition Zone Biopsies Still Necessary to Improve Prostate Cancer Detection? Results from the Tyrol Screening Project,” European Urology, Vol. 48, No. 6, 2005, pp. 916-921. doi:10.1016/j.eururo.2005.07.012 [27] K. L. Zakian, K. Sircar and H. Hricak, “Correlation of Proton MR Spectroscopic Imaging with Gleason Score Based on Step Section Pathologic Analysis after Radical Prostatectomy,” Radiology, Vol. 234, No. 3, 2005, pp. 804-814. doi:10.1148/radiol.2343040363 [28] L. Dickinson, H. U. Ahmed and C. Allen, “Magnetic Resonance Imaging for the Detection, Localization and Characterisation of Prostate Cancer: Recommendations from a European Consensus Meeting,” European Urology, Vol. 59, No. 4, 2011, pp. 477-494. doi:10.1016/j.eururo.2010.12.009 [29] J. C. Vilanova, C. Barcelo and J. Comet, “Usefulness of Prebiopsy Multifunctional and Morphologic MRI Com- bined with Free to Total Prostate Specific Antigen Ratio in the Detection of Prostate Cancer,” American Journal of Roentgenology, Vol. 196, No. 6, 2011, pp. 715-722. doi:10.2214/AJR.10.5700
|