 Journal of Water Resource and Protection, 2012, 4, 877-884 http://dx.doi.org/10.4236/jwarp.2012.410103 Published Online October 2012 (http://www.SciRP.org/journal/jwarp) Seasonality in Abundance, Biomass and Production of the Phytoplankton of Welala and Shesher Wetlands, Lake Tana Sub-Basin (Ethiopia) Tarekgne Wondmagegne1, Ayalew Wondie2, Minwyelet Mingist3, Jacobus Vijverberg4* 1Department of Animal Science, Debre Markos University, Debre Markos, Ethiopia 2Department of Biology, Bahir Dar University, Bahir Dar, Ethiopia 3Department of Fisheries, Wetlands and Wildlife Management, Bahir Dar University, Bahir Dar, Ethiopia 4Department of Aquatic Ecology, Netherlands Institute of Ecology (NIOO-KNAW), Wageningen, The Netherlands Email: wtarekgne@yahoo.com, *k_vijverberg@yahoo.co.uk Received August 24, 2012; revised September 20, 2012; accepted October 19, 2012 ABSTRACT The species composition and production of the phytoplankton community of the Shesher and Welala floodplain Wet- lands, on the eastern side of Lake Tana, were studied during four seasons from July 2009 to May 2010. We investigated the spatial and temporal dynamics of phytoplankton, densities, biomass, in relation to physico-chemical conditions. Gross and net primary production was studied at one site in each Wetland. Temperature, dissolved oxygen, conductivity, Secchi-disc depth, nitrate, phosphate and silicate concentrations showed significant temporal variation (p < 0.05), whereas none of these parameters showed significant spatial variation (p > 0.05). Thirty six phytoplankton genera/spe- cies, belonging to 7 higher taxa were identified. The Chlorophyta dominated the phytoplankton community and con- tributed 42% - 53 % of the total observed phytoplankton numbers. Average phytoplankton biomass (chlorophyll a con- tent) over four seasons ranged from 9 - 121 μg·l–1 in Shesher and from 27 - 206 μg·l–1 in Welala, whereas the average gross primary production over three seasons was 10.5 in Shesher and 7.7 mg O2 l–1·d–1 in Welala. The peak concentra- tion of chlorophyll a was observed in the pre-rainy season, which coincided with a bloom of Microcystis spp. Both Shesher and Welala Wetlands are very productive and have a good water quality but they are threatened by low water inputs since in the summer of 2009 the construction of a dam by local people and facilitated by local officials prevented overflow from Ribb River into the Wetlands. We conclude that the good water quality, the relative high water tempera- ture and high primary productivity make the two Wetlands suitable for culture based fisheries and/or aquaculture, but a wise water resource management is crucially important. Keywords: Biodiversity; Phytoplankton Biomass; Spatial and Temporal Dynamics; Water Resource Management; Wise Use; Fogera Floodplain 1. Introduction Temporal variability in the structure and function of phy- toplankton communities is of fundamental importance to the metabolism of an aquatic system [1]. Aquatic envi- ronments are subject to high temporal variability, with frequent reorganization of the relative abundance and species composition of phytoplankton as a result of the interactions between physical, chemical and biological variables [2]. In floodplain Wetlands, there are additional factors owing to the hydrodynamic differences arising from the location, morphometry and the main function of a given system. The hydrological cycle, which determin- es precipitation, governs the flooding extent and the wa- ter retention times in the system, generates pulses of ma- terials and nutrients. The study of changes in phytoplan- kton densities, biomass, species composition and primary production is, therefore, fundamental to the understand- ing of water quality [3]. Furthermore, fish yields depend on the primary production of phytoplankton, particularly in water bodies in which fish fauna is primarily com- posed of planktivorous species such as tilapia [4]. A large number of studies have been made on the com- munity structure and primary production of phytoplank- ton in various East African Lakes and reservoirs [5], however, seasonal floodplain reservoirs were rarely stud- ied. This is also true for Ethiopia. The Shesher and Welala Wetlands are highly exposed to degradation because of unsustainable farming activi- ties by local farmers such as drainage for recession agri- culture [6]. The largest potential threat, however, is a *Corresponding author. C opyright © 2012 SciRes. JWARP 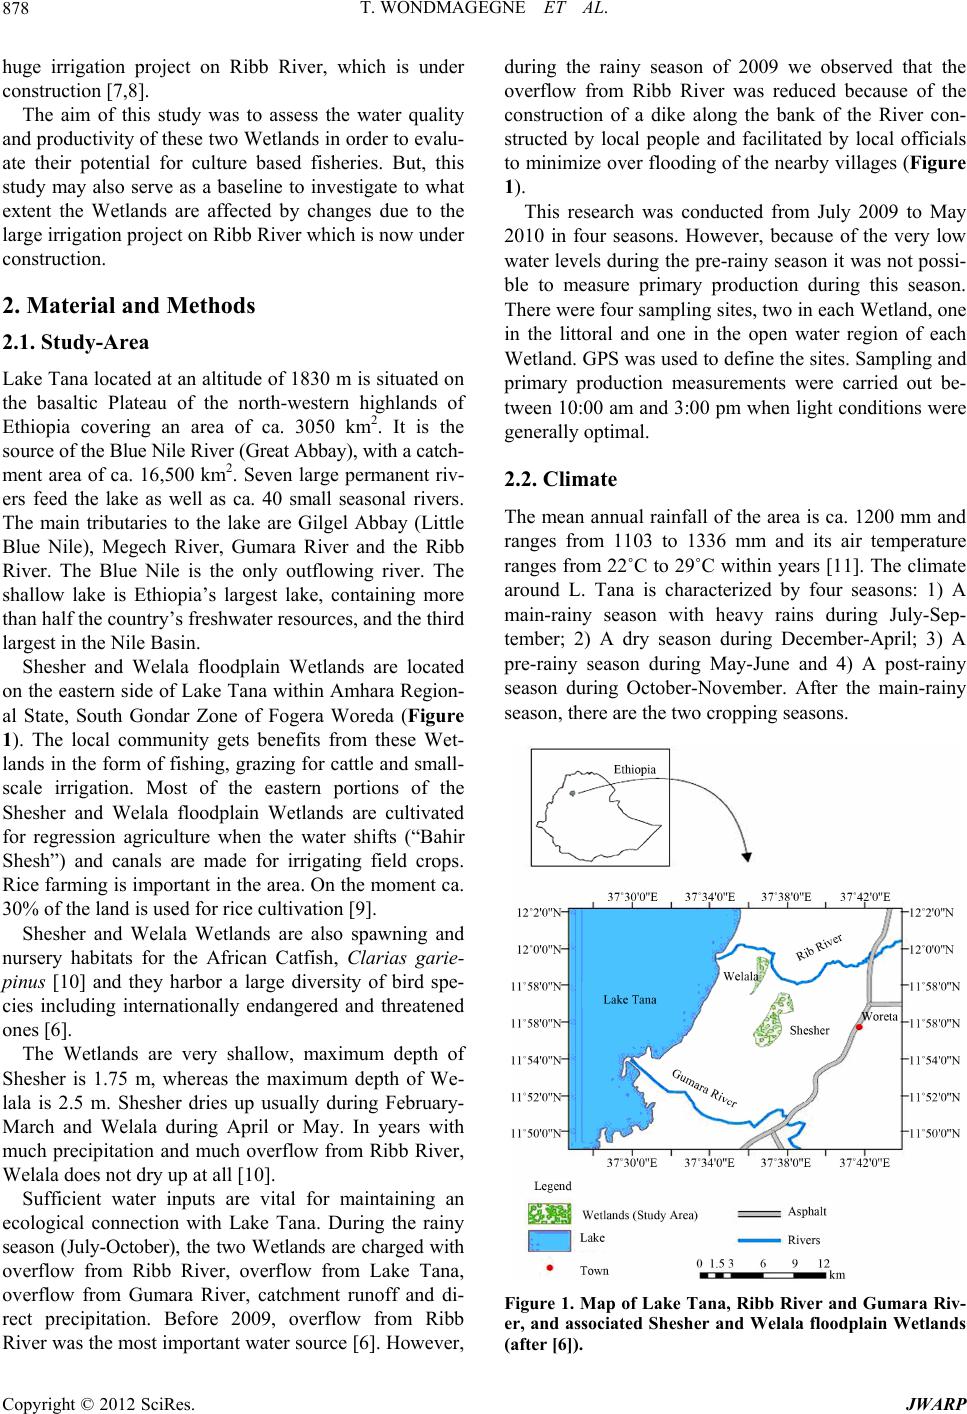 T. WONDMAGEGNE ET AL. 878 huge irrigation project on Ribb River, which is under construction [7,8]. The aim of this study was to assess the water quality and productivity of these two Wetlands in order to evalu- ate their potential for culture based fisheries. But, this study may also serve as a baseline to investigate to what extent the Wetlands are affected by changes due to the large irrigation project on Ribb River which is now under construction. 2. Material and Methods 2.1. Study-Area Lake Tana located at an altitude of 1830 m is situated on the basaltic Plateau of the north-western highlands of Ethiopia covering an area of ca. 3050 km2. It is the source of the Blue Nile River (Great Abbay), with a catch- ment area of ca. 16,500 km2. Seven large permanent riv- ers feed the lake as well as ca. 40 small seasonal rivers. The main tributaries to the lake are Gilgel Abbay (Little Blue Nile), Megech River, Gumara River and the Ribb River. The Blue Nile is the only outflowing river. The shallow lake is Ethiopia’s largest lake, containing more than half the country’s freshwater resources, and the third largest in the Nile Basin. Shesher and Welala floodplain Wetlands are located on the eastern side of Lake Tana within Amhara Region- al State, South Gondar Zone of Fogera Woreda (Figure 1). The local community gets benefits from these Wet- lands in the form of fishing, grazing for cattle and small- scale irrigation. Most of the eastern portions of the Shesher and Welala floodplain Wetlands are cultivated for regression agriculture when the water shifts (“Bahir Shesh”) and canals are made for irrigating field crops. Rice farming is important in the area. On the moment ca. 30% of the land is used for rice cultivation [9]. Shesher and Welala Wetlands are also spawning and nursery habitats for the African Catfish, Clarias garie- pinus [10] and they harbor a large diversity of bird spe- cies including internationally endangered and threatened ones [6]. The Wetlands are very shallow, maximum depth of Shesher is 1.75 m, whereas the maximum depth of We- lala is 2.5 m. Shesher dries up usually during February- March and Welala during April or May. In years with much precipitation and much overflow from Ribb River, Welala does not dry up at all [10]. Sufficient water inputs are vital for maintaining an ecological connection with Lake Tana. During the rainy season (July-October), the two Wetlands are charged with overflow from Ribb River, overflow from Lake Tana, overflow from Gumara River, catchment runoff and di- rect precipitation. Before 2009, overflow from Ribb River was the most important water source [6]. However, during the rainy season of 2009 we observed that the overflow from Ribb River was reduced because of the construction of a dike along the bank of the River con- structed by local people and facilitated by local officials to minimize over flooding of the nearby villages (Figure 1). This research was conducted from July 2009 to May 2010 in four seasons. However, because of the very low water levels during the pre-rainy season it was not possi- ble to measure primary production during this season. There were four sampling sites, two in each Wetland, one in the littoral and one in the open water region of each Wetland. GPS was used to define the sites. Sampling and primary production measurements were carried out be- tween 10:00 am and 3:00 pm when light conditions were generally optimal. 2.2. Climate The mean annual rainfall of the area is ca. 1200 mm and ranges from 1103 to 1336 mm and its air temperature ranges from 22˚C to 29˚C within years [11]. The climate around L. Tana is characterized by four seasons: 1) A main-rainy season with heavy rains during July-Sep- tember; 2) A dry season during December-April; 3) A pre-rainy season during May-June and 4) A post-rainy season during October-November. After the main-rainy season, there are the two cropping seasons. Figure 1. Map of Lake Tana, Ribb River and Gumara Riv- er, and associated Shesher and Welala floodplain Wetlands (after [6]). Copyright © 2012 SciRes. JWARP  T. WONDMAGEGNE ET AL. 879 2.3. Physico-Chemical Parameters Temperature and dissolved oxygen (DO) were measured with a portable oxymeter probe (OXY-315 WTW 8262), whereas pH, total dissolved solids (TDS) and conduc- tivity were measured simultaneously with the portable probe Syberscan PC 300. Transparency of the pond was measured with a standard Secchi-disc of 20 cm diameter. Major nutrients (nitrate, phosphate, silicate) were meas- ured using Hach portable spectrophotometer (Hach kit, DR/2010). Nutrient analyses were made from water sam- ples filtered through Whatman GF/C filters. Concentra- tions were measured in the field immediately after col- lecting the samples. 2.4. Phytoplankton Sampling At each sampling site, the phytoplankton community was sampled with a Van Dorn water sampler at different dep- ths. Subsamples from different depths, representing equal volumes, were pooled. These depth-integrated samples were preserved with lugol solution and 100 ml was al- lowed to settle in graduate cylinder overnight and the supernatant was siphoned off till 10 ml remained. Of this concentrated sample, 1 ml was used in a Sedgwick-Raf- ter Cell of which 100 microscopic field were counted for major species according to [12], using an Olympus com- pound microscope (100×). Identification was predomi- nantly based on [13]. 2.5. Chlorophyll a and Primary Production Chlorophyll a concentrations were measured once per season in littoral and open water. From each site, 250 - 500 ml of the pondwater was filtered through Whatman GF/C filters. The filters were folded with alluminium foil, labeled and transported to the laboratory in an ice box which was stored not more than one day. Pigments were grinded and extracted in 90% acetone. After grinding, the algal material was centrifuged. Then, the extract was decanted into 5 ml cuvette and the absorbance of chlo- rophyll a was measured spectrophotometrically at wave- lengths 665 and 750 nm before and after acidification. The concentrations were calculated according to [12]. Primary production was measured once per season in the open water zone of each Wetland using the light-dark bottles technique (Winkler’s method) with 3 h incubation during midday (10:30 am - 2:30 pm). Bottles were sus- pended at a depth of 15 - 30 cm, measured from the top of the bottle to the water surface. After incubation, the contents were fixed immediately with Winkler’s reagents. Thereafter, they were acidified and thoroughly mixed before titration in the laboratory 3 - 4 h after collection. Calculations of gross and net photosynthetic rates and respiration rates were done based on the change in oxy- gen concentration between initial (I), light (L) and dark (D) bottles. Gross primary productivity (GPP) = (L-D)/3 h = mg O2 l–1·h–1, net primary productivity (NPP) = (L-I)/3 h = mg O2 l–1·h–1 and respiration rate (R) = (I-D)/3 h = mg O2 l –1·h–1 [12]. The results were extrapolated into daily production per sampling date using a day length of 10 hrs [14]. 2.6. Data Analysis Physico-chemical parameters and phytoplankton compo- sition were measured monthly (eleven sampling dates), chlorophyll a content once per season (four sampling dates) and primary production during 3 seasons only (three sampling dates). At each sampling date, physico- chemical parameters, phytoplankton composition and chlorophyll a content were measured at four permanent sites, two in each Wetland, one in the littoral and one in the open water region of each Wetland (four samples per sampling date). Primary production was only measured in the open water region of each Wetland (two samples per sampling date). For data analyses, the SPSS version 16.0 was used [15]. To evaluate the significance of spa- tial and temporal variations of physico-chemical pa- rameters the Kruskal-Wallis test was performed. Spear- man bivariate correlation analysis was done to relate phytoplankton densities to physico-chemical parameters. 3. Results 3.1. Physico-Chemical Parameters Within each Wetland physico-chemical parameters did not show significant spatial variation between pelagic and littoral sites (Kruskal Wallis test; p > 0.05), but tem- perature, dissolved oxygen, transparency and conductive- ity showed significant differences among seasons (Kruskal Wallis test; p < 0.01) (Table 1). Especially seasonal dif- ferences in conductivity were large, whereas dissolved oxygen ranged between 5.1 and 11.4 and 4.4 - 7.8 mg·l–1 in Shesher and Welala, respectively. Transparency was found to be very low with lowest values during the main rainy season and highest values during the post-rainy se- ason. Average water temperatures varied between 22.0˚C and 27.2˚C, Welala being slightly warmer than Shesher. Dissolved nitrate, phosphate and silicate concentra- tions varied seasonally (p < 0.05). Generally, concentra- tions were highest during the main rainy season and low during the post-rainy season (Table 1). During the dry season, phosphate and silicate concentrations were also low, but the nitrate concentration was relatively high, whereas phosphate concentrations reached higher levels in the pre-rainy season. 3.2. Phytoplankton Composition, Abundance and Seasonality A total of 36 genera/species, belonging to 7 taxonomic Copyright © 2012 SciRes. JWARP 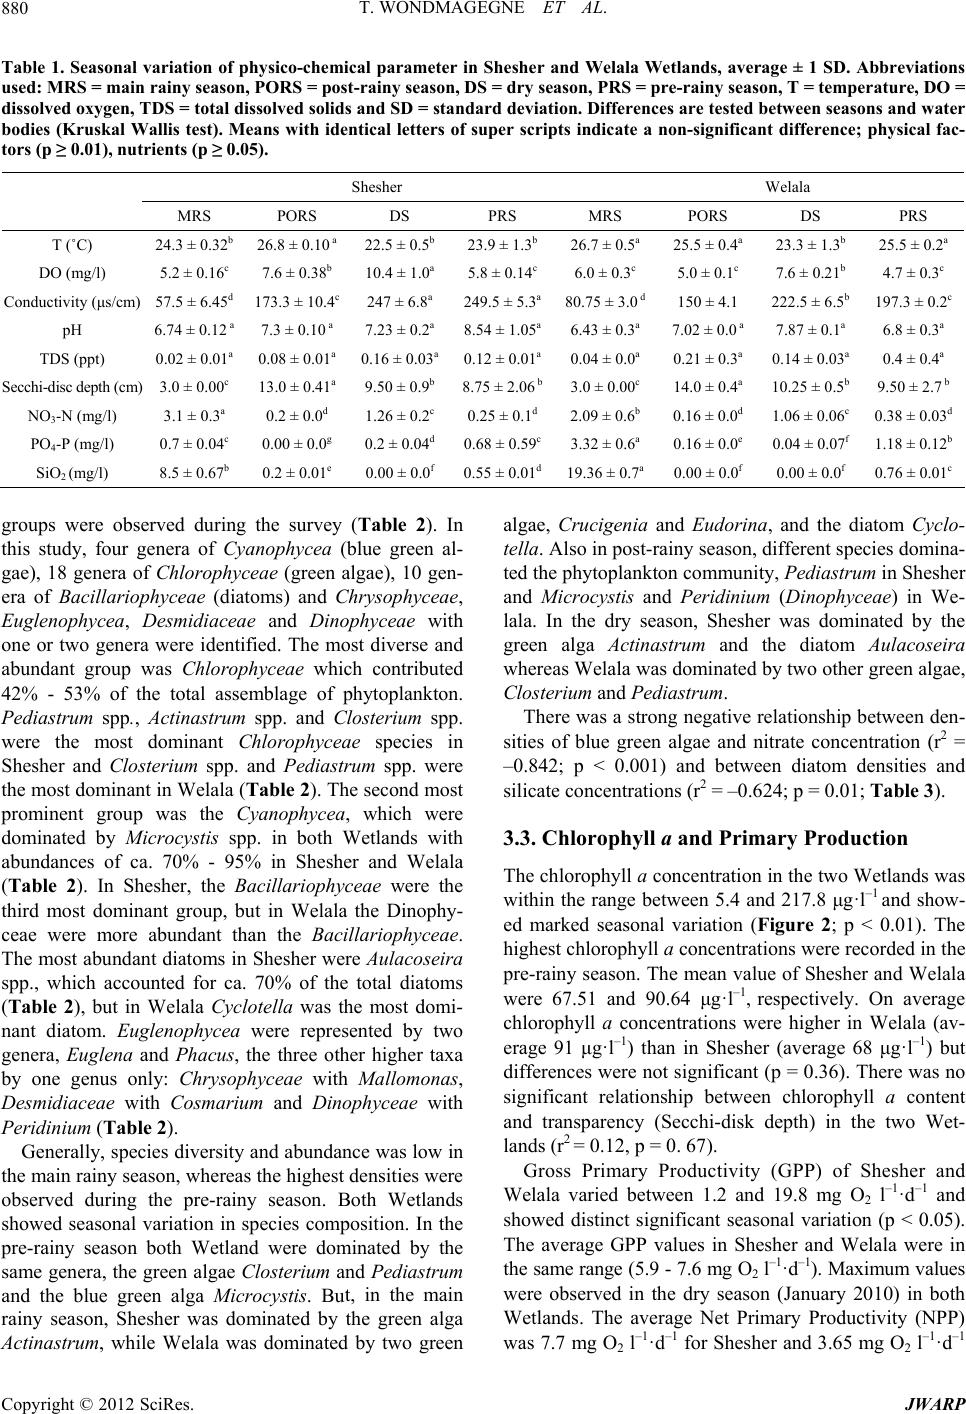 T. WONDMAGEGNE ET AL. Copyright © 2012 SciRes. JWARP 880 Table 1. Seasonal variation of physico-chemical parameter in Shesher and Welala Wetlands, average ± 1 SD. Abbreviations used: MRS = main rainy season, PORS = post-rainy season, DS = dry season, PRS = pre-rainy season, T = temperature, DO = dissolved oxygen, TDS = total dissolved solids and SD = standard deviation. Differences are tested between seasons and water bodies (Kruskal Wallis test). Means with identical letters of super scripts indicate a non-significant difference; physical fac- tors (p ≥ 0.01), nutrients (p ≥ 0.05). Shesher Welala MRS PORS DS PRS MRS PORS DS PRS T (˚C) 24.3 ± 0.32b 26.8 ± 0.10 a 22.5 ± 0.5b 23.9 ± 1.3b 26.7 ± 0.5a 25.5 ± 0.4a 23.3 ± 1.3b 25.5 ± 0.2a DO (mg/l) 5.2 ± 0.16c 7.6 ± 0.38b 10.4 ± 1.0a 5.8 ± 0.14c 6.0 ± 0.3c 5.0 ± 0.1c 7.6 ± 0.21b 4.7 ± 0.3c Conductivity (μs/cm) 57.5 ± 6.45d 173.3 ± 10.4c 247 ± 6.8a 249.5 ± 5.3a80.75 ± 3.0 d150 ± 4.1 222.5 ± 6.5b 197.3 ± 0.2c pH 6.74 ± 0.12 a 7.3 ± 0.10 a 7.23 ± 0.2a 8.54 ± 1.05a6.43 ± 0.3a 7.02 ± 0.0 a 7.87 ± 0.1a 6.8 ± 0.3a TDS (ppt) 0.02 ± 0.01a 0.08 ± 0.01a 0.16 ± 0.03a0.12 ± 0.01a0.04 ± 0.0a 0.21 ± 0.3a 0.14 ± 0.03a 0.4 ± 0.4a Secchi-disc depth (cm) 3.0 ± 0.00c 13.0 ± 0.41a 9.50 ± 0.9b 8.75 ± 2.06 b3.0 ± 0.00c 14.0 ± 0.4a 10.25 ± 0.5b 9.50 ± 2.7 b NO3-N (mg/l) 3.1 ± 0.3a 0.2 ± 0.0d 1.26 ± 0.2c 0.25 ± 0.1d 2.09 ± 0.6b 0.16 ± 0.0d 1.06 ± 0.06c 0.38 ± 0.03d PO4-P (mg/l) 0.7 ± 0.04c 0.00 ± 0.0g 0.2 ± 0.04d 0.68 ± 0.59c3.32 ± 0.6a 0.16 ± 0.0e 0.04 ± 0.07f 1.18 ± 0.12b SiO2 (mg/l) 8.5 ± 0.67b 0.2 ± 0.01e 0.00 ± 0.0f 0.55 ± 0.01d19.36 ± 0.7a0.00 ± 0.0f 0.00 ± 0.0f 0.76 ± 0.01c groups were observed during the survey (Table 2). In this study, four genera of Cyanophycea (blue green al- gae), 18 genera of Chlorophyceae (green algae), 10 gen- era of Bacillariophyceae (diatoms) and Chrysophyceae, Euglenophycea, Desmidiaceae and Dinophyceae with one or two genera were identified. The most diverse and abundant group was Chlorophyceae which contributed 42% - 53% of the total assemblage of phytoplankton. Pediastrum spp., Actinastrum spp. and Closterium spp. were the most dominant Chlorophyceae species in Shesher and Closterium spp. and Pediastrum spp. were the most dominant in Welala (Table 2). The second most prominent group was the Cyanophycea, which were dominated by Microcystis spp. in both Wetlands with abundances of ca. 70% - 95% in Shesher and Welala (Table 2). In Shesher, the Bacillariophyceae were the third most dominant group, but in Welala the Dinophy- ceae were more abundant than the Bacillariophyceae. The most abundant diatoms in Shesher were Aulacoseira spp., which accounted for ca. 70% of the total diatoms (Table 2), but in Welala Cyclotella was the most domi- nant diatom. Euglenophycea were represented by two genera, Euglena and Phacus, the three other higher taxa by one genus only: Chrysophyceae with Mallomonas, Desmidiaceae with Cosmarium and Dinophyceae with Peridinium (Table 2). Generally, species diversity and abundance was low in the main rainy season, whereas the highest densities were observed during the pre-rainy season. Both Wetlands showed seasonal variation in species composition. In the pre-rainy season both Wetland were dominated by the same genera, the green algae Closterium and Pediastrum and the blue green alga Microcystis. But, in the main rainy season, Shesher was dominated by the green alga Actinastrum, while Welala was dominated by two green algae, Crucigenia and Eudo rin a , and the diatom Cyclo- tella. Also in post-rainy season, different species domina- ted the phytoplankton community, Pediastrum in Shesher and Microcystis and Peridinium (Dinophyceae) in We- lala. In the dry season, Shesher was dominated by the green alga Actinastrum and the diatom Aulacoseira whereas Welala was dominated by two other green algae, Closterium and Pediastrum. There was a strong negative relationship between den- sities of blue green algae and nitrate concentration (r2 = –0.842; p < 0.001) and between diatom densities and silicate concentrations (r2 = –0.624; p = 0.01; Table 3). 3.3. Chlorophyll a and Primary Production The chlorophyll a concentration in the two Wetlands was within the range between 5.4 and 217.8 μg·l–1 and show- ed marked seasonal variation (Figure 2; p < 0.01). The highest chlorophyll a concentrations were recorded in the pre-rainy season. The mean value of Shesher and Welala were 67.51 and 90.64 μg·l–1, respectively. On average chlorophyll a concentrations were higher in Welala (av- erage 91 μg·l–1) than in Shesher (average 68 μg·l–1) but differences were not significant (p = 0.36). There was no significant relationship between chlorophyll a content and transparency (Secchi-disk depth) in the two Wet- lands (r2 = 0.12, p = 0. 67). Gross Primary Productivity (GPP) of Shesher and Welala varied between 1.2 and 19.8 mg O2 l –1·d–1 and showed distinct significant seasonal variation (p < 0.05). The average GPP values in Shesher and Welala were in the same range (5.9 - 7.6 mg O2 l–1·d–1). Maximum values were observed in the dry season (January 2010) in both Wetlands. The average Net Primary Productivity (NPP) was 7.7 mg O2 l–1·d–1 for Sheher and 3.65 mg O2 l–1·d–1 s  T. WONDMAGEGNE ET AL. 881 Table 2. Taxa of phytoplankton identified in Shesher and Welala Wetlands and their average abundance (%) during the study period. Presence/absence in Lake Tana according to [17]. Taxa Genera/species Abundance Shesher (%)Abundance Welala (%) Presence/Absence Lake Tana Cyanobacteria Anabaena sp. 2.13 1.35 – Microcystis sp. 16.01 25.35 + Oscillatoria sp. 3.55 0.11 – (Cyanophyceae) Phormidium sp. 1.51 0.00 – Chlorophyceae Actinastrum sp. 13.77 3.20 + Ankistrodesmus sp. 1.13 0.19 + Chlamydomonas sp. 0.05 0.00 + Closterium sp. 5.82 20.44 + Coelastrum sp. 0.12 0.30 + Crucigenia sp. 0.18 3.49 – Eudorina sp. 2.35 3.32 – Kirchneriella sp. 1.92 0.02 – Monoraphidium sp. 0.12 0.10 + Oocystis sp. 0.48 0.11 + Pandorina sp. 0.52 0.17 – Pediastrum sp. 21.98 8.1 + Scenedesmus sp. 1.91 0.74 + Schroederia sp. 0.05 0.38 + Sphaerocystis sp. 0.00 0.69 + Staurastrum sp. 1.81 0.77 + Volvox sp. 0.70 0.42 + Bacillariophyceae Aulacoseira sp. 13.86 1.92 + Cyclotella sp. 0.83 3.73 - Cymatopleura sp. 0.07 0.08 + Cymbella sp. 0.00 0.35 + Navicula sp 0.82 0.22 – Nitzschia sp. 2.93 1.09 + Pinnularia sp. 0.02 0 + Surirella sp. 0.00 0.02 + Synedra sp. 0.46 0.43 + Tabellaria sp. 0.06 0.02 + Chrysophyceae Mallomonas sp. 0.30 0.46 + Desmidiaceae Cosmarium sp. 0.00 0.29 – Dinophyceae Peridinium sp. 0.78 19.90 + Euglenophyceae Euglena sp. 3.05 1.88 + Phacus sp. 0.69 0.33 + Copyright © 2012 SciRes. JWARP 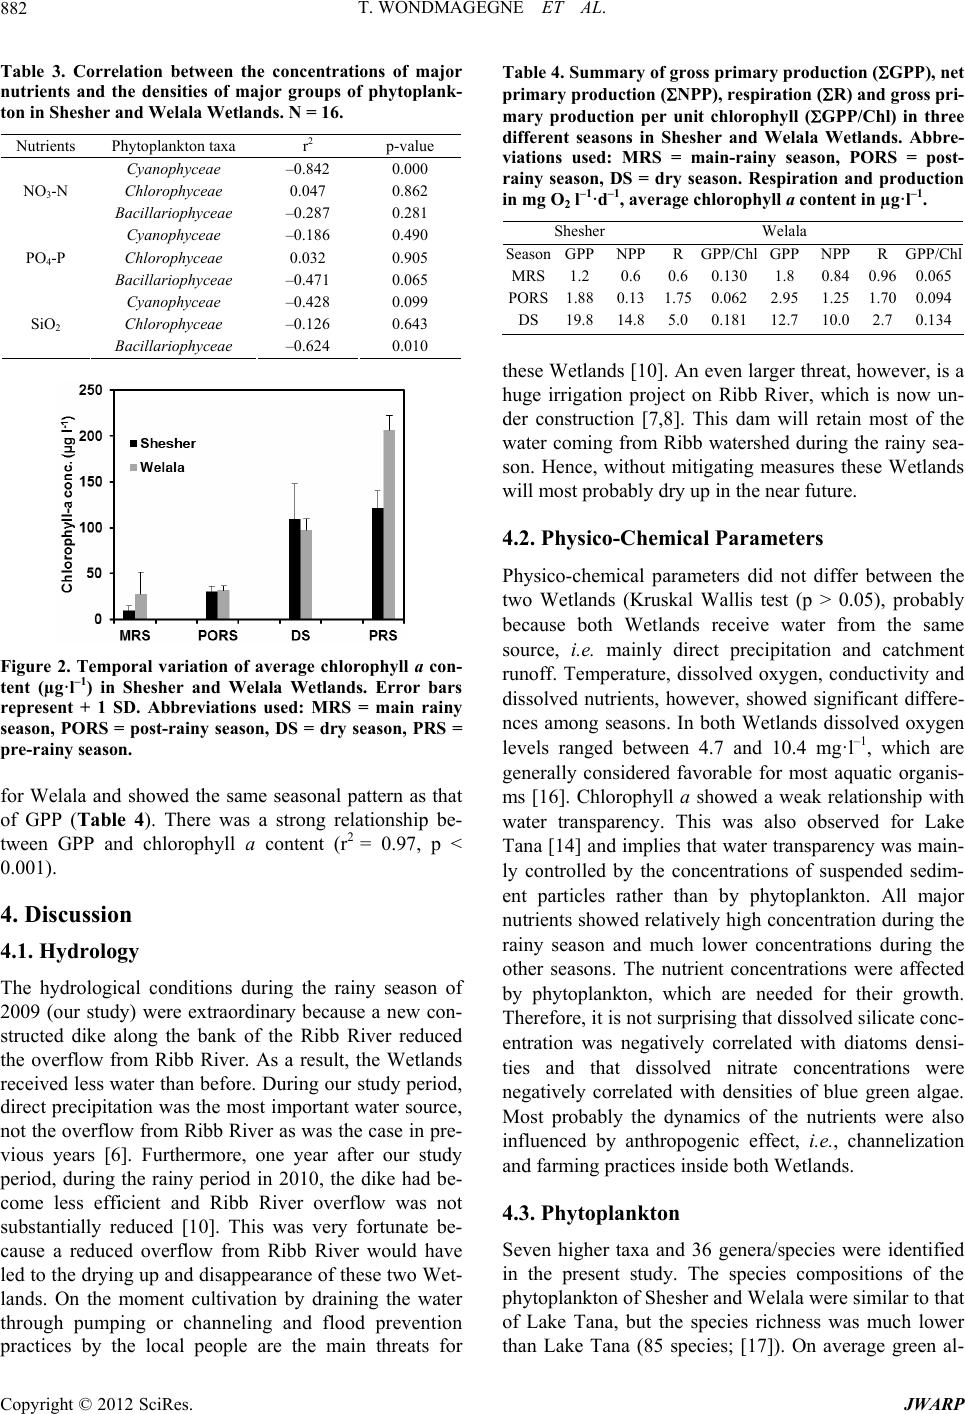 T. WONDMAGEGNE ET AL. 882 Table 3. Correlation between the concentrations of major nutrients and the densities of major groups of phytoplank- ton in Shesher and Welala Wetlands. N = 16. Nutrients Phytoplankton taxa r2 p-value Cyanophyceae –0.842 0.000 Chlorophyceae 0.047 0.862 NO3-N Bacillariophyceae –0.287 0.281 Cyanophyceae –0.186 0.490 Chlorophyceae 0.032 0.905 PO4-P Bacillariophyceae –0.471 0.065 Cyanophyceae –0.428 0.099 Chlorophyceae –0.126 0.643 SiO2 Bacillariophyceae –0.624 0.010 Figure 2. Temporal variation of average chlorophyll a con- tent (µg·l–1) in Shesher and Welala Wetlands. Error bars represent + 1 SD. Abbreviations used: MRS = main rainy season, PORS = post-rainy season, DS = dry season, PRS = pre-rainy season. for Welala and showed the same seasonal pattern as that of GPP (Table 4). There was a strong relationship be- tween GPP and chlorophyll a content (r2 = 0.97, p < 0.001). 4. Discussion 4.1. Hydrology The hydrological conditions during the rainy season of 2009 (our study) were extraordinary because a new con- structed dike along the bank of the Ribb River reduced the overflow from Ribb River. As a result, the Wetlands received less water than before. During our study period, direct precipitation was the most important water source, not the overflow from Ribb River as was the case in pre- vious years [6]. Furthermore, one year after our study period, during the rainy period in 2010, the dike had be- come less efficient and Ribb River overflow was not substantially reduced [10]. This was very fortunate be- cause a reduced overflow from Ribb River would have led to the drying up and disappearance of these two Wet- lands. On the moment cultivation by draining the water through pumping or channeling and flood prevention practices by the local people are the main threats for Table 4. Summary of gross primary production (GPP), net primary production (NPP), respiration (R) and gross pri- mary production per unit chlorophyll (GPP/Chl) in three different seasons in Shesher and Welala Wetlands. Abbre- viations used: MRS = main-rainy season, PORS = post- rainy season, DS = dry season. Respiration and production in mg O2 l–1·d–1, average chlorophyll a content in µg·l–1. Shesher Welala SeasonGPPNPPR GPP/Chl GPP NPP R GPP/Chl MRS1.20.6 0.60.130 1.8 0.84 0.960.065 PORS1.88 0.131.750.062 2.95 1.25 1.700.094 DS19.8 14.8 5.0 0.181 12.7 10.0 2.7 0.134 these Wetlands [10]. An even larger threat, however, is a huge irrigation project on Ribb River, which is now un- der construction [7,8]. This dam will retain most of the water coming from Ribb watershed during the rainy sea- son. Hence, without mitigating measures these Wetlands will most probably dry up in the near future. 4.2. Physico-Chemical Parameters Physico-chemical parameters did not differ between the two Wetlands (Kruskal Wallis test (p > 0.05), probably because both Wetlands receive water from the same source, i.e. mainly direct precipitation and catchment runoff. Temperature, dissolved oxygen, conductivity and dissolved nutrients, however, showed significant differe- nces among seasons. In both Wetlands dissolved oxygen levels ranged between 4.7 and 10.4 mg·l–1, which are generally considered favorable for most aquatic organis- ms [16]. Chlorophyll a showed a weak relationship with water transparency. This was also observed for Lake Tana [14] and implies that water transparency was main- ly controlled by the concentrations of suspended sedim- ent particles rather than by phytoplankton. All major nutrients showed relatively high concentration during the rainy season and much lower concentrations during the other seasons. The nutrient concentrations were affected by phytoplankton, which are needed for their growth. Therefore, it is not surprising that dissolved silicate conc- entration was negatively correlated with diatoms densi- ties and that dissolved nitrate concentrations were negatively correlated with densities of blue green algae. Most probably the dynamics of the nutrients were also influenced by anthropogenic effect, i.e., channelization and farming practices inside both Wetlands. 4.3. Phytoplankton Seven higher taxa and 36 genera/species were identified in the present study. The species compositions of the phytoplankton of Shesher and Welala were similar to that of Lake Tana, but the species richness was much lower than Lake Tana (85 species; [17]). On average green al- Copyright © 2012 SciRes. JWARP 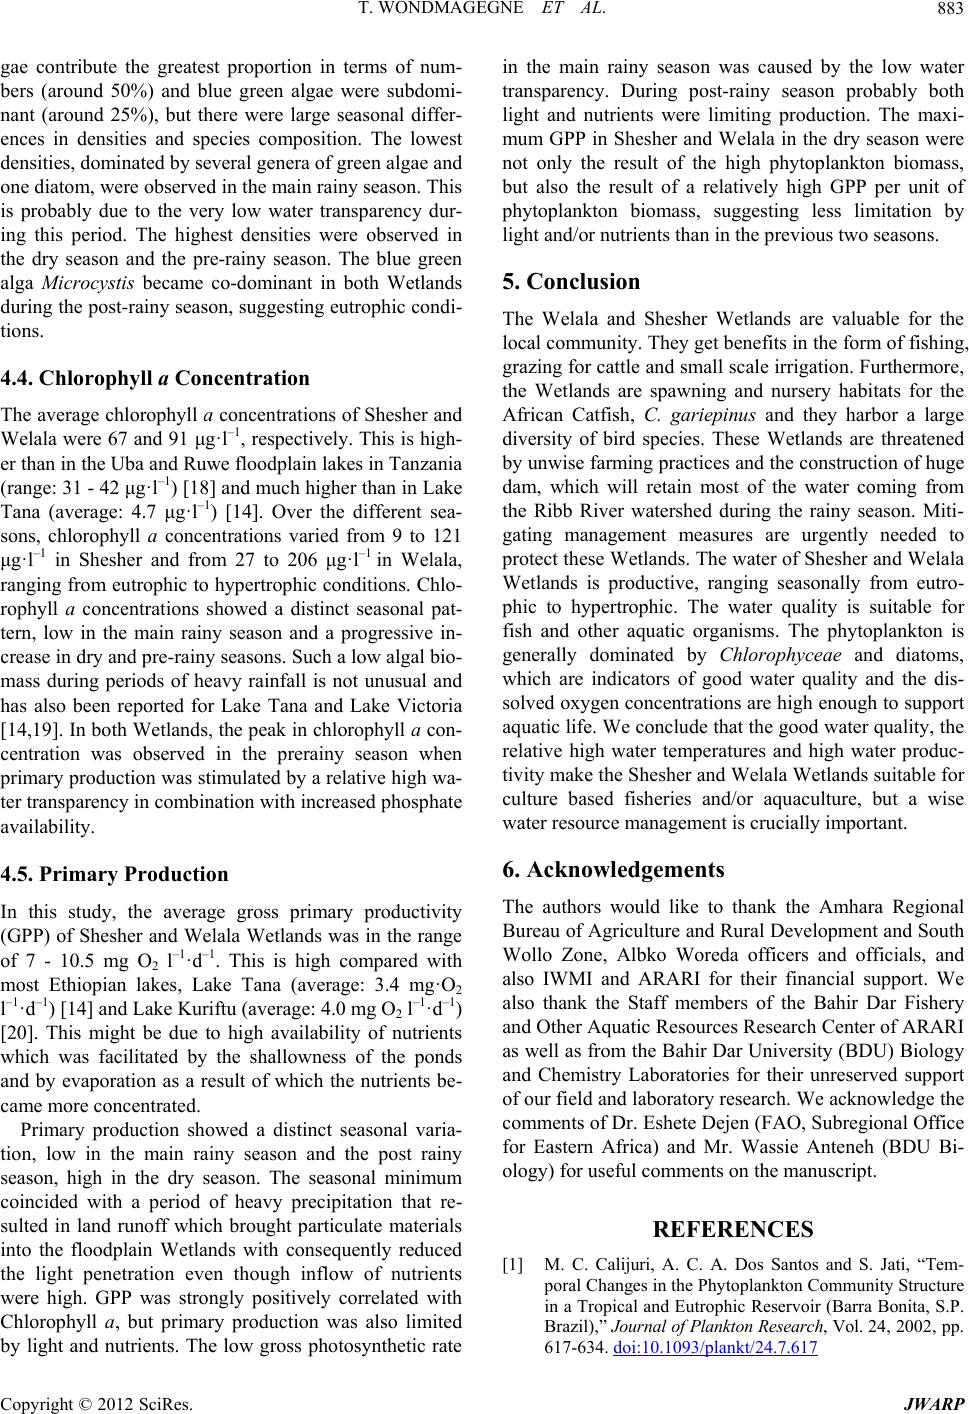 T. WONDMAGEGNE ET AL. 883 gae contribute the greatest proportion in terms of num- bers (around 50%) and blue green algae were subdomi- nant (around 25%), but there were large seasonal differ- ences in densities and species composition. The lowest densities, dominated by several genera of green algae and one diatom, were observed in the main rainy season. This is probably due to the very low water transparency dur- ing this period. The highest densities were observed in the dry season and the pre-rainy season. The blue green alga Microcystis became co-dominant in both Wetlands during the post-rainy season, suggesting eutrophic condi- tions. 4.4. Chlorophyll a Concentration The average chlorophyll a concentrations of Shesher and Welala were 67 and 91 μg·l–1, respectively. This is high- er than in the Uba and Ruwe floodplain lakes in Tanzania (range: 31 - 42 μg·l–1) [18] and much higher than in Lake Tana (average: 4.7 μg·l–1) [14]. Over the different sea- sons, chlorophyll a concentrations varied from 9 to 121 μg·l–1 in Shesher and from 27 to 206 μg·l–1 in Welala, ranging from eutrophic to hypertrophic conditions. Chlo- rophyll a concentrations showed a distinct seasonal pat- tern, low in the main rainy season and a progressive in- crease in dry and pre-rainy seasons. Such a low algal bio- mass during periods of heavy rainfall is not unusual and has also been reported for Lake Tana and Lake Victoria [14,19]. In both Wetlands, the peak in chlorophyll a con- centration was observed in the prerainy season when primary production was stimulated by a relative high wa- ter transparency in combination with increased phosphate availability. 4.5. Primary Production In this study, the average gross primary productivity (GPP) of Shesher and Welala Wetlands was in the range of 7 - 10.5 mg O2 l –1·d–1. This is high compared with most Ethiopian lakes, Lake Tana (average: 3.4 mg·O2 l–1·d–1) [14] and Lake Kuriftu (average: 4.0 mg O2 l–1·d–1) [20]. This might be due to high availability of nutrients which was facilitated by the shallowness of the ponds and by evaporation as a result of which the nutrients be- came more concentrated. Primary production showed a distinct seasonal varia- tion, low in the main rainy season and the post rainy season, high in the dry season. The seasonal minimum coincided with a period of heavy precipitation that re- sulted in land runoff which brought particulate materials into the floodplain Wetlands with consequently reduced the light penetration even though inflow of nutrients were high. GPP was strongly positively correlated with Chlorophyll a, but primary production was also limited by light and nutrients. The low gross photosynthetic rate in the main rainy season was caused by the low water transparency. During post-rainy season probably both light and nutrients were limiting production. The maxi- mum GPP in Shesher and Welala in the dry season were not only the result of the high phytoplankton biomass, but also the result of a relatively high GPP per unit of phytoplankton biomass, suggesting less limitation by light and/or nutrients than in the previous two seasons. 5. Conclusion The Welala and Shesher Wetlands are valuable for the local community. They get benefits in the form of fishing, grazing for cattle and small scale irrigation. Furthermore, the Wetlands are spawning and nursery habitats for the African Catfish, C. gariepinus and they harbor a large diversity of bird species. These Wetlands are threatened by unwise farming practices and the construction of huge dam, which will retain most of the water coming from the Ribb River watershed during the rainy season. Miti- gating management measures are urgently needed to protect these Wetlands. The water of Shesher and Welala Wetlands is productive, ranging seasonally from eutro- phic to hypertrophic. The water quality is suitable for fish and other aquatic organisms. The phytoplankton is generally dominated by Chlorophyceae and diatoms, which are indicators of good water quality and the dis- solved oxygen concentrations are high enough to support aquatic life. We conclude that the good water quality, the relative high water temperatures and high water produc- tivity make the Shesher and Welala Wetlands suitable for culture based fisheries and/or aquaculture, but a wise water resource management is crucially important. 6. Acknowledgements The authors would like to thank the Amhara Regional Bureau of Agriculture and Rural Development and South Wollo Zone, Albko Woreda officers and officials, and also IWMI and ARARI for their financial support. We also thank the Staff members of the Bahir Dar Fishery and Other Aquatic Resources Research Center of ARARI as well as from the Bahir Dar University (BDU) Biology and Chemistry Laboratories for their unreserved support of our field and laboratory research. We acknowledge the comments of Dr. Eshete Dejen (FAO, Subregional Office for Eastern Africa) and Mr. Wassie Anteneh (BDU Bi- ology) for useful comments on the manuscript. REFERENCES [1] M. C. Calijuri, A. C. A. Dos Santos and S. Jati, “Tem- poral Changes in the Phytoplankton Community Structure in a Tropical and Eutrophic Reservoir (Barra Bonita, S.P. Brazil),” Journal of Plankton Research, Vol. 24, 2002, pp. 617-634. doi:10.1093/plankt/24.7.617 Copyright © 2012 SciRes. JWARP  T. WONDMAGEGNE ET AL. Copyright © 2012 SciRes. JWARP 884 [2] C. S. Reynolds, “Temporal Scales of Variability in Pe- lagic Environments and the Response of Phytoplankton,” Freshwater Biology, Vol. 23, 1990, pp. 25-53. doi:10.1111/j.1365-2427.1990.tb00252.x [3] W. D. Taylor, E. Kebede and Z. Gebre-Mariam, “Primary and Secondary Production in the Pelagic Zone of Ethi- opian Rift Valley Lakes,” In: C. Tudorancea and W. D. Taylor, Eds., Ethiopian Rift Valley Lakes, Backhuys Pub- lishers, Leiden, 2002, pp. 95-108. [4] LFDP-Lake Fisheries Development Project, “Phase II. Final Report,” Ministry of Agriculture, Addis Ababa, 1998, pp. 16-20. [5] J. F. Talling and J. Lemoalle, “Ecological Dynamics of Tropical Inland Waters,” Cambridge University Press, Cambridge, 1998. [6] N. Atnafu, E. Dejen and J. Vijverberg, “Assessment of the Ecological Status and Threats of Welala and Shesher Wetlands, Lake Tana Sub-Basin (Ethiopia),” Journal of Water Resource and Protection, Vol. 3, No. 3, 2011, pp. 540-547. doi:10.4236/jwarp.2011.37064 [7] A. Getahun, E. Dejen and W. Anteneh, “Fishery Studies of Ribb River, Lake Tana Basin, Ethiopia,” Ethiopian Nile Irrigation and Drainage Project Coordination Office, Ministry of Water Resources, Final Report E1573, Vol. 2, Addis Ababa, 2008. [8] T. Alemayehu, M. McCartney and S. Kebede, “The Wa- ter Resource Implications of Planned Development in the Lake Tana Catchment, Ethiopia,” Ecohydrology and Hydro- biology, Vol. 10, No. 2-4, 2010, pp. 211-222. doi:10.2478/v10104-011-0023-6 [9] N. Atnafu, “Assessment of Ecological and Socio-Eco- nomic Importance of Fogera Floodplains: The Case of Welala and Shesher Wetlands,” MSc. Thesis, Bahir Dar University, Bahir Dar, 2010. [10] W. Anteneh, E. Dejen and A. Getahun, “Shesher and Welala Floodplain Wetlands (Lake Tana, Ethiopia): Are They Important Breeding Habitats for Clarias gariepinus and the Migratory Labeobarbus Fish Species?” The Sci- entific World Journal, Vol. 2012, 2012, Article ID: 298742. [11] B. Kibret, “In Situ Characterization of Local Chicken Eco-Type for Functional Traits and Production System in Fogera Woreda, Amhara Regional State,” MSc. Thesis, Haramaya University, Haramaya, 2008. [12] R. G. Wetzel and G. E. Likens, “Limnological Analysis,” 3rd Edition, Springer, NewDelhi, 2001. [13] G. W. Prescott, “Algae of the Western Lakes Area,” Re- vised Edition, WMC Brown Company Publishers, Du- buque, 1962. [14] A. Wondie, S. Mengistu, J. Vijverberg and E. Dejen, “Seasonal Variation in Primary Production of a Large High Altitude Tropical Lake (Lake Tana, Ethiopia): Ef- fects of Nutrient Availability and Water Transparency,” Aquatic Ecology, Vol. 41, No. 2, 2007, pp. 195-207. doi:10.1007/s10452-007-9080-8 [15] SPSS for Windows, “Statistical Package for Social Sci- ence (SPSS),” Release 13.0, The Apasche Software Foundation, 2007. [16] US Environmental Protection Agency (USEPA), “The Quality of Our Nation’s Water: A Summary of the 1988 National Water Quality Inventory,” EPA Report 440/4- 90-005, Washington DC, 1990. [17] A. Wondie, “Dynamics of the Major Phytoplankton and Zooplankton Communities and Its Role in the Food Web of Lake Tana, Ethiopia,” Ph.D Thesis, Addis Ababa Uni- versity, Addis Ababa, 2006. [18] S. M. Ramadhan, “Limnological Studies of Floodplain Lakes Ruwe and Uba, Rufiji River, Tanzania,” Institute for Water Education UNESCO-IHE, Delft, 2003. [19] H. B. O. Lungayia, L. Sitoki and M. Kenyanya, “The Nutrient Enrichment of Lake Victoria (Kenya Waters),” Hydrobiologia, Vol. 458, 2001, pp. 75-82. doi:10.1023/A:1013128027773 [20] Z. Dessalegn, “Temporal Dynamics of Biomass and Pri- mary Production of Phytoplankton in Relation to Some Phsico-Chemical Factors in Lake Koriftu, Ethiopia,” MSc. Thesis, Addis Ababa University, Addis Ababa, 2007.
|