Journal of Water Resource and Protection, 2012, 4, 842-846
http://dx.doi.org/10.4236/jwarp.2012.410097 Published Online October 2012 (http://www.SciRP.org/journal/jwarp)
Monitoring of Pesticides Residues in
Italian Mineral Waters by Solid Phase Extraction and
Gas Chromatography Mass Spectrometry
Anna Maria Tarola, Raffaella Preti
Department Management and Technologies, “Sapienza” University of Rome, Roma, Italy
Email: annamaria.tarola@uniroma1.it
Received March 2, 2012; revised May 8, 2012; accepted July 9, 2012
ABSTRACT
Twenty-two pesticides and metabolites, selected on the basis of regional priority lists, were surveyed in thirty Italian
mineral waters springs for three years by a procedure based on solid phase extraction in combination with gas chroma-
tography coupled with mass spectrometry detection. The procedure proved to be simple, sensitive and reliable, the lim-
its of detection and relative standard deviations were respectively in the range of 0.002 - 0.04 µg/L and 3% - 7%, re-
coveries ranged from 86% to 105% at the European Union Maximum Acceptable Concentration (MAC). Pesticide
residues were detected in just one of the ninety water samples analyzed but no one exceeding the MAC. These results
demonstrate the good quality of Italian mineral waters, not forgetting the need of constant revision and update of the
priority list of pollutants.
Keywords: Mineral Water, Pesticides, SPE, GC-MS
1. Introduction
The packaged waters sector is growing steadily over the
last few years. The worldwide consumption of packaged
waters can be estimated to be around 200 billion L in
2008, which means that the rate was 25 - 26 L/per capita/
year. Data in Table 1 show the world market of bottled
water in 2008 compared to 2003, with Italy being the
highest consumption (each citizen consumes 200 L/year).
Italian production of bottled water has increased by of
30% over the last 5 years. In Italy there are more than
three hundred brands of Italian bottled waters recognized
by the European Community, with 46% of bottled waters
being in Northern Italy while only 15% in the South [1].
In Italy pesticides consumption for agricultural use for
the 2008 was about 150 thousand tons, being the fungi-
cide class the most used (63.4%) followed by insecticide
and acaricide (10.5%). Almost half of the pesticides are
used in the Northern regions, the 12 percent in the central
the remaining in the Southern [2]. Several studies have
provided evidence that pesticides can be transferred rap-
idly at high concentrations beyond the root zone, there-
fore leaching of pesticides from agricultural soils may
threaten the quality of drinking water resources [3,4].
Generally, pesticide residue analysis is carried out fol-
lowing several steps, e.g. extraction from sample matrix,
clean up and final chromatographic separation and deter-
mination. Thus, environmental water samples cannot be
analysed without some preliminary sample preparation.
In this sense, liquid-liquid extraction (LLE) has been
employed for many years as the routine technique for the
extraction of pesticides from environmental water sam-
ples. However, LLE presents some disadvantages such as
being time-consuming and requiring consumption of
large amounts of organic solvents, so this technique has
been replaced by other methodologies such as SPE, solid
phase microextraction (SPME), stir bar sorptive extrac-
tion (SBSE) or liquid phase microextraction (LPME).
Despite the advantages of these microextraction tech-
niques, SPE is still widely accepted as the best technique
for isolating pesticide residues in water samples, because
it is fast, accurate, precise, consumes small volume of
organic solvent, does not involve costly material and a
wide range of selective sorbent materials are available.
The most widely used sorbents are C8 and C18 chemi-
cally bonded to silica, carbon black and polymeric resins.
The sensitivity of this technique can be increased in mi-
cropollutants from water and has now become the
method of choice in order to carry out simultaneously the
extraction and concentration of many pesticides and me-
tabolites in aqueous samples [5-7].
The most widely used methods for the analysis of pes-
ticides in water are based on GC and LC. Although con-
ventional detectors such as electron capture detection and
UV absorbance detection can be used, identification based
C
opyright © 2012 SciRes. JWARP
A. M. TAROLA, R. PRETI 843
Table 1. List of the pesticides studied.
Pesticide Type logKow* Chemical class Rt min MS ion LOD** μg/L Max. Limit*** μg/L
1-Molinate H 2.88 Thiocarbamate 11.14 1,265,583 0.005 0.05
2-Desethylatrazine H 1.49 Triazine 13.86 172,174,1870.005 0.05
3-Trifluralin H 5.27 Dinitroaniline 14.19 306,264,3070.002 0.05
4-Benfluralin H 5.29 Dinitroaniline 14.29 29,226,445 0.002 0.05
5-Desethyl-terbutilazine H 2.3 Triazine 14.3 186,188,201 0.002 0.05
6-Atrazine H 2.50 Triazine 16.06 200,202,2150.003 0.05
7-Propazine H 2.94 Triazine 16.27 214,216,2290.005 0.05
8-Lindane I-R 3.69 Organochlorine 16.47 181,183,2170.01 0.05
9-Terbuthylazine A-H-M 3.04 Triazine 16.78 214,216,1730.005 0.05
10-Diazinone I-A 3.30 Organophosphorus 17.42 179,137,1520.02 0.05
11-Chlorthalonil F 3.05 Substitued benzene 17.99 264,266,2680.003 0.05
12-Metil parathion I 2.86 Organophosphorus 19.88 109,125,2630.005 0.05
13-Alaclor H 2.63 Chloroacetoanilide 20.29 160,188,1460.002 0.05
14-Linuron H 3.00 Urea 21.56 61,248,250 0.005 0.05
15-Malathion I-A 2.75 Organophosphorus 22.10 127,125,1730.03 0.05
16-Pendimetalin H 5.18 Dinitroaniline 24.44 252,162,1920.002 0.05
17-Meditathion I-A 2.20 Organophosphorus 25.91 145,85,93 0.005 0.05
18-Oxadiazon H 4.80 Unclassified 27.90 175,177,2580.002 0.05
19-Oxadixyl F 1.40 Aniline 29.50 163,132,2330.002 0.05
20-Phosalone I-A 4.30 Organophosphorus 33.15 182,184,1210.005 0.05
21-Azinphos methyl I-A 2.96 Organophosphorus 33.18 77,160,132 0.04 0.05
22-Azinphos ethyl I-A 3.18 Organophosphorus 34.11 132,160,77 0.02 0.05
H = herbicide, I = insecticide, A = acaricide, M = microbiocide, R = rodenticide; *Values from Royal Society of Chemistry 1994; **LOD: limit of detection for
a signal-to-noise ratio S/N = 3; ***Maximum Acceptable Concentration (Dir. 2003/40/EC).
only on chromatographic analysis (retention time) with-
out the use of spectrometric detection is not suitable as
confirmatory method so MS detection has found to be
indispensable for high sensitivity and unambiguous de-
tection, confirmation and determination of such residues
in different matrices.
The main objective of this study is to determine the
occurrence of 22 selected pesticides in 90 mineral water
samples coming from three Italian regions, during a three
year period (2006-2008) in order to assess the actual im-
pact of the applied practices on the groundwater quality.
2. Materials and Methods
2.1. Sampling
Mineral water samples were collected in a three year
period from 2006 to 2008 in Pyrex borosilicate amber
glass (1L) capped with Teflon lined screw caps and
stored at 4˚C. The three sampling sites were in the fol-
lowing Italian regions: Emilia (North Italy) the first re-
gion for pesticides use in the country, with about 22
thousands tons and 40 springs of bottled mineral waters;
Toscana (Centre Italy) with more than 6.6 thousands tons
of pesticides used and 37 springs and Campania (South
Italy) where in 2008 were used nearly 10 thousands tons
of pesticides and has in its territory 18 springs.
Each year, during the summer season, in each region
ten wells were sampled, for a total of 90 samples col-
lected. Mineral water samples from Emilia and Toscana
had a TDS concentration < 500 mg/l, while those from
Campania had a TDS concentration > 500 mg/l and two
of them were naturally carbonated with an average CO2
content of 1900 mg/l.
2.2. Chemicals and Materials
Pesticide standards of analytical grade were purchased
from Riedel de Haen (Seelze, Germany), with a purity
>99%. Individual stock standard solution, containing 0.1
µg/ml of each pesticide were prepared in acetone and
stored at –20˚C. Working standard mixture solutions were
prepared by appropriate dilution with n-hexane and stor-
ed under refrigeration (4˚C).
Pesticide-quality solvents (n-hexane, acetone, metha-
nol, ethyl acetate) were supplied from J.T. Baker (De-
venter, The Netherlands). SPE extraction columns LC18
Copyright © 2012 SciRes. JWARP
A. M. TAROLA, R. PRETI
844
(500 mg, 6 ml) were purchased from Sigma Aldrich. Ul-
trapure water was obtained from a Milli-Q water system
(Millipore, Bedford, MA, USA). An extraction manifold
from Alltech (Alltech Associates, Deerfield, USA) was
used for the SPE analysis.
2.3. Instrumentation
GC-MS Separation and Determination
All analysis were performed with Finnigan Trace GC
ultra gas chromatograph coupled to a Finnigan Polaris Q
mass spectrometer (Thermo Electron Co., Austin, Texas).
Separations were conducted on a DB-5 ms fused-silica
column, 30 m × 0.25 mm × 0.25 µm film thickness
(J&W Scientific, Folsom, CA), with helium as carrier gas,
at a flow of 1.0 ml/min.
The column was held at 70˚C ramped 15˚C/min to
150˚C, then up to 200˚C at 3˚C/min and finally ramped at
8˚C/min to 300˚C and held for 5 minutes. A volume of 2
µl of sample extract was injected manually on a PTV
injector operating in splitless mode. The injector tem-
perature was set at 60˚C. The mass spectrometer operated
in the EI mode. The parameters were set at the following
values: an electron energy of 70 eV and a filament emis-
sion current of 200 µA. The interface and ion source tem-
peratures were maintained at 250˚C and 200˚C, respec-
tively. The scan mode was used between m/z 40 and 350.
2.4. Procedure
Samples of mineral water naturally carbonated were de-
gassed in an ultrasonic bath for 5 min.
Spe Procedure
The procedure followed the guidelines EPA Method n
525 [8]. SPE C18 cartridges were conditioned with 5 ml
of ethyl acetate, followed by 5 ml of methanol and 10 ml
of bidistillated water, without allowing the cartridge to
dry out. Then, 2.5 ml of methanol were added to 500 ml
of water sample that was passed through the conditioned
cartridges at a flow rate of approximately 8 ml/min under
vacuum. The cartridges were dried for 10 min under
vacuum and afterwards the analytes were eluted from the
solid phase with 5 ml of ethyl acetate, traces of water
were removed with anhydrous sodium sulphate. The elu-
ate was evaporated to dryness under a stream of nitrogen
and the residue was dissolved in 0.5 ml of n-hexane.
3. Results
The quality of water for human consumption has always
been and still is one of the most serious challenges. Since
the late decades, concern about the contamination of wa-
ter sources has risen due to the increasing number of pes-
ticides detected. Regulations for drinking water are re-
quired in order to limit human risks and environmental
pollution. These regulations are well defined in Europe,
setting at 0.05 µg/l of each pesticide concentration limit
in mineral water samples. Consequently, it becomes nec-
essary to provide control laboratories with analytical
methods allowing the monitoring of pesticide residues at
this trace level, with basic performance data in agreement
with the drinking water EC Directives 98/83 and 2003/40
requirements [9,10].
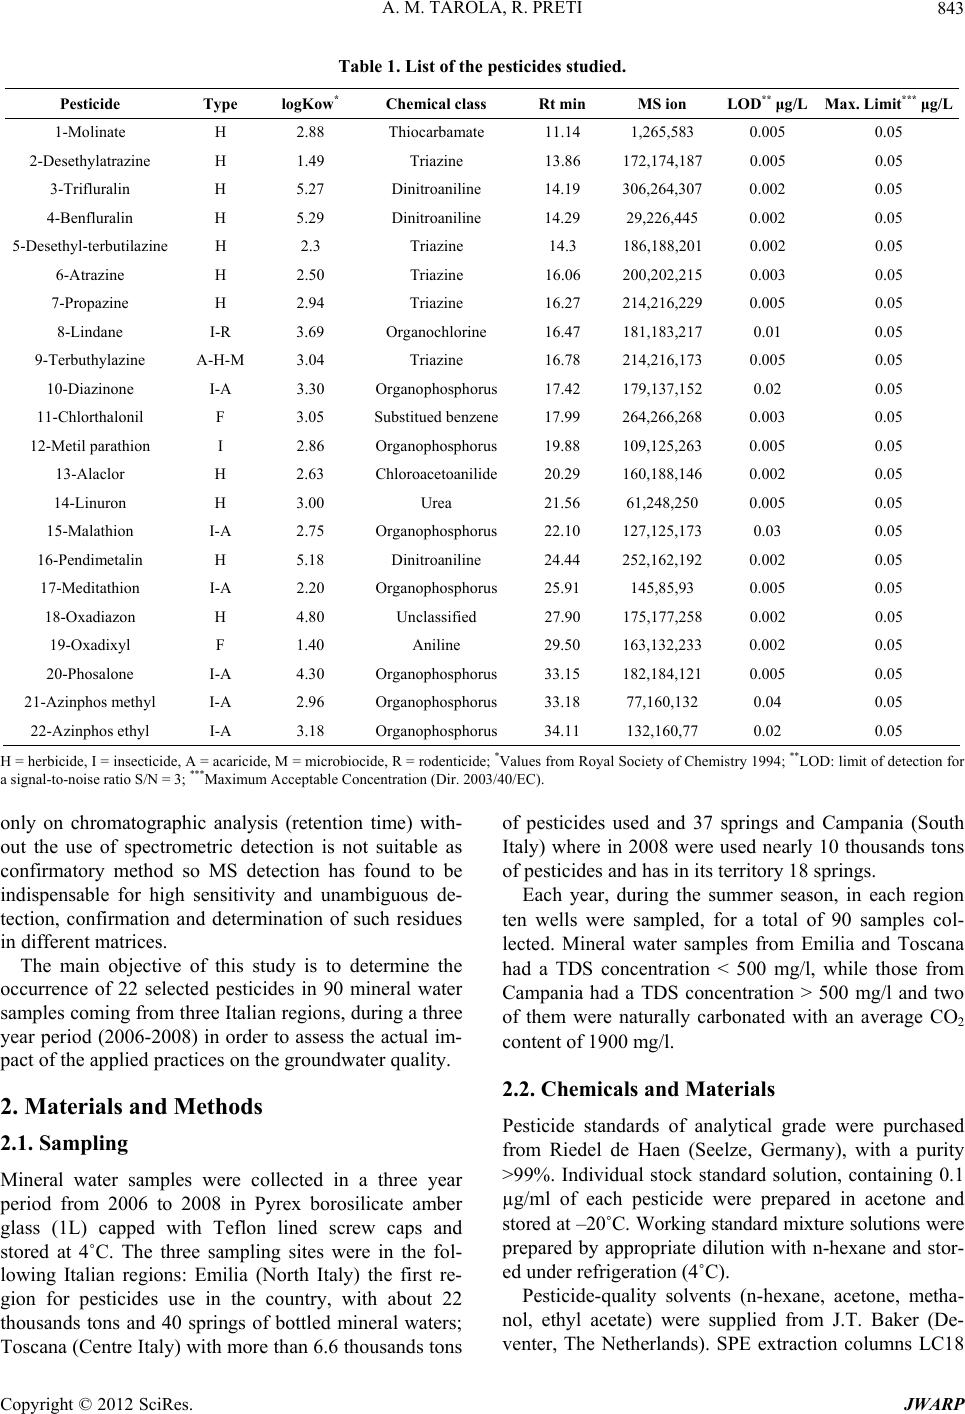
Pesticides used in agricultural practices are several,
therefore to ensure an effective quality control it is nec-
essary to develop a list of priority substances to be mon-
itored by the producers themselves who are obliged to
carry out annual controls by Italian law. The methodol-
ogy developed to generate the list of priority substances
is based on relevant factors, including for example sale
data, the target, their degradation, the environmental dis-
tribution, which results from many chemical characteris-
tics such as molecular weight, vapour pressure, solubility
in water and octanol/water partition coefficient (Kow).
The priority list, that includes the pesticides considered
in this study, is developed by the Italian Environmental
Protection Agency.
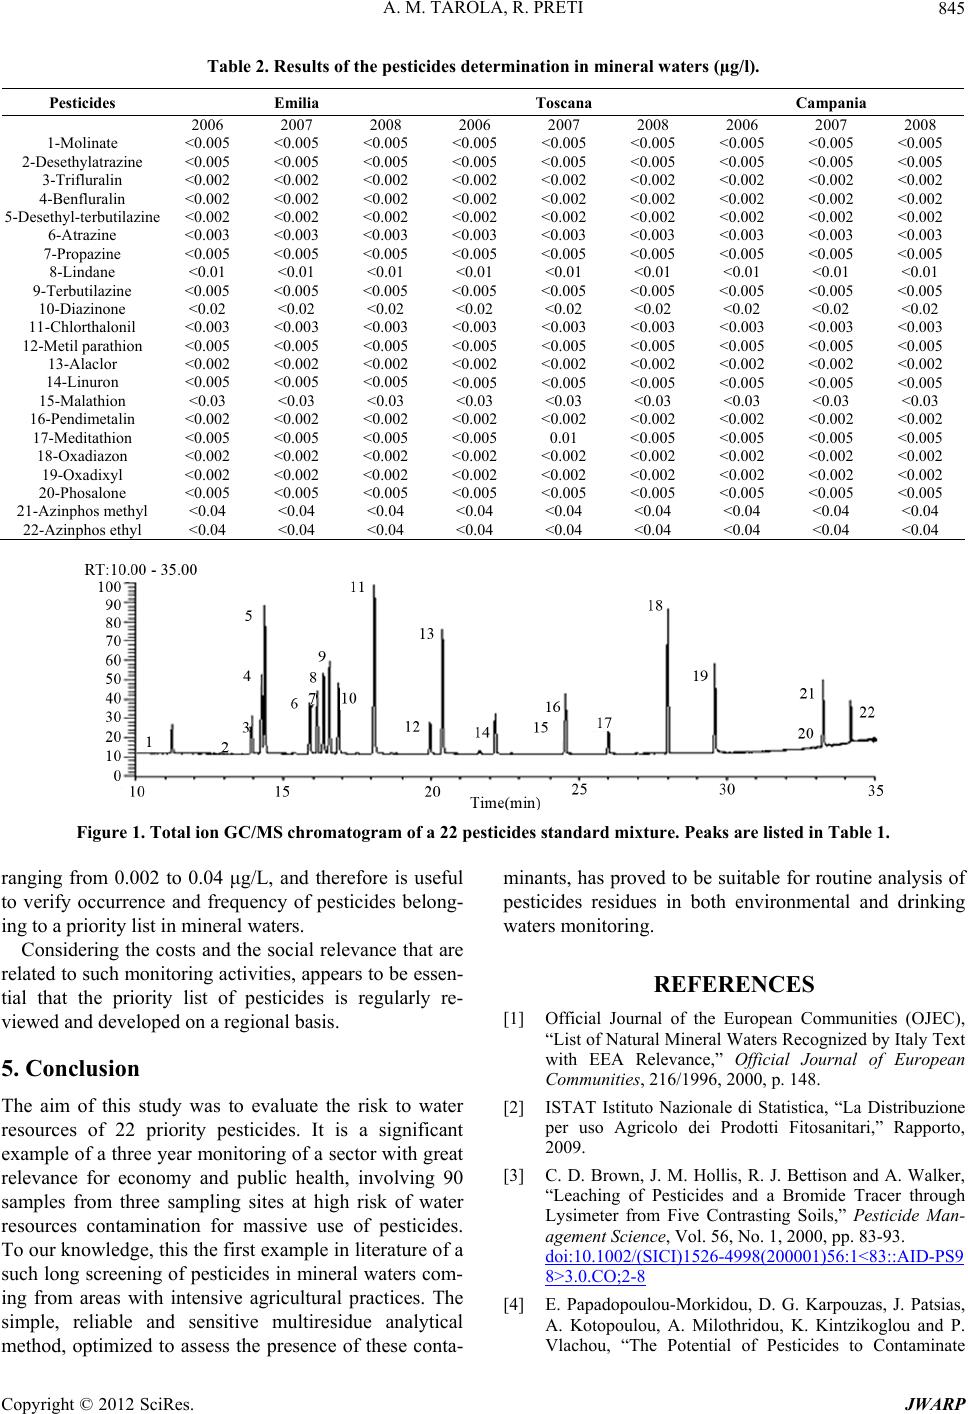
In this study a multiresidue method based on SPE and
GC separation with MS detection were utilised to assess
the presence of 22 selected pesticides residues in 30 Ital-
ian mineral water wells for three years. The method sho-
wed to be suitable to the analysis of these compounds
since they were detected at low concentrations, according
to European Union maximum admissible concentration
(Table 2). The LODs were calculated multiplying by
three the average value of the noise sampled at the reten-
tion time of each analyte. Repeatability and reproducibil-
ity studies yielded Relative Standard Deviations (RSDs)
lower than 7% in all the cases, with recoveries ranging
from 86% to 105% evaluated at 0.05 µg/l spiked level.
All measurements were performed in triplicate. The ty-
pical chromatogram is showed in Figure 1. During the
screening only in 2007 one sample belonging to an Emilia
well had a level of meditathion of 0.01 mg/l which is
over our detection limit but under the European Union
Maximum Acceptable Concentration (MAC) (Table 2).
4. Discussion
Italy is the nation with highest production and consump-
tion of mineral waters in the world. The results of this
three-year study on pesticide residues in 90 mineral wa-
ter samples coming from three regions with intensive use
of pesticides, are reassuring for the quality of Italian
mineral waters, being residues detected in just one sam-
ple and at a concentration lower than the European Union
Maximum Acceptable Concentration (MAC).
The multiresidue analytical method used has proved to
be sensitive and reliable. The method does fulfill the de-
tection limits required by the EC Directive, with LOD
Copyright © 2012 SciRes. JWARP
A. M. TAROLA, R. PRETI
Copyright © 2012 SciRes. JWARP
845
Table 2. Results of the pesticides determination in mineral waters (µg/l).
Pesticides Emilia Toscana Campania
2006 2007 2008 2006 2007 2008 2006 2007 2008
1-Molinate <0.005 <0.005 <0.005 <0.005 <0.005 <0.005 <0.005 <0.005 <0.005
2-Desethylatrazine <0.005 <0.005 <0.005 <0.005 <0.005 <0.005 <0.005 <0.005 <0.005
3-Trifluralin <0.002 <0.002 <0.002 <0.002 <0.002 <0.002 <0.002 <0.002 <0.002
4-Benfluralin <0.002 <0.002 <0.002 <0.002 <0.002 <0.002 <0.002 <0.002 <0.002
5-Desethyl-terbutilazine <0.002 <0.002 <0.002 <0.002 <0.002 <0.002 <0.002 <0.002 <0.002
6-Atrazine <0.003 <0.003 <0.003 <0.003 <0.003 <0.003 <0.003 <0.003 <0.003
7-Propazine <0.005 <0.005 <0.005 <0.005 <0.005 <0.005 <0.005 <0.005 <0.005
8-Lindane <0.01 <0.01 <0.01 <0.01 <0.01 <0.01 <0.01 <0.01 <0.01
9-Terbutilazine <0.005 <0.005 <0.005 <0.005 <0.005 <0.005 <0.005 <0.005 <0.005
10-Diazinone <0.02 <0.02 <0.02 <0.02 <0.02 <0.02 <0.02 <0.02 <0.02
11-Chlorthalonil <0.003 <0.003 <0.003 <0.003 <0.003 <0.003 <0.003 <0.003 <0.003
12-Metil parathion <0.005 <0.005 <0.005 <0.005 <0.005 <0.005 <0.005 <0.005 <0.005
13-Alaclor <0.002 <0.002 <0.002 <0.002 <0.002 <0.002 <0.002 <0.002 <0.002
14-Linuron <0.005 <0.005 <0.005 <0.005 <0.005 <0.005 <0.005 <0.005 <0.005
15-Malathion <0.03 <0.03 <0.03 <0.03 <0.03 <0.03 <0.03 <0.03 <0.03
16-Pendimetalin <0.002 <0.002 <0.002 <0.002 <0.002 <0.002 <0.002 <0.002 <0.002
17-Meditathion <0.005 <0.005 <0.005 <0.005 0.01 <0.005 <0.005 <0.005 <0.005
18-Oxadiazon <0.002 <0.002 <0.002 <0.002 <0.002 <0.002 <0.002 <0.002 <0.002
19-Oxadixyl <0.002 <0.002 <0.002 <0.002 <0.002 <0.002 <0.002 <0.002 <0.002
20-Phosalone <0.005 <0.005 <0.005 <0.005 <0.005 <0.005 <0.005 <0.005 <0.005
21-Azinphos methyl <0.04 <0.04 <0.04 <0.04 <0.04 <0.04 <0.04 <0.04 <0.04
22-Azinphos ethyl <0.04 <0.04 <0.04 <0.04 <0.04 <0.04 <0.04 <0.04 <0.04
Figure 1. Total ion GC/MS chromatogram of a 22 pesticides standard mixture. Peaks are listed in Table 1.
ranging from 0.002 to 0.04 μg/L, and therefore is useful
to verify occurrence and frequency of pesticides belong-
ing to a priority list in mineral waters.
Considering the costs and the social relevance that are
related to such monitoring activities, appears to be essen-
tial that the priority list of pesticides is regularly re-
viewed and developed on a regional basis.
5. Conclusion
The aim of this study was to evaluate the risk to water
resources of 22 priority pesticides. It is a significant
example of a three year monitoring of a sector with great
relevance for economy and public health, involving 90
samples from three sampling sites at high risk of water
resources contamination for massive use of pesticides.
To our knowledge, this the first example in literature of a
such long screening of pesticides in mineral waters com-
ing from areas with intensive agricultural practices. The
simple, reliable and sensitive multiresidue analytical
method, optimized to assess the presence of these conta-
minants, has proved to be suitable for routine analysis of
pesticides residues in both environmental and drinking
waters monitoring.
REFERENCES
[1] Official Journal of the European Communities (OJEC),
“List of Natural Mineral Waters Recognized by Italy Text
with EEA Relevance,” Official Journal of European
Communities, 216/1996, 2000, p. 148.
[2] ISTAT Istituto Nazionale di Statistica, “La Distribuzione
per uso Agricolo dei Prodotti Fitosanitari,” Rapporto,
2009.
[3] C. D. Brown, J. M. Hollis, R. J. Bettison and A. Walker,
“Leaching of Pesticides and a Bromide Tracer through
Lysimeter from Five Contrasting Soils,” Pesticide Man-
agement Science, Vol. 56, No. 1, 2000, pp. 83-93.
doi:10.1002/(SICI)1526-4998(200001)56:1<83::AID-PS9
8>3.0.CO;2-8
[4] E. Papadopoulou-Morkidou, D. G. Karpouzas, J. Patsias,
A. Kotopoulou, A. Milothridou, K. Kintzikoglou and P.
Vlachou, “The Potential of Pesticides to Contaminate
A. M. TAROLA, R. PRETI
846
Groundwater Resources of the Axios River Basin in Ma-
cedonia, Northern Greece. Part I. Monitoring Study in the
North Part of the Basin,” Science of the Total Environ-
ment, Vol. 321, No. 1-3, 2004, pp. 127-146.
doi:10.1016/j.scitotenv.2003.08.019
[5] E. Ballestros and M. J. Parrado, “Continuous Solid-Phase
Extraction and Gas Chromatographic Determination of
Organophosphorus Pesticides in Natural and Drinking
Waters,” Journal of Chromatography A, Vol. 1029, No.
1-2, 2004, pp. 267-273.
doi:10.1016/j.chroma.2003.12.009
[6] P. Auersperger, K. Lah, J. Kus and J. Marsel, “High Pre-
cision Procedure for Determination of Selected Herbi-
cides and Their Degradation Products in Drinking Water
by Solid-Phase Extraction and Gas Chromatography-
Mass Spectrometry,” Journal of Chromatography A, Vol.
1088, No. 1-2, 2005, pp. 234-241.
doi:10.1016/j.chroma.2005.04.100
[7] L. Ruiz-Gil, R. Romero-Gonzalez, A. Garrido Frenich
and J. L. Martinez Vidal, “Determination of Pesticides in
Water Samples by Solid Phase Extraction and Gas Chro-
matography Tandem Mass Spectrometry,” Journal of
Separation Science, Vol. 31, No. 1, 2008, pp. 151-161.
doi:10.1002/jssc.200700299
[8] Environmental Protection Agency (EPA), “Determination
of Organic Compounds in Drinking Water by Liquid-
Solid Extraction and Capillary Column Gas Chromatog-
raphy/Mass Spectrometry,” Method 525.2. EPA-500, Re-
vision 11.1 August 1995.
[9] Official Journal of the European Communities (OJEC),
“Directive 98/83/EC of November 3 1998 on the Quality
of Water Intended for Human Consumption,” Official
Journal of the European Union, 5/12/1998, L330/32, 1998.
[10] Official Journal of the European Communities (OJEC),
“Directive 2003/40/EC of May 2003 Establishing the List,
Concentration Limits and Labelling Requirements for the
Constituents of Natural Mineral Waters and the Condi-
tions for Using Ozone-Enriched Air for the Treatment of
Natural Mineral Waters and Spring Waters,” Official Jour-
nal of the European Union, 22/05/2003, L126, 2003.
Copyright © 2012 SciRes. JWARP