 Advances in Breast Cancer Research, 2012, 1, 21-29 http://dx.doi.org/10.4236/abcr.2012.13004 Published Online October 2012 (http://www.SciRP.org/journal/abcr) Computing a Predictor Set Influence Zone through a Multi-Layer Genetic Network to Explore the Role of Estrogen in Breast Cancer Leandro de A. Lima1,2, Marcelo Ris¹, Junior Barrera³, Maria M. Brentani2,4, Helena Brentani4* 1Instituto de Matemática e Estatística, Universidade de São Paulo, São Paulo, Brazil 2Hospital A.C. Camargo, São Paulo, Brazil 3Departamento de Física e Matemática da FFCLRP, Universidade de São Paulo, Ribeirão Preto, Brazil 4Faculdade de Medicina, Universidade de São Paulo, São Paulo, Brazil Email: *helena.brentani@gmail.com Received July 5, 2012; revised August 10, 2012; accepted August 20, 2012 ABSTRACT Modeling inter-relationships of genes over a specific genetic network is one of the most challenging studies in systems biology. Among the families of models proposed one commonly used is the discrete stochastic, based on conditionally independent Markov chains. In practice, this model is estimated from time sequential sampling, usually obtained by microarray experiments. In order to improve the accuracy of the estimation method, we can use biological knowledge. In this paper, we decided to apply this idea to study the role of estrogen in breast cancer proliferation. The n-influence zone of a set S of genes in a given multi-layer genetic network is a set L of genes regulated, directly or indirectly, by genes in S, after at most n-1 layers. In this manuscript we describe a new approach for computing the n-influence zone of S through the estimation of a multi-layer genetic network from gene expression time series, measured by microarrays, and biological knowledge. Using seed genes related to cell proliferation, our method was able to add to the third layer of the network other genes related to this biological function and validated in the literature. Using a set of genes directly influenced by estrogen, we could find a new role for cell adhesion genes estrogen dependent. Our pipeline is user-friendly and does not have high system requirements. We believe this paper could contribute to improve the data mining for biologists in microarray time series. Keywords: Genetic Regulatory Networks; Estrogen; Time-Course Microarrays 1. Introduction Genes are translated into proteins, which in turn can react to create complexes that regulate genes. This feedback process generates dynamical systems, known as genetic regulatory networks (GRN) that regulate metabolic path- ways. In general, GRNs are very complex due to the in- trinsic nonlinearity of the phenomena and the huge amount of variables (e.g. genes and proteins) involved. A requirement for understanding quantitatively this natural phenomenon is the capacity of measuring it. In order to do that, we can use microarray [1] or RNA-Seq [2], which are technologies that permit to measure si- multaneously the expressions of thousands of genes. This technology can be used to get instantaneously the state of nature under the experimental conditions defined by sci- entists. Thus, using a large experimental preparation and extracting relatively small volumes periodically, it is possible to measure gene expression profiles that are samples of the dynamical behavior of genes. The result- ing data is the source for the explosion of molecular pro- filing studies and permit the understanding of regulation mechanisms and, consequently, of biological phenomena associated to a specific organism or a cell culture [3]. When the study needs the measurement of expression profiles for a period of time, the time-course microarray experiment usually is the option. The analysis of these data permits to cluster genes sharing similar temporal profiles [4] and to estimate the architecture of GRNs [5]. There are several studies trying to model and estimate GRNs. A review of them can be found in [6-9]. The ar- chitecture of a GRN indicates the dependence of a gene dynamics to other genes dynamics. The model parame- ters can be estimated from promoter region structure analysis, gene expression profiles and biological knowl- edge. However, investigating large networks is very hard due to the small samples of the dynamical behavior of network genes (i.e. short gene expression profile) avail- able. Studying specific gene networks is a more tractable *Corresponding author. C opyright © 2012 SciRes. ABCR  L. DE A. LIMA ET AL. 22 problem [10]. The first model adopted to represent GRNs were Boolean state machines [11], also called Boolean Networks. Probabilistic Boolean Networks (PBNs) [12] are an extension of Boolean Networks in which the Boo- lean function to determine the next state in the network is not deterministic, being chosen each iteration from a family of Boolean functions according to a given prob- ability distribution. Probabilistic Genetic Networks (PGNs) [13] is another mathematical view of PBNs that focus only on the probability distributions that characterize the PBNs. In fact, a PGN is a discrete Markov chain, whose states are vectors of gene expression, which obey some axioms: 1) the transition function is time-independent, i.e. the probability of a state, given a previous one, does not vary in time; 2) all the transition probabilities are positive, i.e. all the states given a previous one can occur; 3) the transition function is conditionally independent; 4). the transition function is almost deterministic, i.e. there is a state almost determined given a previous one. These axioms are motivated by a compromise between biologi- cal phenomena representation and difficulties with esti- mation from the available data. In fact, any chosen model needs to be estimated from the available data, which is usually small. This is an im- portant constraint in the choice of models, since complex models with many parameters would be impossible to estimate from reduced data sets. In these conditions, PBNs or PGNs are good options. In this work, we used PGN to model GRNs and pro- posed a new algorithm to estimate them. The input data for this algorithm is a time-course microarray experiment, a subgroup of initial genes (the initial set of predictors, also called seed genes) and some prior knowledge of genes involved with the studied phenomena, whereas the output is a graph representing the architecture of the network designed. The genes that appear in the network are the influence zone of the seed genes (i.e. the genes influenced by the seed genes). Several manners of esti- mating GRNs have been proposed. Some of them pro- pose, instead of computing the relationship between every pair of genes, to grow the network around specific genes [5,14]. And some propose to study the networks in specific contexts [10,15]. In this paper, we modified some aspects of the model for network estimation from seed genes: 1) designing the network through a sequen- tial multi-layer estimation; 2) measuring the prediction capacity by the estimated mean conditional entropy; 3) proposing a formal model for using categorical biological knowledge to diminish the prediction estimation errors. Besides, the results were tested in microarray time series for studying genes regulated by estrogen. Estrogen has a fundamental importance in the repro- ductive tissues [16]—the growing of mammary glands and endometry during pregnancy are estrogen-dependent [17]—and it can also be related to the growing of tumor cells. There are more than 300 known genes with regula- tion positive or negative by estrogen [18-23]. These genes can be classified in categories by their bio- logical functions. Genes addressed to biological func- tions as- sociated to cell proliferation are related to cancer [24] and estrogen can up-regulate or down-regulate those genes [19]. Taking it into account, we chose a dataset related to estrogen to test our method. Two examples of application will be shown. The input data is a time- course microarray experiment of estrogen response in T47-D cells [22] treated with estrogen (E2) during 24 hours. In both experiments, a subgroup of genes (seed genes) regulated by estrogen was selected to start the network. The output is a graph representing interactions among genes and their predictors. The genes in the esti- mated network are the influence zone of the seed genes and their biological functions are analyzed in the context of the seed genes biological function 2. Methods 2.1. Overview The n-influence zone of a set S of genes in a given multi-layer genetic network is a set L of genes regulated, directly or indirectly, by genes in S, after at most n − 1 layers. We present an approach for computing the n-in- fluence zone of the genes in S through the estimation of a multi-layer genetic network from gene expression time series and biological knowledge. The set S chosen is composed of genes that participate of a given biological function. An n-layer network is estimated sequentially. The estimation of a layer Li con- sists in ranking, based in some estimated cost function, the genes influenced by some subset of the genes in the previous layer Li−1 and choosing a subset of these genes, based on the rank and on their known relation with the phenomena studied. This process is repeated n − 1 times and L0 = S. In each step i, the biological functions of Li layer genes are recorded from GO [25] or, eventually, from other functional analysis. This procedure permits to investigate the relation of the phenomena associated to the biological function of S and L genes. 2.2. Time-Course Microarray The input data for our study comes from [22] experiment. This is a time-course microarray experiment, that sam- pled T-47D cells over 24 hours through Compugen 19K human oligonucleotide array. The total are 16 experi- ments: the 8 first every hour and the 8 reminders every two hours. The whole experiment was repeated in three different conditions: 1) treated with estrogen (17β-estra- diol (E2)); 2) treated with estrogen (E2) plus ICI (anti-es- trogen component); 3) treated with estrogen (E2) plus Copyright © 2012 SciRes. ABCR  L. DE A. LIMA ET AL. 23 ICI plus CHX-Cycloheximide (protein synthesis inhibitor component). Each experiment was compared with the T-47D cells not treated with estrogen. The experiment obtained: 386 genes, estrogen responsive; 139 genes, estrogen responsive and ICI sensitive; 89 genes, estrogen responsive, ICI sensitive and CHX insensitive. These genes were identified as estrogen directly regulated genes. 2.3. Normalization, Quantization and Filtering Let M be the time-course microarray matrix, with n genes in m instants of time. In order to find the best pre- dictors subset of a gene, the pipeline (Figure 1) needs to compute for each subset a cost function associated to it. This process requires that the expression values be dis- crete values instead of real numbers contained in the output of the microarray experiment. Of several methods to do that, we used a method based on [26]. It consists in two steps: Normalization of matrix M into the matrix MN. It consists in normalizing each gene signal to a signal with normal distribution with expectation equals to 0 and standard deviation equals to 1. After that, all the genes will have the same distribution and their expressions can be compared. The normalization consists in calculating the expectation Ei and the standard deviation σi of the signal for each gene G given. The resulting elements of the normalized matrix MN are given by Figure 1. The pipeline steps. , ,i N i ik E Mik i = 1, ···, n and k = 1, ···, m. Quantization of matrix MN into the matrix MQ. This process is equivalent to map the normalized signal values in previous step to some qualitative expression levels. In this work, we use three qualitative expression levels: −1, indicating that the gene is under expressed, 0, indicating that the gene is null, and 1, indicating that the gene is over expressed in relation to the reference. A threshold mapping is used to perform the quantization as in [26]. For each gene G a lower li and an upper ui thresholds are obtained by ,0 , ,:, 0 NN Mik i NN Mik lMikMik and ,0 , ,: 0 NN Mik i NN ik uMikM In other words, li and ui are the expectation of, respec- tively, the negative and positive signals. The elements of the quantized matrix MQ are given by: 1, , ,0,if , 1, if, Ni QiN Ni ifMi kl i iklM iku Mik u for i = 1, ···, n and k = 1, ···, m. Filtering. In order to avoid further errors, the entries in a time-course microarray experiment must be filtered. To do so, we have to analyze two cases: 1) the expres- sion signal cannot be determined and 2) the gene expres- sion during the experiment is constant. For the first case, we simply set this entry with the null value. In both cases, the genes do not give any new information for the re- sulted network and for this reason they are removed from the data set. 2.4. Seed Genes Analysis The algorithm pipeline requires at each step a set of genes called seed genes. This set contains the predictors to be found for each gene in the whole data set. For cells treated with estrogen, for example, in order to test estrogen regulation network, good candidate for seed genes can be genes directly regulated by estrogen, i.e. genes in which estrogen could act as a transcription fac- tor. It is possible to use many tools for analyzing genes biological functions. In this work, we used FunNet [27] software, which calculates the significance P-value of the gene enrichment, of the considered GO/KEGG category, Copyright © 2012 SciRes. ABCR  L. DE A. LIMA ET AL. Copyright © 2012 SciRes. ABCR 24 with a unilateral Fisher exact test. The genes best pre- dicted by each current set of seed genes are used as pre- dictors for the next step. 2.5. Cost Function For each gene in the whole data set and a given set of seed genes, we try to find the subset of the seed genes that best predict the expression of this gene, which we call target gene. It is possible to use our method inferring the prediction interactions using several manners (for example, Bayes- ian networks, ordinary differential equations or other information-theoretic approaches, shown in [6,7]. However, in our tests, we have used the mean condi- tional entropy as cost function. This measure, which var- ies between 0 and 1, indicates the dispersion of a prob- ability distribution function, i.e. the entropy has small values for distributions with mass concentration in one of the possible instances and the biggest value for a uniform distribution. For our case, we are interested in the distri- bution of the expression G of a gene given the vector expression A of a subset of seed genes. Let Q be the set of the discrete values used to quantize the gene expres- sions (e.g. Q = {−1, 0, +1}). And also let a ∈ Q|A| be an instance of A and g ∈ Q be an instance of G. The mean conditional entropy E(H(G|A)) is given by: log A aQ gQ Q EHGppG g pG g AAa aAa A ated mean conditional entropy Ê(H(G|A)) is given by: (1) Based just in the input data one can only calculate an estimation of the cost function in place of its real value. The estim log A aQ Q gQ ˆˆ EHG p ˆˆ pG gpG g AAa aAa (2) ance a of A which occurs less than f. It is equivalent to: The Equation (2) requires estimation of P(A = a) and P(G = g|A = a). Let f be a frequency threshold used to separate instances a of A that do not occur frequently. Let N+ be the sum of the frequencies of each instance a of A which occurs more or equal than f and N− be the sum of the frequencies of each inst A #f,aQ N# Aa Aa. A #f,aQ N# Aa a tor ˆ pG g So, the estima of Aa pG g Aa is given by: if if #G g,# f # ˆ pG g #Gg ,# NN Aa Aa Aa Aa Aa f and the estimator ˆ p a of p a is given by: if if A ,# f; NN N ˆ pN1 #f. NN 'Q:#' f' Aa Aa Aa aAa The estimator # N Aa ˆ p a gh the ins distributes uniformly the fre est predicted than a gene G’ by seed genes set. We present here some of them: gene quency N− throutances that do not occur or occur less than f times. 2.6. Ranking Results We say that a gene G is b the seed genes, if the cost of the best predictor subset of the seed genes to G is lower than the cost of the best pre- dictor subset to G’. Ranking the genes of the data set by the costs associated to their best predictor subsets pro- duces a list in which the initial elements are the genes best predicted by the seed genes. This procedure is the key to obtain a new set of genes to the next step of the pipeline. Some methods can be used to choose the next Defining a threshold value e to the cost function and extracting only the genes with predictor subset cost lower , depend-than e. This value can be updated each iteration ing on the number of genes extracted by this value. Extracting a fixed number of genes from the top of the ranking list that share some biological function (GO and/or KEGG entries). For example, extract the first 30 genes that have one or more of these biological functions: cell division, cell proliferation and cell cycle. Simply extracting a fixed number of genes from the top of the ranking list, which can be defined as a per- centage of the whole set. These methods can be grouped to obtain the next seed s. For example, set a threshold value e and some  L. DE A. LIMA ET AL. 25 biological functions to extract the genes sharing these biological functions and with best predictor subset cost lo on was processed by an algorithm using seed genes. For each gene G in e algorithm executes the follow- Cytoscape software. Th Database relating the gene to its aliases and kn (http://www.cytoscape.org) w Opteron™ with 4GB of RAM. The resulting gr ht e same data. e-course ompugen 19K human oligonucleotide array) T-47D cells treated with estrogen (E2) [22] undefined. For the un- de es, we searched for th n Figure 2 we see the whole network of this ex wer than e. 2.7. Implementation P The pipeline was composed by the following steps: Each iterati Python that received the the set of seed genes, th ing processes: sub-matrix extraction containing the expressions of the seed genes and the target gene G; execution of the algorithm to find the best predictor subset; results storage in an HTML page and in a text file as the source to create the graph on is HTML page has, for each gene, a link to Stanford Microarray own information about it. The FunNet [27] website (http://www.funnet.info) was used to get the GO Biological Process most enriched categories. The Cytoscape software as used to build the network graph image. The experimental results were processed in an Dual Core AMD aph, the seed genes for each iteration and the source code can be downloaded at tp://bioinfo.lbhc.hcancer.org.br/pipeline/. 3. Results We performed two experiments based on th The input for the experimental results was a tim microarray (C experiment of in 16 experiments over 24 hours. Some genes were removed from the whole process: 1) the genes not found in GO Biological Process; 2) genes with constant signal expression and 3) genes with more than half of the signal expression fined signals the entries were marked with null values and ignored during the whole process. The GO entry was assigned to each gene, the complete data were normal- ized and quantized according to the methods discussed previously and we used 3 levels of quantization: −1, 0 and +1. We used f = 1 as the frequency threshold ex- plained in Section 2.5. In our experiments, we chose a general maximum threshold value of 0.15, because we want to be restrictive in relation to the cost function. An- other general restriction is that in each iteration the method permits to adjoin to the network less than 5% of the whole set of candidate genes. In order to do that, the threshold of 0.15 may be decreased. The initial seed genes were obtained from the 386 genes E2-responsive in [22]. As we are interested in the role of estrogen in proliferation of cancer cells, in our first experiment, from these 386 gen e ones with GO Biological Process related to “Cell proliferation” and found 30 genes (level 9, P-value of 0.00314). This biological function used to filter the initial seed genes was obtained from the work in [19] as one of the functional categories of genes stimulated or inhibited by estrogen. I periment. By using the 30 “Cell proliferation” related seed genes, we grew the network over 3 layers, of which the first one corresponds to the seed genes. In order to find the second layer we added to the network the genes that were predicted by the seed genes with mean condi- tional entropy lower than 0.15, resulting in a layer with 572 genes, from which 105 have GO Biological Process annotation. Then, from these 572, we performed a search for the genes also related to “Cell proliferation” (in GO Biological Process), finding 8 genes (level 6, P-value of 0.0299). After that, these 8 genes were also used as seed genes to grow the third layer. The third layer is composed by the genes predicted with mean conditional entropy lower than 0.15, a set of 28 genes. We searched in the lit- erature for these genes that were related to cancer, and found 18 of them, as shown in Supplementary Table 11. Figure 2. The “Cell proliferation” 3 layers network. The diamond nodes are the seed genes. The black nodes are the second layer genes related to “Cell proliferation” in GO Biological Process or their predictors. The white genesre a the seed genes that are not predictors of genes related to “Cell proliferation”, that are the gray ones. The darker arrows indicate the predictions from second to third layer genes. The size of the nodes are proportional to the number of linkages. 1See: http://bioinfo.lbhc.hcancer.org.br/pipeline/. Copyright © 2012 SciRes. ABCR  L. DE A. LIMA ET AL. 26 In the group of 386 genes that [22] discovered as in- fluenced by estrogen, they performed an experiment us- ing chromatin immunoprecipitation (ChIP) to characterize the interaction between ER and the regulatory elements of candidate target genes. Through this experiment they found 89 genes. As we previously explained, it is our interest to discover what and how genes directly regu- lated by estrogen are related to each other and to other genes. Therefore, we used these 89 genes as seed genes in our second experiment. We performed the search of all of them in GO Biological Process in order to find the annotated ones. This search resulted in a group of 53 genes, which were used as the seed genes. Then, we added to the network (Figure 3), which has only two layers, the genes that were predicted by the seed genes with mean conditional entropy lower than 0.08 (as de- scribed previously, this threshold adds to the network less than 5% of the whole set of genes). It resulted in a layer with 412 genes. After that, we performed a search among the biologi- cal functions of these 412 genes in Gene Ontology. Sev- eral biological functions known to be related to estrogen (like “Cell proliferation” and “Cell differentiation”) were found. In some levels of the GO classification (Figure 4), we discovered a function related to estrogen that is not so prominent in the literature. Out of the 412 genes pre- dicted by the 53 initial seed genes, 27 are related to “Cell adhesion”. In the first levels of GO enrichment analysis, “Cell adhesion” appeared as the most enriched biological function category. This is an important discovery, be- cause it is known that cell adhesion has a direct relation- ship to cancer morphogenesis [28]. Roughly speaking, Figure 4. List of 12 most enriched “GO Biological Process” categories (level 8), in which “Cell adhesion” is present. Of the 412 genes predicted by the first layer, 27 of the anno- tated ones (183) are related to “Cell adhesion”. reduced intercellular adhesiveness allows cancer cells to disobey the social order, resulting in destruction of his- tological structure, which is the morphological hallmark of malignant tumors. 4. Discussion Our pipeline is suitable for small data sets, takes into account the biological knowledge and contributed for understanding the physiopathology of breast cancer in- duced by estrogen. It also has not high system require- ments (for example, the user can easily run the program in a 256 MB of system memory, a 2 GHz processor and 1 GB of disk space). Using the predicted genes by seeds related to cell proliferation we can propose new genes involved in the tumor proliferation. It is important to note that from 28 genes proposed as important genes reted the second la to tumor proliferation in breast cancer 18 have been validated in the literature as cancer proliferating genes. Another important information to cite is that in the first experiment (Figure 5) we can observe that Figure 3. “Cell adhesion” network. The white nodes are the seed genes. The gray ones are the genes predicted by the seed genes and the black ones are the predicted genes re- lated to “Cell adhesion” in GO Biological Process. Copyright © 2012 SciRes. ABCR 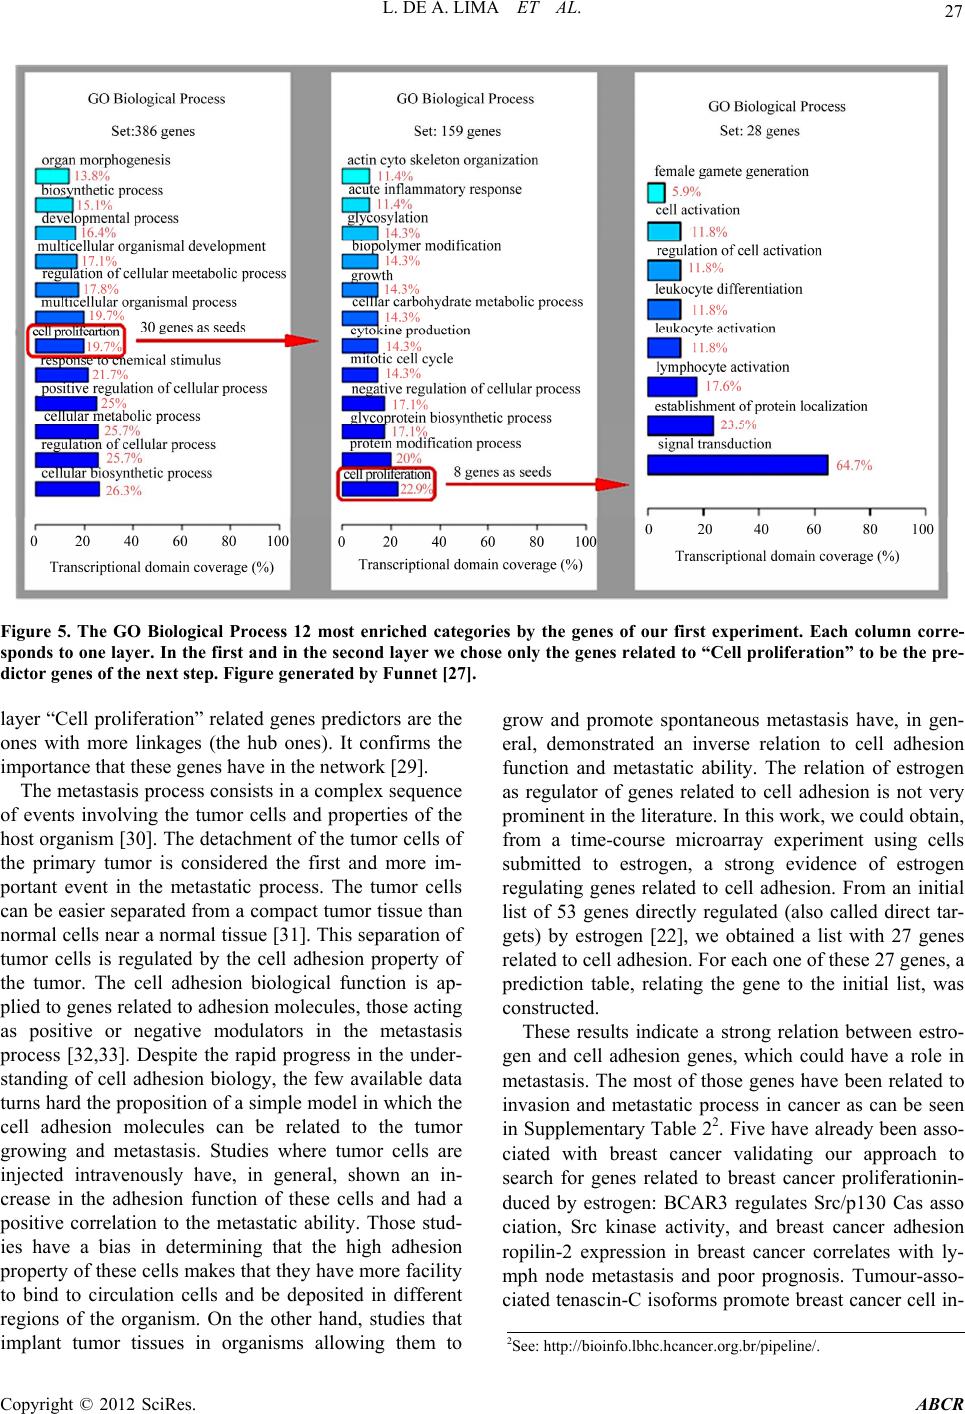 L. DE A. LIMA ET AL. Copyright © 2012 SciRes. ABCR 27 Figure 5. The GO Biological Process 12 most enriched categories by the genes of our first experiment. Each column corre- sponds to one layer. In the first and in the second layer we chose only the genes related to “Cell proliferation” to be the pre- dictor genes of the next step. Figure genera te d by F unnet [27]. layer “Cell proliferation” related genes predictors are the ones with more linkages (the hub ones). It confirms the importance that these genes have in the network [29]. The metastasis process consists in a complex sequence of events involving the tumor cells and properties of the host organism [30]. The detachment of the tumor cells of the primary tumor is considered the first and more im- grow and promote spontaneous metastasis have, in gen- eral, demonstrated an inverse relation to cell adhesion function and metastatic ability. The relation of estrogen as regulator of genes related to cell adhesion is not very prominent in the literature. In this work, we could obtain, from a time-course microarray experiment using cells submitted to estrogen, a strong evidence of estrog related to cell adhesion. For each one of these 27 genes, a See: http://bioinfo.lbhc.hcancer.org.br/pipeline/. portant event in the metastatic process. The tumor cells can be easier separated from a compact tumor tissue than normal cells near a normal tissue [31]. This separation of mor cells is regulated by the cell adhesion property of regulating genes related to cell adhesion. From an initial list of 53 genes directly regulated (also called direct tar- gets) by estrogen [22], we obtained a list with 27 genes tu the tumor. The cell adhesion biological function is ap- plied to genes related to adhesion molecules, those acting as positive or negative modulators in the metastasis process [32,33]. Despite the rapid progress in the under- standing of cell adhesion biology, the few available data turns hard the proposition of a simple model in which the cell adhesion molecules can be related to the tumor growing and metastasis. Studies where tumor cells are injected intravenously have, in general, shown an in- crease in the adhesion function of these cells and had a positive correlation to the metastatic ability. Those stud- ies have a bias in determining that the high adhesion property of these cells makes that they have more facility to bind to circulation cells and be deposited in different regions of the organism. On the other hand, studies that implant tumor tissues in organisms allowing them to prediction table, relating the gene to the initial list, was constructed. These results indicate a strong relation between estro- gen and cell adhesion genes, which could have a role in metastasis. The most of those genes have been related to invasion and metastatic process in cancer as can be seen in Supplementary Table 22. Five have already been asso- ciated with breast cancer validating our approach to search for genes related to breast cancer proliferationin- duced by estrogen: BCAR3 regulates Src/p130 Cas asso ciation, Src kinase activity, and breast cancer adhesion ropilin-2 expression in breast cancer correlates with ly- mph node metastasis and poor prognosis. Tumour-asso- ciated tenascin-C isoforms promote breast cancer cell in- 2 en  L. DE A. LIMA ET AL. 28 vasion and growth by matrix metalloproteinase-depend- ent and independent mechanisms. SPOCK (SPARC) is a proteoglycan reported to be associated to poor outcome in breast cancer [34] and resistance to first-line ta- moxifen treatment [35]. It is also interesting to note that some genes related to families of proteins implicated in the developing nervous system may play an important role in cancer [36,37] and we found some of them: PTPRS, CNTNAP2, NRP2, LSAMP, KITL6, NEO1 and L1CAM. 5. Acknowledgements The authors are grateful to FAPESP (99/12765-2, 01/094 01-0, 04/03967-0 and 05/00587-5), CNPq (300722/98-2, 468 413/00-6, 521097/01-0 474596/04-4 and 491323/ 05-0) and CAPES for financial support. This work was partially supported by grant 1 D43 TW07015-01 from the National Institutes of Health, USA. REFERENCES [1] M. Schena, “DNA Microarrays: A Practical Approach,” Oxford University Press, Oxford, 1999. [2] S. Marguerat and J. Bähler, “Rna-Seq: From Technology to Biology,” Cellular and Molecular Life Sciences, Vol. 67, No. 4, 2010, pp. 569-579. doi:10.1007/s00018-009-0180-6 [3] M. Schena, D. Shalon, R. Davis and P. O. Brown, “Quan- titative Monitoring of Gene Expression Patterns with a Complementary DNA Microarray,” Science, Vol. 270, No. 5235, 1995, pp. 467-470. doi:10.1126/science.270.5235.467 [4] S. Peddada, E. Lobenhofer, L. Li, C. Afshari, C ach, “Gene Selection and Clus- nd Dose-Response Microarra . Weinberg and D. M. Umb tering for Time-Course ay Experiments Using Order-Restricted Inference,” Science, Vol. 19, No. 7, 2003, pp. 834-841. [5] R. F. Hashimoto, S. Kim, I. Shmulevich, W. Zhang, M. L. Bittner and E. R. Dougherty, “Growing Genetic Regula- tory Networks from Seed Genes,” Bioinformatics, Vol. 20, No. 8, 2004, pp. 1241-1247. doi:10.1093/bioinformatics/bth074 [6] M. Bansal, V. Belcastro, A. Ambesi-Impiombato and D di Bernardo, “orks from Expres- sion Profiles,” ogy, Vol. 3, No. 78, Genetic Regu- 08 . How to Infer Gene Netw Molecular Systems Biol 2007, pp. 1-10. [7] H. D. Jong, “Modeling and Simulation of latory Systems: A Literature Review,” Journal of Com- putational Biology, Vol. 9, No. 1, 2002, pp. 67-103. doi:10.1089/106652702528332 , “Genomic Signal . 416-429. [8] I. Shmulevich and E. R. Dougherty Processing,” Princeton University Press, Princeton, 2007. [9] C. Sima, J. Hua and S. Jung, “Inference of Gene Regula- tory Networks Using Time-Series Data: A Survey,” Cur- rent Genomic, Vol. 10, No. 6, 2009, pp doi:10.2174/138920209789177610 [10] E. Segal, M. Shapira, A. Regev, D. Pe’er, D. Botstein, D. Koller and N. Friedman, “Module Networks: Identifying Regulatory Modules and Their Condition-Specific Regu- lators from Gene Expression Data,” Nature Genetics, Vol. 34, No. 2, 2003, pp. 166-176. doi:10.1038/ng1165 W. Zhang, Rule-Based Uncer- [11] S. A. Kauffman, “The Origins of Order, Self-Organiza- tion and Selection in Evolution,” Oxford University Press, Oxford, 1993, pp. 441-520. [12] I. Shmulevich, E. R. Dougherty, S. Kim and “Probabilistic Boolean Networks: A tainty,” Bioinformatics, Vol. 18, No. 2, 2002, pp. 261- 274. doi:10.1093/bioinformatics/18.2.261 [13] J. Barrera, R. M. Cesar-Jr., D. C. Martins-Jr., E. F. Merino, R. Z. N. Vêncio, F. G. Leonardi, M. M. J. Tegnér, “Growing Yamamoto, C. A. B. Pereira and H. A. Portillo, “A New Annotation Tool for Malaria Based on Inference of Prob- abilistic Genetic Networks,” In CAMDA, 2004. [14] P J. M. eña, J. Björkegren and Bayesian Network Models of Gene Networks from Seed Genes,” Bioinformatics, Vol. 21, Suppl. 2, 2005, pp. ii224-ii229. doi:10.1093/bioinformatics/bti1137 [15] X. Xu, L. Wang and D. Ding, “Learning Module Net- works from Genome-Wide Location and Exp Data,” FEBS Letters, Vol. 578, No. 3 ression , 2004, pp. 297-304. doi:10.1016/j.febslet.2004.11.019 [16] B. T. Zhu and A. H. Conney, “Functional Role of Estro- gen Metabolism in Target Cells: Review and Perspec- tives,” Carcinogenesis, Vol. 19, No. 1, 1998, pp. 1-27. doi:10.1093/carcin/19.1.1 [17] C. Förster, S. Mäkela, A. Wärri, S. Kietz, D. Becker, K. Hultenby, M. Warner and J. Gustafsson, “Involvement of Estrogen Receptor β in Terminal Differentiation of Mammary Gland Epithelium,” Proceedings of the Na- tional Academy of Sciences, Vol. 99, No. 24, 2002, pp. 15578- 15583. doi:10.1073/pnas.192561299 [18] K. R. Coser, J. Chesnes, J. Hur, S. Ray, K. J. Isselbacher and T. Shioda, “Global Analysis of Ligand Sensitivity of Estrogen Inducible and Suppressible Genes in mcf7/Bus Breast Cancer Cells by DNA Microarray,” Proceedings of the National Academy of Sciences, Vol. 100, No. 24, 2003, pp. 13994-13999. doi:10.1073/pnas.2235866100 [19] J. Frasor, J. M. Danes, B. Komm, K. C. N. Chang, C. R. Lyttle and B. S. Katzenellenbogen, “Profiling of Estrogen Up- and Down-Regulated Gene Expression in Human Breast Cancer Cells: Insights into Gene Networks and Pathways Underlying Estrogenic Control of Proliferation and Cell Phenotype,” Endocrinology, Vol. 144, No. 10, 2003, pp. 4562-4574. doi:10.1210/en.2003-0567 [20] V. X. Jin, Y. W. Leu, S. Liyanarachchi, H. Sun, M. Fan, K. P. Nephew, T. H. Huang and R. V. Davuluri, “Identi- fying Estrogen Receptor α Target Genes Using Integrated Computational Genomics and Chromatin Immunopre- cipitation Microarray,” Nucleic Acids Research, Vol. 3 No. 22, 2004, pp. 6627-663 2, 5. doi:10.1093/nar/gkh1005 estrogen Receptor [21] A. S. Levenson, I. L. Kliakhandler, K. M. Svoboda, K. M. Pease, S. A. Kaiser, J. E. Ward-III and V. C. Jordan, “Molecular Classification of Selective Oestrogen Recep- tor Modulators on the Basis of Gene Expression Profiles of Breast Cancer Cells Expressing O Copyright © 2012 SciRes. ABCR  L. DE A. LIMA ET AL. Copyright © 2012 SciRes. ABCR 29 α,” British Journal of Cancer, Vol. 87, No. 4, 2002, pp. 449-456. doi:10.1038/sj.bjc.6600477 [22] C. Lin, A. Ström, V. B. Vega, S. L. Kong, A. L. Yeo, J. S. Thomsen, W. C. Chan, B. Doray, D. K. Bangarusamy, A. Ramasamy, L. A. Vergara, S. Tang, A. Chong, V. B. Ba- jic, L. D. Miller, J. Gustafsson and E. T. Liu, “Discovery of Estrogen Receptor α Target Genes and Response Ele- ments in Breast Tumor Cells,” Genome Biology, Vol. 5, No. 9, 2004, pp. 1-18. doi:10.1186/gb-2004-5-9-r66 [23] A. Weisz, W. Basile, C. Scafoglio, L. Altucci, F. Bresciani, A. Facchiano, P. Sismondi, L. Cicatiello and M. Bortoli, “Molecular Identification of ERα-Positive Breast Cancer Cells by the Expression Profile of an Intrinsic Set of Estrogen Regulated Genes,” Journal Cellular Physi- ology, Vol. 200, No. 3, 2004, pp. 440-450. doi:10.1002/jcp.20039 [24] M. L. Whitfield, L. K. George, G. D. Grant and C. M. Perou, “Common Markers of Proliferation,” Nature Re- views, Vol. 6, No. 2, 2006, pp. 99-106. doi:10.1038/nrc1802 [25] M. Ashburner, C. A. Ball, J. A. Blake, D. Botstein, H. Butler, J. M. Cherry, A. P.Davis, K. Dolinski, S. S. Dwight, J. T. Eppig, M. A. Harris, D. P. Hill, L. Is- sel-Tarver, A. Kasarskis, S. Lewis, J. C. Matese, J. E. Richardson, M. Ringwald, G. M. Rubin and G. Sherlock,. “Gene Ontology: Tool for the Unification of Biology,” Nature Genetics, Vol. 25, 2000, pp. 25-29. doi:10.1038/75556 [26] J. Barrera, R. M. Cesar-Jr, D. C. Martins-Jr., R. Z. N. Vêncio, E. F. Merino, M. M. Yamamoto, F. G. Leonardi, C. A. B. Pereira and H. A. del Portillo, “Constructing Probabilistic Genetic Networks of Plasmodium Falcipa- rum from Dynamical Expression Signals of the In- traerythrocytic Development Cycle, Chapter 2,” Springer, Berlin, 2006, pp. 11-26. [27] E. Prifti, J.-D. Zucker, K. Clement and C. Henegar, “Funnet: An Integrative Tool for Exploring Transcrip- tional Interactions,” Bioinformatics, Vol. 24, No. 22, 2008, pp. 2636-2638. doi:10.1093/bioinformatics/btn492 [28] S. Hirohashi and Y. Kanai, “Cell Adhesion System and Human Cancer Morphogenesis,” Cancer Sc No. 7, 2003, pp. 575-58 ience, Vol. 94, 1. doi:10.1111/j.1349-7006.2003.tb01485.x [29] H. Jeong, S. P. Mason, A.-L. Barabasi and Z. N. Oltvai, “Lethality and Centrality in Protein Networks,” Nature, Vol. 411, No. 6833, 2001, pp. 41-42. doi:10.1038/35075138 [30] J. I. Fidler, “Origin and Biology of Cancer Metastasis,” Cytometry, Vol. 10, No. 6, 1989, pp. 673-680. doi:10.1002/cyto.990100602 [31] D. R. Coman, “Adhesiveness and Stickiness: Two Inde- pendent Properties of the Cell Surface,” Cancer Research, , No. 1, 1992, 5-S Vol. 1, 1961, pp. 1436-1438. [32] R. O. Hynes, “Integrins: Versatility, Modulation, and Signaling in Cell Adhesion,” Cell, Vol. 69 pp. 11-25. doi:10.1016/0092-8674(92)9011 of E-Cadherin Cell an Breast Cancer Tissues and . Ruigrok-Ritstier, I. L. van [33] H. Oka, H. Shiozaki, K. Kobayashi, M. Inoue, H. Tahara, T. Kobayashi, Y. Takatsuka, N. Matsuyoshi, S. Mirano, M. Takeichi and T. Mori, “Expression Adhesion Molecules in Hum Its Relationship to Metastasis,” Cancer Research, Vol. 53, No. 7, 1993, pp.1696-1701. [34] J. Helleman, M. P. Jansen, K Staveren, M. P. Look, M. E. M. van Gelder, A. M. Sieu- werts, J. G. Klijn, S. Sleijfer, F J. A. oekens and E. M. Berns, “Association of an Extracellular Matrix Gene Cluster with Breast Cancer Prognosis and Endocrine Therapy Response,” Clinical Cancer Research, Vol. 14, No. 17, 2008, pp. 5555-5564. doi:10.1158/1078-0432.CCR-08-0555 [35] M. P. H. M. Jansen, K. Ruigrok-Ritstier, L. C. J. Dorssers, I. L. van Staveren, M. P. Look, M. E. M. van Gelder, A. M. Sieuwerts, J. Helleman, S. Sleijfer, J. G. M. Klijn, J. A. Foekens and E. M. J. J. Berns, “Down Regulation of Siah2, an Ubiquitin e3 Ligase, Is Associated with Resis- tance to Endocrine Therapy in Breast Cancer,” Breast Cancer Research and Treatment, Vol. 116, No. 2, 2009, pp. 263-271. doi:10.1007/s10549-008-0125-z [36] G. E. Ayala, H. Dai, M. Powell, R. Li, Y. Ding, T. M. Wheeler, D. Shine, D. Kadmon, T. Thompson, B. J. Miles, M. M. Ittmann and D. Rowley, “Cancer-Related Axono- genesis and Neurogenesis in Prostate Cancer,” Clinical Cancer Research, Vol. 14, No. 23, 2008, pp. 7593-7603. doi:10.1158/1078-0432.CCR-08-1164 [37] A. Chédotal, G. Kerjan and C. Moreau-Fauvarque, “The Brain within the Tumor: New Roles for Axon Guidance Molecules in Cancers,” Cell Death Differ, Vol. 12, No. 8, 2005, pp. 1044-1056. doi:10.1038/sj.cdd.4401707
|