 Creative Education 2012. Vol.3, Special Issue, 1006-1015 Published Online October 2012 in SciRes (http://www.SciRP.org/journal/ce) http://dx.doi.org/10.4236/ce.2012.326152 Copyright © 2012 SciRes. 1006 Emerging Trends and Old Habits in Higher Education Management: Focus on the Public vs. Private Funding Debate Federico Barnabè Department of Business and Social Studies, University of Siena, Siena, Italy Email: barnabe@unisi.it Received August 29th, 2012; revised September 28th, 2012; accepted October 10th, 2012 This work takes into consideration the wide reform process that is impacting on Universities all over the world, especially focusing on the public versus private funding debate for Higher Education Institutions. In this regard, the paper provides some considerations on possible funding sources, discusses data related to the relevance of public funding and presents the features of the main models of public funding across many countries, particularly focusing on Europe. Keywords: Higher Education Institutions; Funding Sources; Accountability Mechanisms Preliminary Considerations Trends and Changes within the University System Recently the University has been increasingly challenged to modify its traditional modus operandi and organizational structure in order to meet higher expectations coming from a large number of stakeholders and provide a wider range of products and services of higher quality (Mazza, Quattrone, & Riccaboni, 2008). For academic players, from the institutional level to the indi- vidual/faculty level, such process has implied a profound change and the capacity to address a variety of critical issues. Moreover, such factors have to be analysed in the light of some specific social and economic changes that have characterised modern society in European countries: demographic pressures, public spending cuts, the worldwide financial crisis are just some examples of key factors that have been impacting on the Higher Education (HE) governance system and more specifi- cally on Higher Education Institutions (HEIs) funding system over the last two decades. As a result, modern universities have been forced much more than in the past to develop and implement medium and long term strategies and to focalise their resources, both human and financial ones, toward the achievement of pre-defined and highly remunerative targets. Subsequently, almost everywhere, wide processes of reform have been launched. These processes have progressively changed the traditional model of the univer- sity, now become much more than in the past a sort of entre- preneurial institution, open to competition and to the market, able to sell its research and educational products within a wide and globalised context (Etzkowitz, 2003). Within this frame- work, a crucial point for all the countries and HEIs involved by the reforming process has been to ensure the financial sustain- ability of the higher education sector and its players. More in particular, in most countries such sustainability has been pursued in coherence with a few specific objectives, in- cluding (Eurydice, 2008: p. 7): increasing public funding for higher education; granting more autonomy to institutions for managing finan- cial resources; establishing direct links between results and public funding allocated; encouraging the diversification of funding sources. In many cases, such objectives have been pursued through a general reshuffle of the institutional governance structures in use; in other situations, some countries have developed specific policies aimed at varying the weights of funding sources. Starting from this premise, the article provides some consid- erations on possible funding sources for HEIs, discusses data related to the relevance of public funding for HEIs and presents the features of the main models of public funding across many countries, specifically focusing on Europe. Impacts on University Funding Sources The difference between public and private funding is a rele- vant one and is heavily influenced by the choice between higher or lower control by governmental bodies on HEIs. Generally, it is possible to classify national higher education systems into systems that are primarily coordinated by market interactions—“market-oriented systems”—and systems that are coordinated by governmental planning—“state-oriented sys- tems” (Clark, 1983; Liefner, 2003). In market-oriented systems a large proportion of funding for HEIs is provided by private actors, and competitiveness is a crucial factor for obtaining high levels of funding, simultane- ously assuring qualitative teaching and research activities. The HE system in the United States and more in general in An- glo-Saxon countries is the prototype of a market-oriented sys- tem for both teaching and research activities. On the other hand, in traditional state-coordinated systems, teaching and research activities in HE are strongly managed by government directives, and policies and university funding is mostly provided by the government. These systems are usually less innovative and responsive to changes in demand. In a few European countries it is possible to identify state-oriented sys- tems in which governments (at least partially) plan and manage teaching and research activities as well as organizational mod- 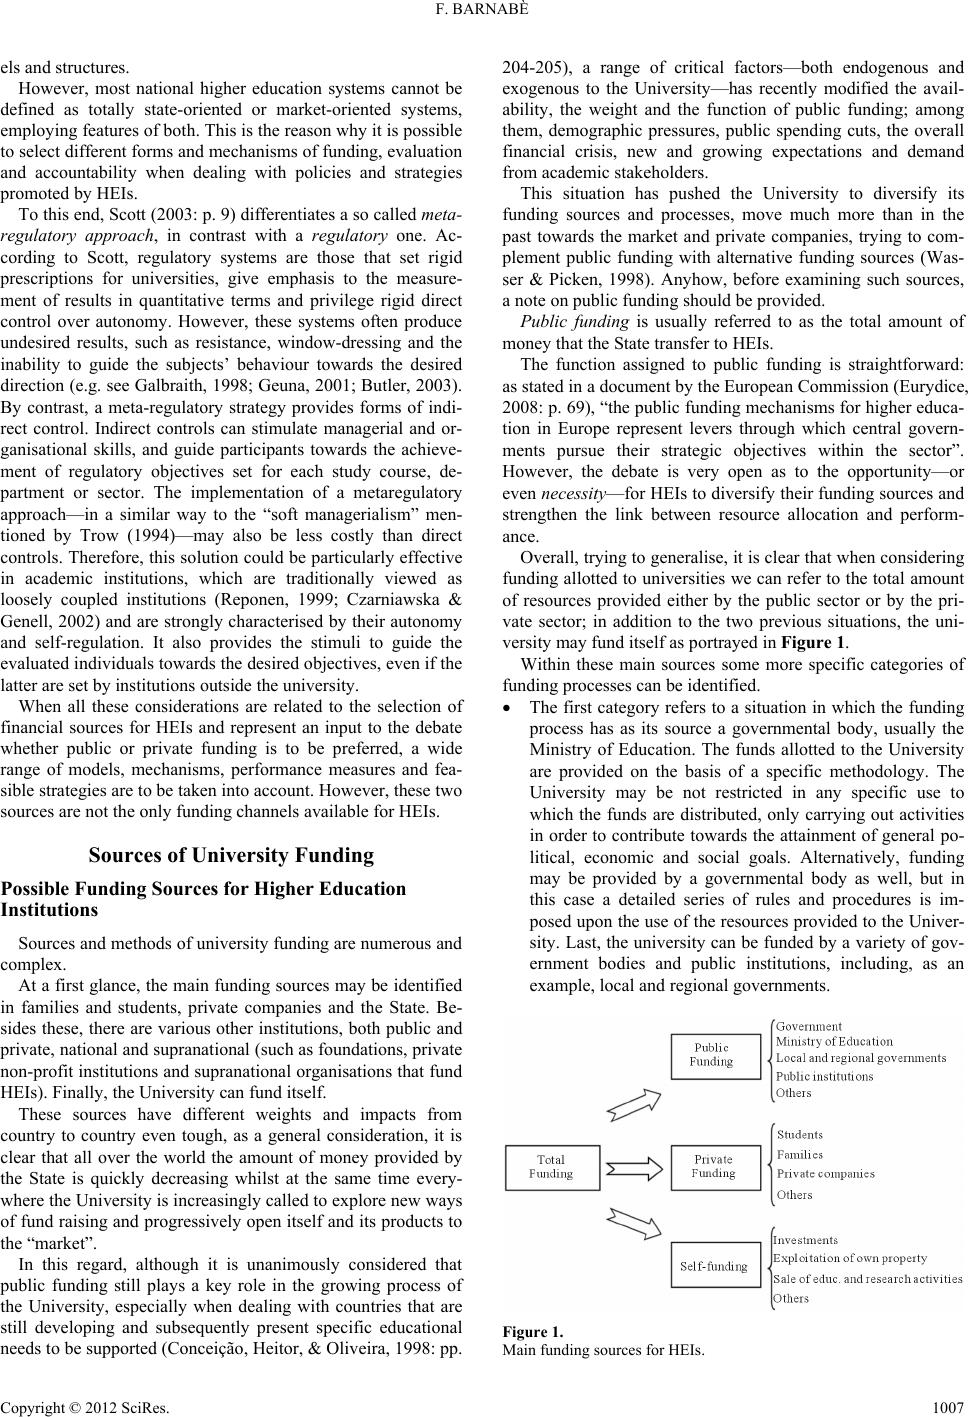 F. BARNABÈ els and structures. However, most national higher education systems cannot be defined as totally state-oriented or market-oriented systems, employing features of both. This is the reason why it is possible to select different forms and mechanisms of funding, evaluation and accountability when dealing with policies and strategies promoted by HEIs. To this end, Scott (2003: p. 9) differentiates a so called meta- regulatory approach, in contrast with a regulatory one. Ac- cording to Scott, regulatory systems are those that set rigid prescriptions for universities, give emphasis to the measure- ment of results in quantitative terms and privilege rigid direct control over autonomy. However, these systems often produce undesired results, such as resistance, window-dressing and the inability to guide the subjects’ behaviour towards the desired direction (e.g. see Galbraith, 1998; Geuna, 2001; Butler, 2003). By contrast, a meta-regulatory strategy provides forms of indi- rect control. Indirect controls can stimulate managerial and or- ganisational skills, and guide participants towards the achieve- ment of regulatory objectives set for each study course, de- partment or sector. The implementation of a metaregulatory approach—in a similar way to the “soft managerialism” men- tioned by Trow (1994)—may also be less costly than direct controls. Therefore, this solution could be particularly effective in academic institutions, which are traditionally viewed as loosely coupled institutions (Reponen, 1999; Czarniawska & Genell, 2002) and are strongly characterised by their autonomy and self-regulation. It also provides the stimuli to guide the evaluated individuals towards the desired objectives, even if the latter are set by institutions outside the university. When all these considerations are related to the selection of financial sources for HEIs and represent an input to the debate whether public or private funding is to be preferred, a wide range of models, mechanisms, performance measures and fea- sible strategies are to be taken into account. However, these two sources are not the only funding channels available for HEIs. Sources of University Funding Possible Funding Sources for Higher Education Institutions Sources and methods of university funding are numerous and complex. At a first glance, the main funding sources may be identified in families and students, private companies and the State. Be- sides these, there are various other institutions, both public and private, national and supranational (such as foundations, private non-profit institutions and supranational organisations that fund HEIs). Finally, the University can fund itself. These sources have different weights and impacts from country to country even tough, as a general consideration, it is clear that all over the world the amount of money provided by the State is quickly decreasing whilst at the same time every- where the University is increasingly called to explore new ways of fund raising and progressively open itself and its products to the “market”. In this regard, although it is unanimously considered that public funding still plays a key role in the growing process of the University, especially when dealing with countries that are still developing and subsequently present specific educational needs to be supported (Conceição, Heitor, & Oliveira, 1998: pp. 204-205), a range of critical factors—both endogenous and exogenous to the University—has recently modified the avail- ability, the weight and the function of public funding; among them, demographic pressures, public spending cuts, the overall financial crisis, new and growing expectations and demand from academic stakeholders. This situation has pushed the University to diversify its funding sources and processes, move much more than in the past towards the market and private companies, trying to com- plement public funding with alternative funding sources (Was- ser & Picken, 1998). Anyhow, before examining such sources, a note on public funding should be provided. Public funding is usually referred to as the total amount of money that the State transfer to HEIs. The function assigned to public funding is straightforward: as stated in a document by the European Commission (Eurydice, 2008: p. 69), “the public funding mechanisms for higher educa- tion in Europe represent levers through which central govern- ments pursue their strategic objectives within the sector”. However, the debate is very open as to the opportunity—or even necessity—for HEIs to diversify their funding sources and strengthen the link between resource allocation and perform- ance. Overall, trying to generalise, it is clear that when considering funding allotted to universities we can refer to the total amount of resources provided either by the public sector or by the pri- vate sector; in addition to the two previous situations, the uni- versity may fund itself as portrayed in Figure 1. Within these main sources some more specific categories of funding processes can be identified. The first category refers to a situation in which the funding process has as its source a governmental body, usually the Ministry of Education. The funds allotted to the University are provided on the basis of a specific methodology. The University may be not restricted in any specific use to which the funds are distributed, only carrying out activities in order to contribute towards the attainment of general po- litical, economic and social goals. Alternatively, funding may be provided by a governmental body as well, but in this case a detailed series of rules and procedures is im- posed upon the use of the resources provided to the Univer- sity. Last, the university can be funded by a variety of gov- ernment bodies and public institutions, including, as an example, local and regional governments. Figure 1. Main funding sources for HEIs. Copyright © 2012 SciRes. 1007 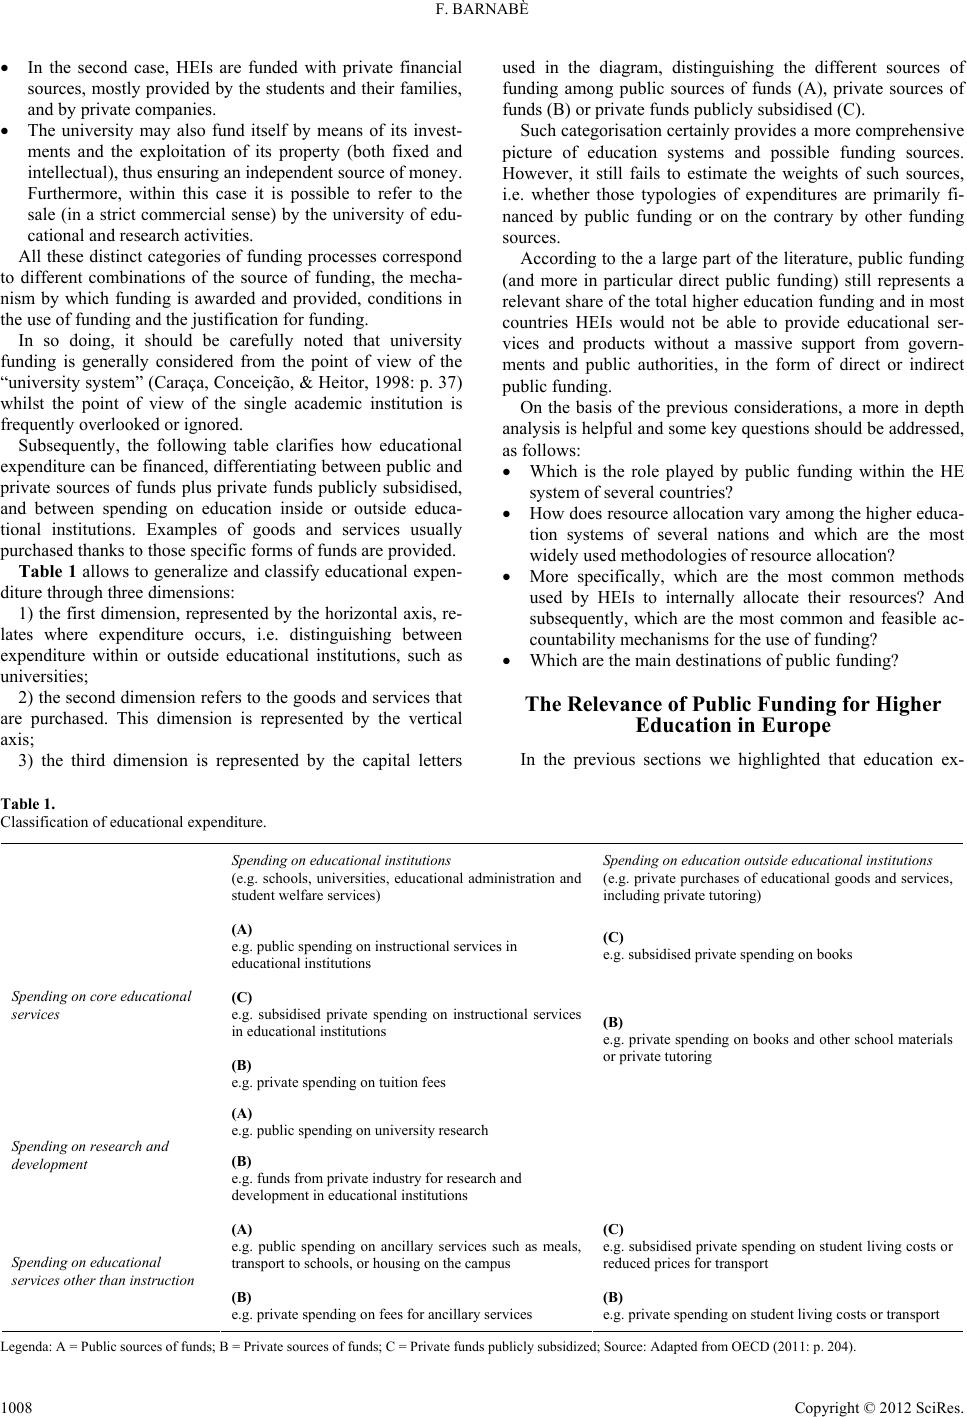 F. BARNABÈ Copyright © 2012 SciRes. 1008 In the second case, HEIs are funded with private financial sources, mostly provided by the students and their families, and by private companies. The university may also fund itself by means of its invest- ments and the exploitation of its property (both fixed and intellectual), thus ensuring an independent source of money. Furthermore, within this case it is possible to refer to the sale (in a strict commercial sense) by the university of edu- cational and research activities. All these distinct categories of funding processes correspond to different combinations of the source of funding, the mecha- nism by which funding is awarded and provided, conditions in the use of funding and the justification for funding. In so doing, it should be carefully noted that university funding is generally considered from the point of view of the “university system” (Caraça, Conceição, & Heitor, 1998: p. 37) whilst the point of view of the single academic institution is frequently overlooked or ignored. Subsequently, the following table clarifies how educational expenditure can be financed, differentiating between public and private sources of funds plus private funds publicly subsidised, and between spending on education inside or outside educa- tional institutions. Examples of goods and services usually purchased thanks to those specific forms of funds are provided. Table 1 allows to generalize and classify educational expen- diture through three dimensions: 1) the first dimension, represented by the horizontal axis, re- lates where expenditure occurs, i.e. distinguishing between expenditure within or outside educational institutions, such as universities; 2) the second dimension refers to the goods and services that are purchased. This dimension is represented by the vertical axis; 3) the third dimension is represented by the capital letters used in the diagram, distinguishing the different sources of funding among public sources of funds (A), private sources of funds (B) or private funds publicly subsidised (C). Such categorisation certainly provides a more comprehensive picture of education systems and possible funding sources. However, it still fails to estimate the weights of such sources, i.e. whether those typologies of expenditures are primarily fi- nanced by public funding or on the contrary by other funding sources. According to the a large part of the literature, public funding (and more in particular direct public funding) still represents a relevant share of the total higher education funding and in most countries HEIs would not be able to provide educational ser- vices and products without a massive support from govern- ments and public authorities, in the form of direct or indirect public funding. On the basis of the previous considerations, a more in depth analysis is helpful and some key questions should be addressed, as follows: Which is the role played by public funding within the HE system of several countries? How does resource allocation vary among the higher educa- tion systems of several nations and which are the most widely used methodologies of resource allocation? More specifically, which are the most common methods used by HEIs to internally allocate their resources? And subsequently, which are the most common and feasible ac- countability mechanisms for the use of funding? Which are the main destinations of public funding? The Relevance of Public Funding for Higher Education in Europe In the previous sections we highlighted that education ex- Table 1. Classification of educational expenditure. Spending on educational institutions (e.g. schools, universities, educational administration and student welfare services) Spending o n education outside educational institutio n s (e.g. private purchases of educational goods and services, including private tutoring) (A) e.g. public spending on instructional services in educational institutions (C) e.g. subsidised private spending on books (C) e.g. subsidised private spending on instructional services in educational institutions Spending o n core educat i onal services (B) e.g. private spending on tuition fees (B) e.g. private spending on books and other school materials or private tutoring (A) e.g. public spending on university research Spending on research and development (B) e.g. funds from private industry for research and development in educational institutions (A) e.g. public spending on ancillary services such as meals, transport to schools, or housing on the campus (C) e.g. subsidised private spending on student living costs or reduced prices for transport Spending on educational services other than instruction (B) e.g. private spending on fees for ancillary services (B) e.g. private spending on student living costs or transport L egenda: A = Public sources of funds; B = Private sources of funds; C = Private funds publicly subsidized; Source: Adapted from OECD (2011: p. 204).  F. BARNABÈ penditure is basically financed by a few distinct forms of fund- ing and mainly by public and private funding. Moreover, we stressed that both public and private funding are necessary to cover HE expenditures, for example when dealing with expen- ditures related to R&D. Additional data are consequently help- ful in providing some evidence. First of all, taking into consideration Gross Domestic Expen- diture on R&D, it is clear that HE still represents a relevant sector for private and public investments, as shown in Table 2. In this scenario, HEIs play a central role. However, their functions go far beyond R&D activities. It is the very essence of HEIs and their educational mission that represent the main rationale to their own existence: create and transfer new knowledge and manage public goods in their educational ser- vices and products. In this regard, it is to note that funding to HEIs is needed to cover a wide range of expenditures, from current expenditures, to investments and specific (research and teaching) projects. Overall, some additional information can be provided taking into consideration the following table that represents the rela- tive proportions (as a %) of public and private expenditure on educational institutions, for tertiary education and for a selec- tion of OECD countries. Table 3 clarifies which are the main funding sources for ter- tiary education across the world. It is straightforward to identify relative weights and sources of funding. As said, although HEIs are increasingly differentiating their funding sources and have been increasingly challenged to find new financing entities, public funding (and more in particular direct public funding) counts for a substantial share of the higher education budget. Table 2. Gross domestic expenditure on R&D (2008). % financed by % performed by Total researchers 2007 Country Million current PPP$ Industry GovernmentIndustry Higher education Government Full time equivalent EU-27 262,985.0 55.0 34.1 63.4 21.8 13.7 1360,332 Total OECD 886,347.1 63.8 28.6 69.6 16.8 11.1 3997,466 Source: OECD/OCDE (2009: p. 1). Table 3. Distribution of public and private sources of funds for educational institutions after transfers from public sources, by year. 2008 2000 Index of change between 2000 and 2008 in expenditure on educational institutions Private sources Country Public sources Household expenditure Expenditure of other private entities All private sources Private: of which, subsidised Public sources All private sources Public sources All private sources Australia 44.8 39.8 15.4 55.2 0.4 49.6 50.4 121 146 Canada 58.7 19.9 21.4 41.3 m 61.0 39.0 121 133 France 81.7 9.6 8.7 18.3 2.4 84.4 15.6 116 141 Ireland 82.6 15.0 2.5 17.4 1.1 79.2 20.8 142 114 Italy 70.7 21.5 7.8 29.3 6.7 77.5 22.5 108 155 Japan 33.3 50.7 16.0 66.7 m 38.5 61.5 100 125 Netherlands 72.6 15.1 12.3 27.4 0.3 76.5 23.5 120 147 New Zealand 70.4 29.6 m 29.6 m m m 156 m Norway 96.9 3.1 m 3.1 m 96.3 3.7 126 106 Spain 78.9 17.0 4.2 21.1 1.7 74.4 25.6 144 112 Sweden 89.1 n 10.9 10.9 a 91.3 8.7 117 151 United Kingdom 34.5 51.5 14.0 65.5 16.3 67.7 32.3 112 278 United States 37.4 41.2 21.5 62.6 m 31.1 68.9 141 107 OECD ave rage 68.9 - - 31.1 3.3 75.1 24.9 131 217 L egenda: a = Data is not applicable because the category does not apply; m = Data is not available; n = Magnitude is either negligible or zero. Source: OECD (2011: p. 244). Copyright © 2012 SciRes. 1009 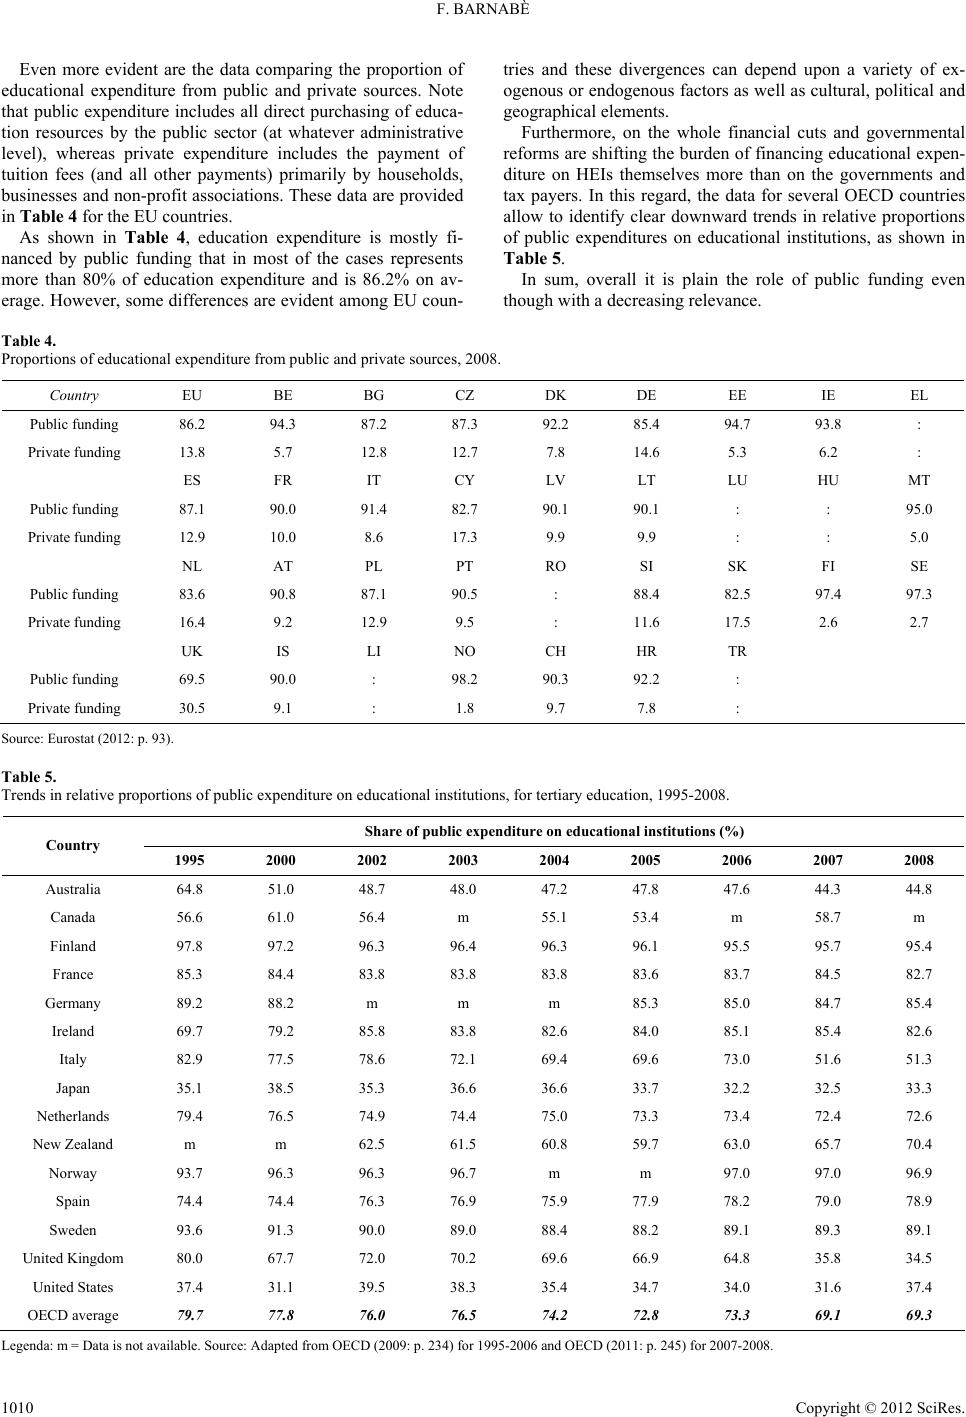 F. BARNABÈ Even more evident are the data comparing the proportion of educational expenditure from public and private sources. Note that public expenditure includes all direct purchasing of educa- tion resources by the public sector (at whatever administrative level), whereas private expenditure includes the payment of tuition fees (and all other payments) primarily by households, businesses and non-profit associations. These data are provided in Table 4 for the EU countries. As shown in Table 4, education expenditure is mostly fi- nanced by public funding that in most of the cases represents more than 80% of education expenditure and is 86.2% on av- erage. However, some differences are evident among EU coun- tries and these divergences can depend upon a variety of ex- ogenous or endogenous factors as well as cultural, political and geographical elements. Furthermore, on the whole financial cuts and governmental reforms are shifting the burden of financing educational expen- diture on HEIs themselves more than on the governments and tax payers. In this regard, the data for several OECD countries allow to identify clear downward trends in relative proportions of public expenditures on educational institutions, as shown in Table 5. In sum, overall it is plain the role of public funding even though with a decreasing relevance. Table 4. Proportions of educational expenditure from public and private sources, 2008. Country EU BE BG CZ DK DE EE IE EL Public funding 86.2 94.3 87.2 87.3 92.2 85.4 94.7 93.8 : Private funding 13.8 5.7 12.8 12.7 7.8 14.6 5.3 6.2 : ES FR IT CY LV LT LU HU MT Public funding 87.1 90.0 91.4 82.7 90.1 90.1 : : 95.0 Private funding 12.9 10.0 8.6 17.3 9.9 9.9 : : 5.0 NL AT PL PT RO SI SK FI SE Public funding 83.6 90.8 87.1 90.5 : 88.4 82.5 97.4 97.3 Private funding 16.4 9.2 12.9 9.5 : 11.6 17.5 2.6 2.7 UK IS LI NO CH HR TR Public funding 69.5 90.0 : 98.2 90.3 92.2 : Private funding 30.5 9.1 : 1.8 9.7 7.8 : Source: Eurostat (2012: p. 93). Table 5. Trends in relative proportions of public expenditure on educational institutions, for tertiary education, 1995-2008. Share of public expenditure on educational institu t i ons (%) Country 1995 2000 2002 2003 2004 2005 2006 2007 2008 Australia 64.8 51.0 48.7 48.0 47.2 47.8 47.6 44.3 44.8 Canada 56.6 61.0 56.4 m 55.1 53.4 m 58.7 m Finland 97.8 97.2 96.3 96.4 96.3 96.1 95.5 95.7 95.4 France 85.3 84.4 83.8 83.8 83.8 83.6 83.7 84.5 82.7 Germany 89.2 88.2 m m m 85.3 85.0 84.7 85.4 Ireland 69.7 79.2 85.8 83.8 82.6 84.0 85.1 85.4 82.6 Italy 82.9 77.5 78.6 72.1 69.4 69.6 73.0 51.6 51.3 Japan 35.1 38.5 35.3 36.6 36.6 33.7 32.2 32.5 33.3 Netherlands 79.4 76.5 74.9 74.4 75.0 73.3 73.4 72.4 72.6 New Zealand m m 62.5 61.5 60.8 59.7 63.0 65.7 70.4 Norway 93.7 96.3 96.3 96.7 m m 97.0 97.0 96.9 Spain 74.4 74.4 76.3 76.9 75.9 77.9 78.2 79.0 78.9 Sweden 93.6 91.3 90.0 89.0 88.4 88.2 89.1 89.3 89.1 United Kingdom 80.0 67.7 72.0 70.2 69.6 66.9 64.8 35.8 34.5 United States 37.4 31.1 39.5 38.3 35.4 34.7 34.0 31.6 37.4 OECD average 79.7 77.8 76.0 76.5 74.2 72.8 73.3 69.1 69.3 L egenda: m = Data is not available. Source: Adapted from OECD (2009: p. 234) for 1995-2006 and OECD (2011: p. 245) for 2007-2008. Copyright © 2012 SciRes. 1010 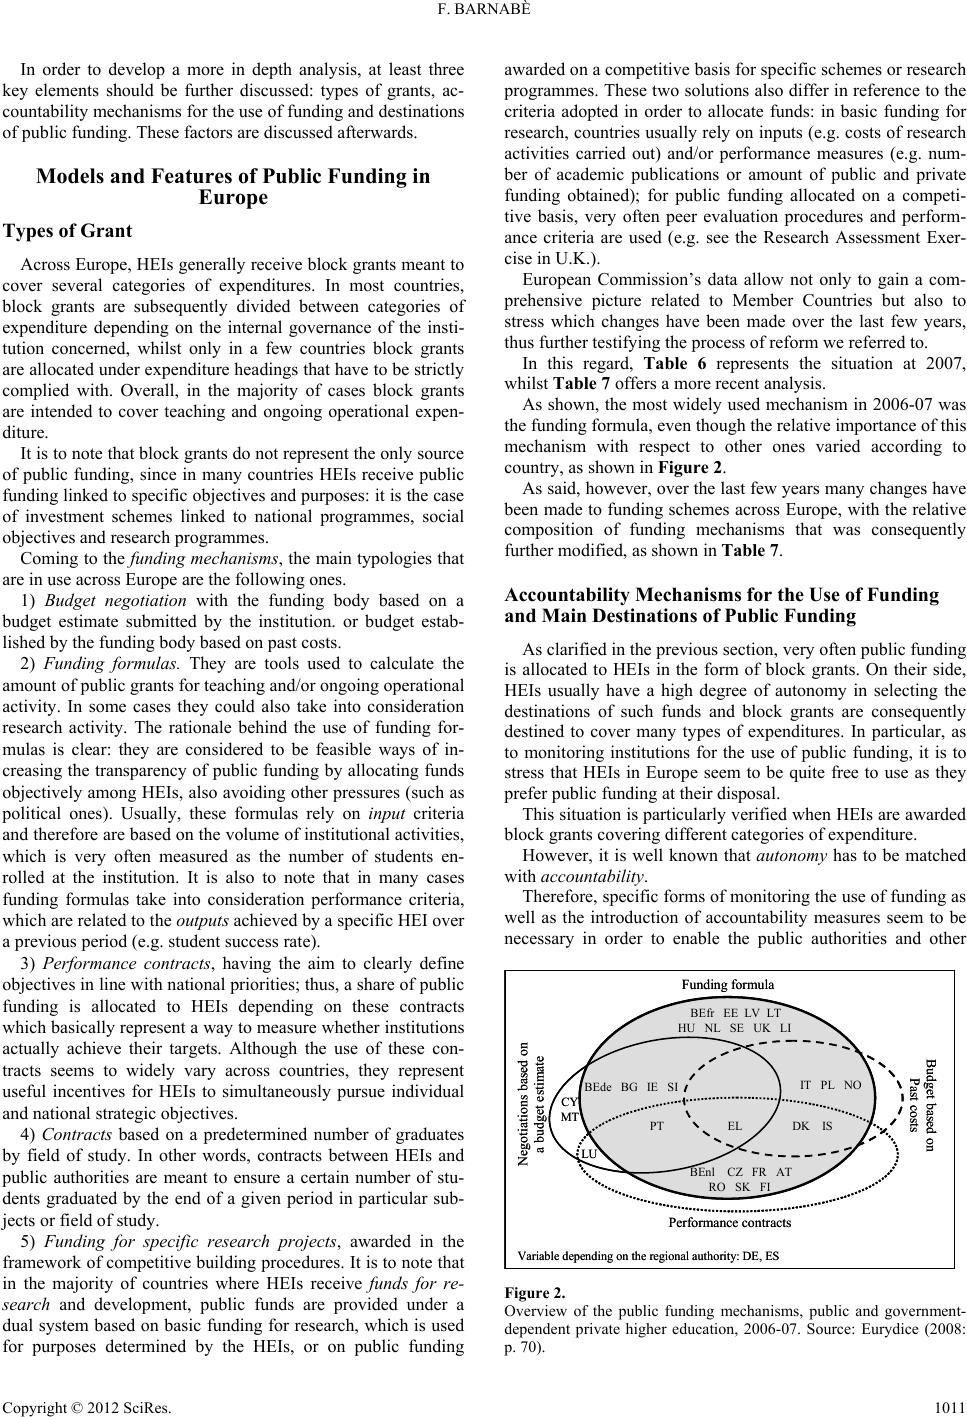 F. BARNABÈ In order to develop a more in depth analysis, at least three key elements should be further discussed: types of grants, ac- countability mechanisms for the use of funding and destinations of public funding. These factors are discussed afterwards. Models and Features of Public Funding in Europe Types of Grant Across Europe, HEIs generally receive block grants meant to cover several categories of expenditures. In most countries, block grants are subsequently divided between categories of expenditure depending on the internal governance of the insti- tution concerned, whilst only in a few countries block grants are allocated under expenditure headings that have to be strictly complied with. Overall, in the majority of cases block grants are intended to cover teaching and ongoing operational expen- diture. It is to note that block grants do not represent the only source of public funding, since in many countries HEIs receive public funding linked to specific objectives and purposes: it is the case of investment schemes linked to national programmes, social objectives and research programmes. Coming to the funding mechanisms, the main typologies that are in use across Europe are the following ones. 1) Budget negotiation with the funding body based on a budget estimate submitted by the institution. or budget estab- lished by the funding body based on past costs. 2) Funding formulas. They are tools used to calculate the amount of public grants for teaching and/or ongoing operational activity. In some cases they could also take into consideration research activity. The rationale behind the use of funding for- mulas is clear: they are considered to be feasible ways of in- creasing the transparency of public funding by allocating funds objectively among HEIs, also avoiding other pressures (such as political ones). Usually, these formulas rely on input criteria and therefore are based on the volume of institutional activities, which is very often measured as the number of students en- rolled at the institution. It is also to note that in many cases funding formulas take into consideration performance criteria, which are related to the outputs achieved by a specific HEI over a previous period (e.g. student success rate). 3) Performance contracts, having the aim to clearly define objectives in line with national priorities; thus, a share of public funding is allocated to HEIs depending on these contracts which basically represent a way to measure whether institutions actually achieve their targets. Although the use of these con- tracts seems to widely vary across countries, they represent useful incentives for HEIs to simultaneously pursue individual and national strategic objectives. 4) Contracts based on a predetermined number of graduates by field of study. In other words, contracts between HEIs and public authorities are meant to ensure a certain number of stu- dents graduated by the end of a given period in particular sub- jects or field of study. 5) Funding for specific research projects, awarded in the framework of competitive building procedures. It is to note that in the majority of countries where HEIs receive funds for re- search and development, public funds are provided under a dual system based on basic funding for research, which is used for purposes determined by the HEIs, or on public funding awarded on a competitive basis for specific schemes or research programmes. These two solutions also differ in reference to the criteria adopted in order to allocate funds: in basic funding for research, countries usually rely on inputs (e.g. costs of research activities carried out) and/or performance measures (e.g. num- ber of academic publications or amount of public and private funding obtained); for public funding allocated on a competi- tive basis, very often peer evaluation procedures and perform- ance criteria are used (e.g. see the Research Assessment Exer- cise in U.K.). European Commission’s data allow not only to gain a com- prehensive picture related to Member Countries but also to stress which changes have been made over the last few years, thus further testifying the process of reform we referred to. In this regard, Table 6 represents the situation at 2007, whilst Table 7 offers a more recent analysis. As shown, the most widely used mechanism in 2006-07 was the funding formula, even though the relative importance of this mechanism with respect to other ones varied according to country, as shown in Figure 2. As said, however, over the last few years many changes have been made to funding schemes across Europe, with the relative composition of funding mechanisms that was consequently further modified, as shown in Table 7. Accountability Mechanisms for the Use of Funding and Main Destinations of Public Funding As clarified in the previous section, very often public funding is allocated to HEIs in the form of block grants. On their side, HEIs usually have a high degree of autonomy in selecting the destinations of such funds and block grants are consequently destined to cover many types of expenditures. In particular, as to monitoring institutions for the use of public funding, it is to stress that HEIs in Europe seem to be quite free to use as they prefer public funding at their disposal. This situation is particularly verified when HEIs are awarded block grants covering different categories of expenditure. However, it is well known that autonomy has to be matched with accountability. Therefore, specific forms of monitoring the use of funding as well as the introduction of accountability measures seem to be necessary in order to enable the public authorities and other Fundingformula Performance contracts Negotiationsbasedon a budget estimate Budget based on Past costs BEfrEE LV LT HU NL SE UK LI IT PL NO DK ISELPT LU CY MT BEdeBG IE SI BEnlCZ FR AT RO SK FI Variabledependingon the regionalauthority: DE, ES Fundingformula Performance contracts Negotiationsbasedon a budget estimate Budget based on Past costs BEfrEE LV LT HU NL SE UK LI IT PL NO DK ISELPT LU CY MT BEdeBG IE SI BEnlCZ FR AT RO SK FI Variabledependingon the regionalauthority: DE, ES Figure 2. Overview of the public funding mechanisms, public and government- dependent private higher education, 2006-07. Source: Eurydice (2008: . 70). p Copyright © 2012 SciRes. 1011  F. BARNABÈ Table 6. Main mechanisms for direct public funding, public and government-dependent private higher education, 2006-07. BE fr BE de BE nl BGCZDKDEEEIEELESFRIT CY LV LTLU Budget negotiation with the funding body ● ● ● ● ● ● Budget based on past costs ● ● ● Funding formula ● ● ● ● ● ● ● ● ● ● ● ● ● Performance contracts based on strategic objectives ● ● ● ● ● ● Contracts based on a predetermined number of graduates ● ● Funding for specific research projects, ● ● ● ● ● ● ○ ● ● ● ○ ● ● ● n.a. HU MT NL ATPLPTROSISKFISE UK-ENG /WLS/NIR UK-SCT IS LI NO Budget negotiation with the funding body ● ● ● Budget based on past costs ● ● ● Funding formula ● ● ● ● ● ● ● ● ● ● ● ● ● ● ● Performance contracts based on strategic objectives ● ● ● ● ● ● Contracts based on a predetermined number of graduates Funding for specific research projects ● ● ● ● ● ● ● ● ● ● ● ● ● ● ● ● Table 7. Main funding mechanisms for European HEIs, 2011. BE fr BE de BE nl BG CZDKDEEEIEELESFR IT CY LV LTLU Negotiated allocation ● : : Purpose-specific funding ● ● : ● : Performance-based mechanisms ● ● : ● ● : Input-based mechanism ● ● ● : ● ● ● ● ● : Other ● : ● ● : HU MTNL AT PLPTROSISKFISEUK-ENG /WLS/NIR UK-SCT IS LI NOTR Negotiated allocation ● : ● : ● ● ● ● ● ● ● Purpose-specific funding : ● : ● ● ● ● ● Performance-based mechanisms : : ● ● ● ● ● ● ● Input-based mechanism ● : : ● ● ● Other : : Source: Eurydice (2012: p. 38). stakeholders to perform desired control and design financial and strategic policies. Moreover, accountability measures would serve as a reliable and useful regulating mechanism to assure institutional autonomy. Common forms of accountability measures and mechanisms include financial audits, perform- ance indicators, annual reports, production of information da- tabases, and publication of internal evaluation results. European Commission’s data allow to present the following picture related to Member Countries. As shown by the Table 8, financial audits are a quite com- mon way of ensuring accountability. Such audits can be carried out by independent external bodies (e.g. a national or regional body) or can be performed internally by the HEIs themselves. Performance indicators are a second common way to ensure Copyright © 2012 SciRes. 1012  F. BARNABÈ Table 8. Accountability measures in relation to use of public funding, public and government-dependent private higher education, 2006-07. BE fr BE de BE nl BG CZDKDEEEIEELESFR IT CY LV LTLU Compulsory external financial audits ● ● ● ● ● ● ● ● ● ● ● ● ● ● ● Compulsory internal financial audits ● ● ● ● ● ● Public funding related to performance indicators ● ● ● ● ● ● ● ● ● ● Public funding related to the fulfillment of institutional strategic plans/objectives ● ● ○ ● ○ ● HU MT NL AT PLPTROSISKFISEUK-ENG /WLS/NIR UK-SCT IS LI NO Compulsory external financial audits ● ● ● ● ● ● ● ● ● ● ● ● ● ● ● ● Compulsory internal financial audits ● ● ● ● ● ● ● ● Public funding related to performance indicators ● ● ● ● ● ● ● ● ● ● ● ● ● ● ● Public funding related to the fulfillment of institutional strategic plans/objectives ● ● ● Legenda: ● = Accountability measure used; ○ = Variable depending on the regional authority. Source: Eurydice (2008: p. 64). accountability. Many countries are held accountable for their use of public funding by linking at least a part of the amount to performance, obviously with different weights for such meas- ures into the funding formulas used to calculate the public block grants and research grants. Last, in almost all countries institutional strategic plans are compulsory. Therefore, they represent a useful tool not only to measure the institutional accomplishments, but also to influence the allocation of public funding to each HEI. As to the main destinations of public funding, the expendi- tures by educational institutions can be classified into two main categories: current expenditure and capital expenditure. Overall, current expenditure is the largest one, including cost items such as wages and costs relating to staff, costs of main- taining buildings, purchasing educational materials and opera- tional resources. Among these, staff expenditure represents the largest cost item, being an average of 70% of annual expendi- ture in the EU, as portrayed in Table 9. As shown, current expenditure weights for more than 91% on the total amount of expenditure by public sector institutions in almost all the EU countries, thus demonstrating a high degree of homogeneity across Europe. On the contrary, more signifi- cant differences can be found taking into consideration the relative proportion of capital expenditure in each country. Discussion and Final Remarks on Changes in University Public Funding From the information and considerations provided in the previous sections, it is clear that HE funding sources have been differentiated across different countries in the last decades. This process has happened in concomitance with the passage from the elite university system to the “mass higher education” and within a context increasingly characterised by cuts and rationalizations in public expenditures and funding. In many countries these factors fundamentally led to two situations: a) the diversification of funding sources for HEIs, with an increased relevance given to private funding and a higher em- phasis placed on the capacity of universities to exploit their own capital and knowledge; b) the diversification of public funding procedures and allo- cation mechanisms, more often than in the past linked to per- formance and oriented towards competition among universities and HE systems. In this scenario, HEIs can be currently viewed as cost-shar- ing systems (Johnstone, 2004) in which at least four principal parties co-participate in financing universities and higher edu- cation activities: the government or taxpayers, parents, students and individual or institutional donors. Across different coun- tries the tendency towards cost-sharing seems to be clear, being caused by specific phenomena such as the dramatic increase in the number of students over the last three decades, the substan- tial decrease in direct public funding to universities, the enor- mous pressures upon academic institutions to provide qualita- tive research and teaching outputs, the higher costs of higher education (both per unit and per student costs). However, even though cost-sharing and funding diversification seem rational and in some way foreseeable events, they are still controversial and under debate. In particular, the decision of most governments to grant more autonomy to institutions (not only for managing financial re- sources but also in terms of statutory and managerial autonomy) has pushed HE systems and HEIs toward a greater diversifica- tion of funding sources, the establishment of more direct links between results and the amount of funds allocated, the creation of partnerships between HEIs and private businesses, research institutes and regional authorities, the exploitation of their own properties. In brief, it seems t at the university is rapidly h Copyright © 2012 SciRes. 1013 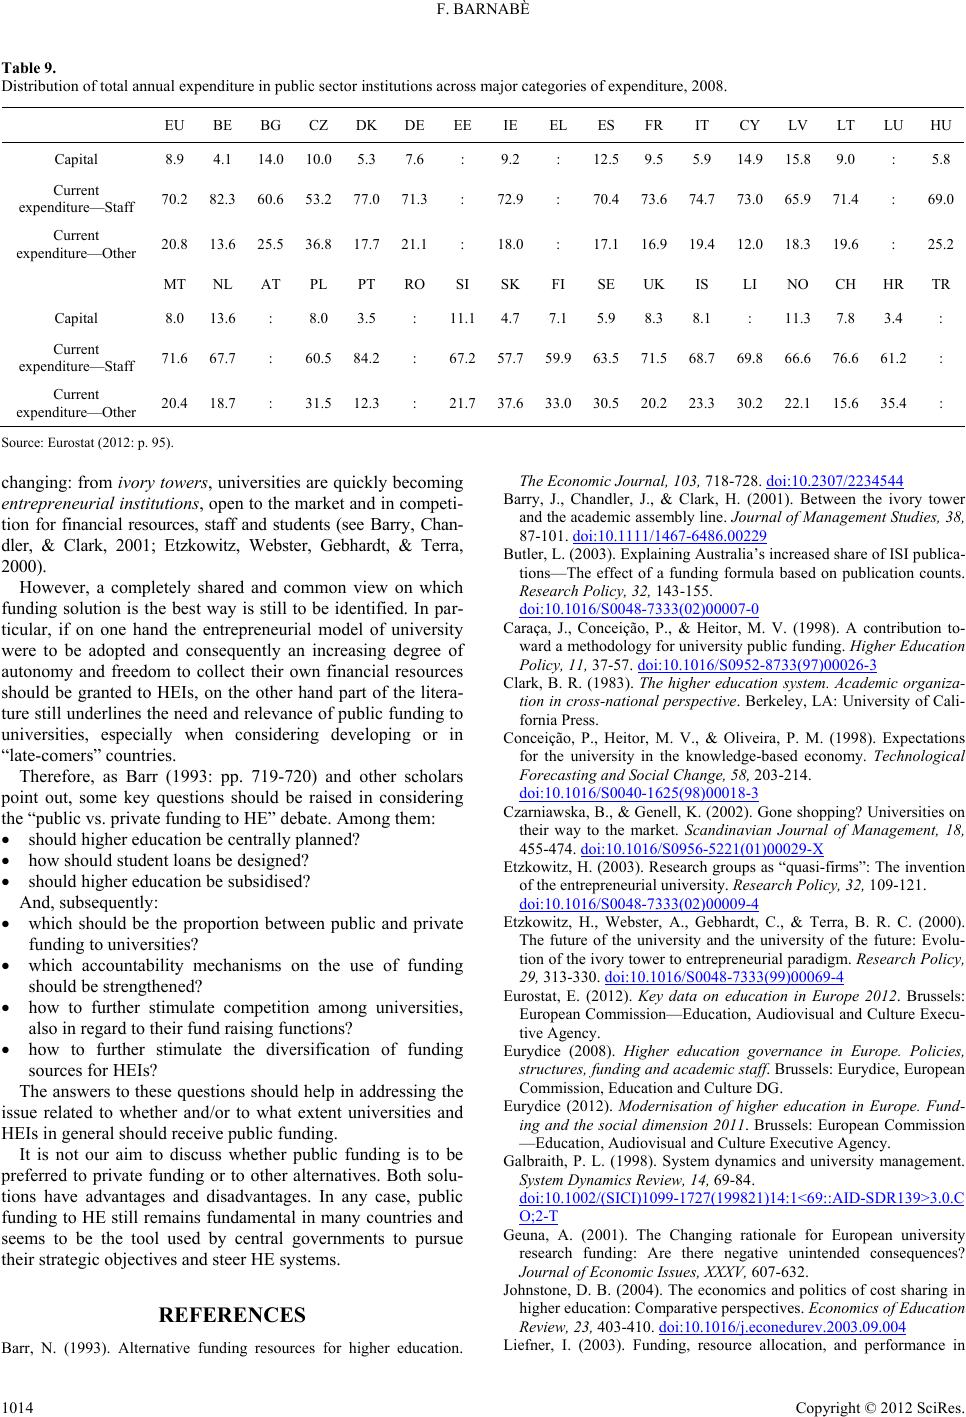 F. BARNABÈ Table 9. Distribution of total annual expenditure in public sector institutions across major categories of expenditure, 2008. EU BE BG CZ DK DEEEIE ELES FR IT CY LV LT LUHU Capital 8.9 4.1 14.0 10.0 5.3 7.6: 9.2: 12.59.5 5.914.9 15.8 9.0 : 5.8 Current expenditure—Staff 70.2 82.3 60.6 53.2 77.0 71.3: 72.9: 70.4 73.6 74.7 73.0 65.9 71.4 : 69.0 Current expenditure—Other 20.8 13.6 25.5 36.8 17.7 21.1: 18.0: 17.1 16.9 19.4 12.0 18.3 19.6 : 25.2 MT NL AT PL PT ROSI SKFI SE UKIS LI NO CH HRTR Capital 8.0 13.6 : 8.0 3.5 : 11.14.77.15.98.38.1 : 11.3 7.8 3.4 : Current expenditure—Staff 71.6 67.7 : 60.5 84.2: 67.2 57.7 59.9 63.5 71.5 68.7 69.8 66.6 76.6 61.2: Current expenditure—Other 20.4 18.7 : 31.5 12.3: 21.7 37.6 33.0 30.5 20.2 23.3 30.2 22.1 15.6 35.4: Source: Eurostat (2012: p. 95). changing: from ivory towers, universities are quickly becoming entrepreneurial institutions, open to the market and in competi- tion for financial resources, staff and students (see Barry, Chan- dler, & Clark, 2001; Etzkowitz, Webster, Gebhardt, & Terra, 2000). However, a completely shared and common view on which funding solution is the best way is still to be identified. In par- ticular, if on one hand the entrepreneurial model of university were to be adopted and consequently an increasing degree of autonomy and freedom to collect their own financial resources should be granted to HEIs, on the other hand part of the litera- ture still underlines the need and relevance of public funding to universities, especially when considering developing or in “late-comers” countries. Therefore, as Barr (1993: pp. 719-720) and other scholars point out, some key questions should be raised in considering the “public vs. private funding to HE” debate. Among them: should higher education be centrally planned? how should student loans be designed? should higher education be subsidised? And, subsequently: which should be the proportion between public and private funding to universities? which accountability mechanisms on the use of funding should be strengthened? how to further stimulate competition among universities, also in regard to their fund raising functions? how to further stimulate the diversification of funding sources for HEIs? The answers to these questions should help in addressing the issue related to whether and/or to what extent universities and HEIs in general should receive public funding. It is not our aim to discuss whether public funding is to be preferred to private funding or to other alternatives. Both solu- tions have advantages and disadvantages. In any case, public funding to HE still remains fundamental in many countries and seems to be the tool used by central governments to pursue their strategic objectives and steer HE systems. REFERENCES Barr, N. (1993). Alternative funding resources for higher education. The Economic Journal, 103, 718-728. doi:10.2307/2234544 Barry, J., Chandler, J., & Clark, H. (2001). Between the ivory tower and the academic assembly line. Journal of Management Studies, 38, 87-101. doi:10.1111/1467-6486.00229 Butler, L. (2003). Explaining Australia’s increased share of ISI publica- tions—The effect of a funding formula based on publication counts. Research Policy, 32, 143-155. doi:10.1016/S0048-7333(02)00007-0 Caraça, J., Conceição, P., & Heitor, M. V. (1998). A contribution to- ward a methodology for university public funding. Higher Education Policy, 11, 37-57. doi:10.1016/S0952-8733(97)00026-3 Clark, B. R. (1983). The higher education system. Academic organiza- tion in cross-national perspective. Berkeley, LA: University of Cali- fornia Press. Conceição, P., Heitor, M. V., & Oliveira, P. M. (1998). Expectations for the university in the knowledge-based economy. Technological Forecasting and Social Change, 58, 203-214. doi:10.1016/S0040-1625(98)00018-3 Czarniawska, B., & Genell, K. (2002). Gone shopping? Universities on their way to the market. Scandinavian Journal of Management, 18, 455-474. doi:10.1016/S0956-5221(01)00029-X Etzkowitz, H. (2003). Research groups as “quasi-firms”: The invention of the entrepreneurial university. Research Policy, 32, 109-121. doi:10.1016/S0048-7333(02)00009-4 Etzkowitz, H., Webster, A., Gebhardt, C., & Terra, B. R. C. (2000). The future of the university and the university of the future: Evolu- tion of the ivory tower to entrepreneurial paradigm. Research Policy, 29, 313-330. doi:10.1016/S0048-7333(99)00069-4 Eurostat, E. (2012). Key data on education in Europe 2012. Brussels: European Commission—Education, Audiovisual and Culture Execu- tive Agency. Eurydice (2008). Higher education governance in Europe. Policies, structures, funding and academic staff. Brussels: Eurydice, European Commission, Education and Culture DG. Eurydice (2012). Modernisation of higher education in Europe. Fund- ing and the social dimension 2011. Brussels: European Commission —Education, Audiovisual and Culture Executive Agency. Galbraith, P. L. (1998). System dynamics and university management. System Dynamics Review, 14, 69-84. doi:10.1002/(SICI)1099-1727(199821)14:1<69::AID-SDR139>3.0.C O;2-T Geuna, A. (2001). The Changing rationale for European university research funding: Are there negative unintended consequences? Journal of Economic Issues, XXXV, 607-632. Johnstone, D. B. (2004). The economics and politics of cost sharing in higher education: Comparative perspectives. Economics of Education Review, 23, 403-410. doi:10.1016/j.econedurev.2003.09.004 Liefner, I. (2003). Funding, resource allocation, and performance in Copyright © 2012 SciRes. 1014  F. BARNABÈ higher education systems. Higher Education, 46, 469-489. doi:10.1023/A:1027381906977 Mazza, C., Quattrone, P., & Riccaboni, A. (Eds.) (2008). European uni- versities in transition: Issues, models and cases. Cheltenham: Edward Elgar Publishing Limited. OECD (2009). Education at a glance 2009: OECD indicators. Paris: OECD Publishing. OECD (2011). Education at a glance 2011: OECD indicators. Paris: OECD Publishing. OECD/OCDE (2009). Main science and technology indicators, Volume 2009, Issue 1. Paris: OECD Publishing. Reponen, T. (1999). Is leadership possible at loosely coupled organiza- tions such as universities? Higher Education Policy, 12, 237-244. doi:10.1016/S0952-8733(99)00013-6 Scott, C. (2003). Controlling the campus. Risk & Regulation, 5, 9. Trow, M. (1994). Managerialism and the academic profession: The case of England. Highe r Education Policy, 7, 11-18. doi:10.1057/hep.1994.13 Wasser, H., & Picken, R. (1998). Changing circumstances in funding public universities: A comparative view. Higher Education Policy, 11, 29-35. doi:10.1016/S0952-8733(97)00025-1 Copyright © 2012 SciRes. 1015
|