 Creative Education 2012. Vol.3, Special Issue, 959-970 Published Online October 2012 in SciRes (http://www.SciRP.org/journal/ce) http://dx.doi.org/10.4236/ce.2012.326146 Copyright © 2012 SciRes. 959 Measurement Properties of the Arabic Lebanon Version of the Pediatric Quality of Life Inventory 4.0 Generic Core Scales for Young Child (5 - 7 Years), and Child Aged 8 - 12 Years: Quality of Life in Urban and Rural Children in Lebanon Ibtissam Sabbah1, Hala Sabbah2, Sanaa Sabbah3, Hussein Akoum1, Nabil Droubi1*, Mariette Mercier4 1Faculty of Public Health, Lebanese University, Saida, Lebanon 2Faculty of Economic Sciences and Business Administration, Lebanese University, Nabatieh, Lebanon 3Doctoral School of Literature, Humanities & Social Sciences—Lebanese University, and Institute of Social Science—Lebanese University, Nabatieh, Lebanon 4Department of Biostatistics, Faculty of Medicine and Pharmacy, Franche Comte Univerity, Besançon, France Email: *nsdroubi@inco.com.lb Received August 25th, 2012; revised September 24th, 2012; accepted October 9th, 2012 Background: Health-related quality of life (HRQOL) is recognized as an important health outcome measurement for pediatric patients. HRQOL in children is needed to gain a better understanding of the impact of public policies, interventions, therapies, and the prediction of health and social care need. In view of the lack of reliable HRQOL instruments for children in Arabic, the present study aims to translate the PedsQLTM4.0 self-report and proxy-report for young child (aged 5 - 7 years), and child (aged 8 - 12 years), evaluate psychometric properties of the Arabic Lebanon version; and to evaluate HRQOL of chil- dren in rural and urban areas in Lebanon. Methods: PedsQLTM4.0 was translated and adapted into Arabic using the standard approach provided by Varni J. W. The Arabic version was administered to a represen- tative sample of 368 children aged 5 - 12 years and their parents. The psychometric properties were then evaluated. Results: The rate of missing data for self-report and proxy-report was very low (0.51% and 0.46% of items). All child self-report, and parent proxy-report subscales exceeded the minimum reliabil- ity standard of 0.70 for alpha coefficient, except emotional subscale of young child self-report and proxy-report, and, the social subscale of child self-report (alphas ranging from 0.60 to 0.66). Factor analysis yielded patterns of factor correlation comparable to the original version. The emotional function- ing of children is low, where most children feel afraid, sad, and angry. Children resident in rural areas had higher social scores than those in urban areas. The HRQOL of girls is higher than boys; Children under- going treatment for cancer rated their HRQOL as poorer in all dimensions. Conclusions: The results support the validity of the PedsQLTM4.0 self-report and proxy-report Arabic version. Habitat has a minor influence on HRQOL of children. Further psychometric evaluation in a larger sample of children, in other departments of Lebanon is recommended to provide firmer conclusions. Keywords: PedsQLTM4.0; Health Related Quality of Life; Urban; Cross-Sectional Study; Arabic Lebanon; Young Child Introduction The last decade has witnessed a dramatic increase in the de- velopment and utilization of pediatric health-related quality of life (HRQOL) measures (Varni, Burwinkle, & Lane, 2005; Varni, Limbers, & Burwinkle, 2007; Solans et al., 2008; MAPI Research Institute) that focuses on individual’s subjective evaluation of physical and psychological status and overall sense of well-being (Sabbah et al., 2003; Mistry, Stevens, & Gorelick, 2009; Giannakopoulos et al., 2009; Stevanovic, 2009) (Eshaghi, Ramezani, Shahsanaee, & Pooya, 2006; Berkes et al., 2010). International studies on HRQOL in children are needed to gain a better understanding of the impact of public policies, interventions, therapies (Schmidt, Wenninger, Niemann, Wahn, & Staab, 2009), evaluation of interventions, and the prediction of health and social care need (Sabbah et al., 2003; Hatzmann, Maurice-Stam, Heymans, & Grootenhuis, 2009; Panepinto, Hoffmann, & Pajewski, 2009). However, HRQOL research in children presents many chal- lenges as for age specification, and the proxy report problem (Varni et al., 2007; Verrips et al., 1999; Matza, Swensen, Flood, Secnik, & Leidy, 2004; Tarride et al., 2010). Many existing questionnaires and scoring systems for adults are not applicable to children. Also, it may be difficult in some cases to separate the true effect of a healthcare intervention from the normal development of the children (e.g. autonomy behavior; Verrips et al., 1999; Tarride et al., 2010). The parent proxy-report in- struments are required in situations when children are unable to provide self-report (Varni et al., 2007; Solans et al., 2008), in *Corresponding author.  I. SABBAH ET AL. case of children are too ill, unwilling or lacking the necessary language skills (Solans et al., 2008). Appropriate HRQOL measures should be available across different cultures. HRQOL tools must always be adapted when used in a new environment, because the perception of quality of life differs according to the individual situations (Sabbah et al., 2003; Stevanovic, 2009; Matza et al., 2004; Bollinger, Power, Aaronson, Cella, & Anderson, 1996; Varni, Burwinkle, Seid, & Skarr, 2003; Varni, et al., 1999; Varni, et al., 2001; Varni, et al., 2002; Chan, Mangione-Smith, Burwinkle, Rosen, & Varni, 2005; Varni & Limbers, 2009; Torres et al., 2009; Reinfjell, Diseth, Veenstra, & Vikan, 2006). Translation should not only ensure measurement equivalence between the original and new versions, but also respecting the cultural distinctions of the new ones. Cross-cultural adaptation is necessary in order to make possible the collection of information in other cultures (Ste- vanovic, 2009; Torres et al., 2009). Several generic instruments are available to assess children’s HRQOL based on self-reports as well as proxy-reports from parents (Stevanovic, 2009; Verrips et al., 1999; Torres et al., 2009) (http://www.pedsql.org) (Estrada et al., 2010; Harrison et al., 2010). For our purpose, the PedsQL4.0 generic module represented a particularly attractive generic measure as it has been widely used in children and adolescent integrating generic core scales and disease-specific modules into one measurement system it is translated into many international languages (Berkes et al., 2010; Reinfjellet al., 2006; Sato et al., 2010) (http://www.pedsql.org) (Upton et al., 2005; Gkoltsiou et al., 2008; Bek, Simsek, Erel, Yakut, & Uygur, 2009). To the au- thors’ knowledge, the Arabic version has not previously been assessed for validity and reliability in Lebanon. In view of the lack of reliable HRQOL instruments for children in Arabic, and to facilitate the sharing of data across international borders, the aim of the present study is 1) to investigate the validity and reliability of an adapted Arabic translation of the PedsQLTM4.0 Child (CF) and Proxy Form (PF) as a population health out- come measure in Lebanese children; 2) the second objective is to assess the HRQOL of Lebanese children as well as the cross sectional relationship with a selected list of socioeconomic variables, environmental variables, in particular the type of habitat (urban vs. rural area), and health variables; 3) to explore the influence of chronic disease related factors on child HRQOL. We hypothesized that gender (female vs. male), habi- tat (urban vs. rural), socio-economic conditions of households, and having a chronic illness (e.g. cancer, asthma, rhinitis) in- fluenced HRQOL directly. Method This study is divided into two phases: Phase I, the cross- cultural adaptation, which involves the translation procedures and preliminary probe in the target population; and phase II, which involves the reliability and validation. The PedsQLTM4.0 core Version was administered according to the terms of the user agreement between the authors and distributors, which approved the cultural adaptation, and vali- dation of the Peds 4.0 into Arabic. PedsQLTM4.0 The HRQOL study described in this paper was carried out using the PedsQLTM4.0 (CF & PF), developed by Dr. James W. Varni. The PedsQLTM during the previous 4 weeks version is a 23-item reliable, validated pediatric HRQOL instrument, offered in both child-report and parent-proxy report formats, with age- appropriate versions. The child report is available for children between 5 - 18 years, divided into the 5 - 7 (young child), 8 - 12 (child), and 13 - 18 years (adolescent) age groups. The parent- proxy forms may be used for children 2 - 18 years of age; with a 2 - 4 years (toddler) version. The PedsQLTM measures HRQOL in four domains: physical functioning, emotional functioning, social functioning, and school functioning. Items are scored from 0 to 4, with a score of 0 indicating “never a problem”, and 4 representing “always a problem”. Individual item scores are computed as the following steps: Items are reverse-scored and linearly transformed to a 0 - 100 scale (0 = 100, 1 = 75, 2 = 50, 3 = 25, 4 = 0), so that higher scores indicate better HRQOL. Scale Scores are computed as the sum of the items divided by the number of items answered (this accounts for missing data). If more than 50% of the items in the scale are missing, the Scale Score is not computed. The PedsQLTM4.0 yields 3 sum- mary scores: a total scale score (average of all items in the questionnaire), a physical health summary score (physical do- main), and a psychosocial health summary score (combination of emotional, social, and school domains). Participants From March to June 2010, we performed a cross sectional study of a sample of the Lebanese children and their parent’s resident in South Lebanon (except Palestinian camps) (Bureau Centrale de la Statistique au Liban, 2006). A supplementary sample of child currently under treatment for cancer and one of their parents were designed to oversample the chronic condi- tions child data especially child with cancer in active period of treatment, derived from referral center in Lebanon to treat chil- dren with cancer. The sampling in the general population was random and at several levels: county, city (in urban areas) or village (in rural areas), quarter, household and individual (Sabbah et al., 2003; Sabbah et al., 2007). In the absence of reliable census data in the various communities, the random sampling of households was done according to the “itinerary method” (Rumeau-Rou- quette et al., 1993). This sample would allow us to detect a 10 point difference between groups with a fixed norm (a general population), assuming two-sided significance of 5%, with 80% power (Sabbah et al., 2003; Ware, 1997). A sample size of 300 participants was found to fulfill these inputs, taking into ac- count the proportion of urban (U) to rural (R) residents. In total, we selected 100 families in urban and 200 families in rural areas. The sample of children was taken within the families according to the number (n) of children in the family: one child was selected if n ≤ 2; two if 3 < n < 4 and three if n ≥ 5. Inclu- sion criteria were: 1) young children (ages 5 - 7), children (ages 8 - 12) years at the time of the visit and one of their parents; 2) the children lived at home; 3) parents and children were able to understand and fill out the questionnaire in Arabic. Persons (children and parents) unable to read the questionnaire who were also hard of hearing were excluded, as were very ill or hospitalized patients, severely mentally handicapped and sub- jects unable to understand Arabic as a consequence of either physical or cognitive impairment (Sabbah et al., 2003). If the child was not home at the time of the initial call, the research assistant arranged for a call at another time. The cancer sample was recruited from the unit center at re- Copyright © 2012 SciRes. 960  I. SABBAH ET AL. ferral hospitals in Lebanon. A sample size of 40 cancer subjects was to be able to reject the null hypothesis (Vanderbilt Univer- sity). Patients were eligible if they were: 1) 5 to 12 years of age; 2) greater than one month post-diagnosis and currently receiv- ing treatment for a cancer diagnosis; and 3) physically able to complete the questionnaire. The informed consent was obtained from parents, children, and health organization managers (when appropriate) before the administration of the questionnaires. After identifying eligible subjects, the PedsQLTM4.0 (CF & PF) was administered by self-administration or face-to-face in- terviews. Children between 5 and 7 years of age were inter- viewed by one interviewer. Additionally, the parents completed a form that contained demographics, socio-economic questions, and the perception of the financial, overall QoL, and overall health status (Ware, 1997). This form also has questions about their child included socio demographic, scholarship, information concerning school type (private/public), means of transport to school. Health prob- lems were measured with a list of known health problems that the children face (World Health Organization (WHO), 1993). The declared obesity by calculating the body mass index (BMI ≥ 95th percentile) is also measured (Giampietro et al., 2002; Children’s BMI Group Calculator, 2007). Cultural Ad a p ta ti o n o f the PedsQLTM4.0 i nto Arabic The translation of the PedsQLTM4.0 from English to Arabic was performed according to the procedures recommended by the author (Varni, 1998-2012). In the first phase, the PedsQLTM4.0 English versions were translated by two native Arabic, and bilingual individuals independent of one another. Once the two translations were completed to each version of child and prox- ies report, discrepancies between them were resolved by a committee consisting of the translators and 3 further individuals not involved in the translation process. They agreed on a single reconciled version which was a conceptually equivalent transla- tion to the original English version and written in an easily understood language for the children. Then, the Arabic versions of the PedsQLTM4.0 were back-translated by a native English speaker living in Lebanon, who was unaware of the original English language document, and a fluent in English that carried out a second back-translation version. The 4 backward transla- tions were then reviewed by two of the authors of this paper. The aim of this phase was to ascertain that the translation was fully comprehensible and the concordance with the English version was attained and to resolve the discrepancies between the back translation and the original document. Following this phase, a second meeting was held with the participation of all the translators and researchers. The purpose of this meeting was to reach a final consensus. The last stage of the adaptation process was to test the pre-final version in a pilot study. The questionnaire was administered to a group (37 × 2 subjects) of children and parents. They are lay native Arabic speakers. For each item the group was asked to consider each question in a critical manner and explain how it was understood. Overall, few problems were noted. Discrepancies were resolved by group consensus. Because of the difficulties related to Arabic grammar and to the style of Arabic writing, two other Arabic linguistics experts also reviewed the translated versions. They checked the spelling, grammar of the forward versions, and the final Arabic versions. After some modification on wording and proofreading, the final version was forwarded to the MAPI Research Institute, which gave the approval for the psychomet- ric probe of the Arabic versions of the Lebanese PedsQL4.0 (CF & PF). Globally, the adaptation did not cause any particular prob- lems, and the Arabic versions of PedsQLTM4.0 Child and Par- ent Reports for young Children (aged 5 - 7), Children (aged 8 - 12) forms achieved satisfactory concept and semantic equiva- lence when compared to the original instruments, proving the questionnaires could be applied for the assessment of reliability and validity of these versions on Lebanese children and their parents: The format, instructions, Likert response scale, and scoring method for the PedsQLTM4.0 Generic Core Scales are identical to the original version, with higher scores indicating better HRQOL. Indeed, with regard to the translation of the questionnaire for our study, some responses related to cultural differences are observed. The expression “do chores” was problematic. In the Lebanese culture, boys are not expected to do chores related to household; therefore, it was necessary to give examples to mothers so that it would be accepted more like “Do chores” (like pick up his toys, work in the garden, sort bed...), in addi- tion, the servants do chores in households. Some problems related to the autonomy concept: the question related to “having a bath alone” didn’t give a clear idea about reality since most mothers don’t allow their kids to have a bath on their own even if they’re physically able to do so, just because they are worried that the kid might hurt himself or might not clean himself prop- erly. This may be the reason to underestimate the physical health scores in Lebanese children. Certain items were confusing to the parent child (aged 8 - 12 and 5 - 7 years). In case of auto administered questionnaire, the Items written in positive ways as: some physical functioning items, getting along with other children, keeping up when playing with other children, paying attention in class; keeping up with schoolwork is answered in a positive manner. These items must be worded: we have to put “difficulty to” or “didn’t” before: get along... So, a higher pre-coded item value indicates a poorer health state. In general, no questions were irrelevant, and the respondents found the questions suitable for their children. Also, the interview was considered by many parents as a worthy experience since it enabled them to have a better communication with their children and to know more about their feelings in depth. S tatistical Analysis First, HRQOL scales were constructed, and missing data were imputed based on the standard guidelines. Scores for HRQL were calculated using the PedsQLTM developer’s guide- lines. Data analysis included descriptive statistics (frequency dis- tribution, ceiling and floor effects, means and SD). Acceptable floor or ceiling effects are less than or equal to 20% (Bollinger, Power, Aaronson, Cella, & Anderson, 1996). The acceptability of the Peds 4.0 (CF & PF) was tested by studying the percentage of refusals, the percentage of missing items, the percentage of complete questionnaires, the time taken to complete the questionnaire (Varni & Burwinkle, 2006), as well as the acceptability questionnaire, which comprises the percentage of disturbing items, items that were hard to under- stand or confusing, and the willingness to fill out the question- Copyright © 2012 SciRes. 961  I. SABBAH ET AL. naire a second time (Sabbah et al., 2003). Items factor analyses were performed using 23 items for child and proxy report. Principal component analysis with varimax rotation was carried out on correlation among items to compare the factorial structure of data with that obtained from the American instrument. Reliability was assessed by tests of internal consistency us- ing Cronbach’s α coefficient. Values ≥ 0.70 are considered ac- ceptable for comparisons between groups (Sabbah, 2003; Ware, 1997; Varni et al., 2006; Nunnally & Bernstein, 1994; Cron- bach, 1951). The construct validity was assessed utilizing the known groups (Ware, 1997; Varni et al., 2006) by making the asso- ciation between the socio demographic parameters, environ- mental variables and health problems. This analysis was con- ducted using F tests from analysis of variance, and chi-square or Fisher’s Exact Tests when appropriate. Effect size between health and cancer children sample was calculated. Effects sizes are designated as small (0.2), medium (0.5) and large (0.8) (Varni et al., 2003; Varni et al., 2006). The size of the standard error of the measurement (SEM) is deter- mined by the reliability of that score (Varni et al., 2003; Ware, 1997; Nunnally et al., 1994). We also explored cut-off points for at-risk status for impaired HRQOL by examining the PedsQL4.0 scale scores for 1 SD (standard deviation) below the mean of the total population sample. Agreement between child self-report and parent proxy-report was assessed through the Spearman’s correlation coefficient with thresholds for poor (0.10 - 0.29), medium (0.30 - 0.49), and large (≥50) (Ware, 1997; Varni et al., 2006). Quality of Lif e Acco rdi ng to Habitat The validity of known groups makes it possible to evaluate at the same time the QoL according to habitat, i.e. urban vs. rural. Multivariate analysis was performed to test the effect of habitat on all domains of the PedsQL4.0 child and proxy inventory. The adjustments were performed by generalized linear model (GLM of SPSS). As four levels of cluster sampling were used, the cluster effect may be considered very low and thus was not specifically taken into account in the statistical analysis. Be- use of multiple testing, a p-value < 0.01 was considered to be significant. All data were recorded, and tabulated for analysis using the SPSS statistical package program (version 16.0. SPSS Inc., Chicago, IL, USA). Results Sample Characteristics The majority of the population welcomed the study. The ac- ceptability in general population is very high (88.0%). 71.2% of families participated in the survey live in rural area. Concerning cancer children and parents’ of 38 eligible populations ap- proached for the study, 81.6% agreed to participate. Reason for refusal was not given by potential participants. In total, 295 families accepted to participate, corresponding to 368 children of which there are 91.6% in the community. 230 (78.0%) fami- lies had only 1 child and one parent participated. The main respondent of the parent proxy-report was mothers (82.7%), fathers (13.9%), and others relatives (2.7%). The mean number of child in the family is 3.41 (SD = 1.60) [range 1 to 10], the mean age of mothers and fathers was respectively 37.5 (SD = 6.5) years, and 43.24 (SD = 7.0) years. 58.6% of the families reported having experienced a disease during the last 12 months in the family. 23.6% of fathers were educated to primary level or lower, and 2.8% were illiterate. 28.3% of the mothers have university and higher level of education, and there was no sig- nificant difference between rural and urban environment in this regard; 71.7% mothers were housewives. 47.2% of the families studied were not registered with the social security. The parents of cancer children under treatment reported worse financial status where 32.3% declared their financial status is very poor and poor, bad quality of life (22.6% vs. 3.8%; p < 0.001) and health status than the parents in the community. The population of children ranged in age from 4.11 (0.3%) to 13 (0.8%) years, with an average age of 8.33 years (SD = 2.31, median = 8.0 years). 46.2% were girl. Young child (aged 5 - 7) comprised near the half (45.4%) of the sample of children. 73.6% were in private school, and 7.6% go to school walking. Self-reported diseases and symptoms were numerous declared by 39.8% of children (Table 1). The oncology children present with acute Lymphocytic leukemia (n = 31), brain tumor (n = 1), and other cancers (n = 2). Table 1. Children characteristics according to urban and rural areas. Total n (%) Urban n (%) Rural n (%) p-value Gender Boy Girl 198 (53.8) 170 (46.2) 56 (52.8) 50 (47.2) 141 (54.0) 120 (46.0) 0.83 Age group 5 - 7 years 8 - 12 years 167 (45.4) 201 (54.6) 51 (48.1) 55 (51.9) 116 (44.4) 145 (55.6) 0.52 School Private Public NA 270 (73.6) 94 (25.6) 3 (0.8) 87 (82.1) 18 (17.0) 1 (0.9) 183 (70.1) 76 (29.1) 2 (0.8) 0.05 Rhinitis Yes No 44 (12.0) 324 (88.0) 16 (15.1) 90 (84.9) 28 (10.7) 233 (89.3) 0.24 Asthma Yes No 23 (6.3) 345 (93.7) 09 (8.5) 97 (91.5) 14 (5.4) 247 (94.6) 0.26 Visual disorders Yes No 33 (9.0) 345 (91.0) 12 (11.3) 94 (88.7) 21 (8.3) 240 (92.0) 0.32 Hearing disorders Yes No 11 (3.0) 357 (97.0) 07 (6.6) 99 (93.4) 04 (1.5) 257 (98.5) 0.01 Cancer Yes No 34 (9.2) 334 (90.8) 15 (14.2) 91(85.8) 18 (6.9) 243 (93.1) 0.03 Total 3681 (100)106 (100) 261 (100.0 ) Notes and abbreviations: NA: not applicable; 1 missing value according to envi- ronment. Others morbidities as reported as the following: Obesity (BMI ≥ 95 percentile) 24%, epilepsy (0.9%), hyperactivity (1.5%), insomnia (0.6%), teeth problem (0.9%), cardiac (1.2%), urinary disease (1.2%), skin disease as urticaria (3.0%), migraine (2.4%), ENT (2.7%), and rheumatic disease and cough (0.9%) respectively. Copyright © 2012 SciRes. 962  I. SABBAH ET AL. Psychometric Properties of the PedsQLTM4.0 No-one refused to answer the questions of the Peds 4.0 (CF & PF). The Child and Proxy questionnaires were completed respectively in 93.8% and 93.2% of cases. There was no sig- nificant difference between the number of missing items of self administered questionnaires and those administered by an in- terviewer of the child (6.5% vs. 6.2%; p = 0.46), and proxy (6.8% vs. 6.6%; p = 0.28) report. The amount of missing data for child and proxy questionnaire was very low, at only 0.51% and 0.46% of all answered. In both questionnaires, the missing data were spread evenly over the different scales with a mini- mum of 0 and maximum 2.4%; which indicates that the ques- tionnaire had good acceptability. The average time of completion of the Peds Child version was 7.8 minutes (SD = 3.33, median = 7.0). 45.8% of the child aged 8 - 12 years self administered the questionnaire. 42.6% of the parents’ questionnaires were self-administered and the av- erage time of completion of the Peds proxy was 5.8 minutes (SD = 2.61, median = 5.0). Furthermore, 0.76% of items were considered to be confus- ing by the child. The three most frequently quoted items were: worry about what will happen to you (35.9%), I find difficulty coping with other children (20.3%) and it’s hard to follow other kids while playing with them (7.8%). Concerning the proxy questionnaires, 9.8% of parents considered that most of items must be reversed items (positive items), especially the physical items. Nearly All respondents (97.8% of the children and 98.4% of the parents) accepted to fill out the questionnaire for a second time. The item mean, and standard deviation of the child and proxy questionnaire tended to be comparable with few exceptions. Factor analysis of the 23 items of the child questionnaire yielded a four factor solution corresponding to the hypothesized scale of health underlying the PedsQL4.0 except for the item “hurt or ache” which loaded with emotional functioning more than its rotated principal component. Concerning proxy ques- tionnaire, all items loaded on the a priori dimensions except for “hurt or ache” and “low energy” which loaded with emotional functioning more than its specific factor, and for “cannot do things” which loaded higher with physical functioning than its hypothesized scale (Table 2). Tables 3 and 4 present means, SDs of the PedsQL4.0 scores for CF and PF for the total sample, community (general popu- lation), and pediatric cancer sample. Cronbach’s alpha coefficients were high for all subscales (range 0.70 to 0.89), except the emotional scales for child (0.64), and proxy (0.60) questionnaire. It is very high (>0.9) for school functioning of pediatric cancer children. The reliability coefficients are calculated only for those cases where all items have been completed (Table 5). Effect size is ranged from 1.0 SD units (Psychosocial Health scale) to 2 SD units (School Functioning), and reflects substan- tial physical and psycho morbidity. Indeed these differences are medium (0.5 and lower) for Emotional and Social Functioning (Table 4). The size of the confidence interval around an indi- vidual score shows improvement and worsening based on change of one standard error of measurement or larger (Table 5). The PedsQL 4.0 cut-off point scores for both CF and PF are presented in Table 5. The overall scale intercorrelations across the ages are large (0.5 and more) indicating good agreement between child and parent reports and, generally consistent with other PedsQL4.0 studies (Table 6). Quality of Lif e Acco rdi ng to Habitat (Urban vs. Rur al Area) In the level of households, we observed a few difference be- tween urban and rural areas especially father’s education where we observed more illiterate and elementary level in rural area (25.6% vs. 19.1%), and more university level in urban area (36.0% vs. 19.6%; p < 0.05); social security affiliation (64.4% in urban vs. 47.5% in rural area; p < 0.01) and nationality (where most of the non Lebanese fathers are in urban areas). No differences concerning age, gender of children according to urban and rural areas (Table 1). We assessed also the construct validity utilizing the known groups. Concerning the child report, the scores of the Peds 4.0 increase with age (8 - 12 years vs. 5 - 7 years). The level of education of mother influences the physical scales scores for child and proxy report (p = 0.02). The global assessment of QoL of parents was statistically significantly related to social functioning scores of CF (p < 0.05) and physical functioning (p ≤ 0.01) of the PF. The number of children in the families was positively associated with PedsQL total and physical domain scores. It was also associated with higher school functioning scores (p ≤ 0.01) in the point of view of parents. Females had slightly higher HRQoL scores in the school functioning domain. Children who have family (with both father and mother) have higher emotional and social scores than children in families where parents are divorcees or widow(er)s. After adjustment for the other socio-demographic variables it was found that, with the exception of the social scale (p < 0.05), the place of residence (urban vs. rural) has no influences on either Peds scales scores. Concerning self-reported morbidity, there were statistically significant differences between healthy and chronically ill chil- dren. Children who had a health problem (asthma, rhinitis, vis- ual disorders,) had poorer scores on 3 or more dimensions of the PedsQL4.0 Generic Core Scales. The children with asthma, even outside attacks, had a negative impact on the, total, physi- cal, psychosocial and emotional functioning. In addition there were large statistically significant differences between “healthy” and cancer children for most subscales except the social and emotional functioning of the child report (Table 7). Discussion and Conclusion The aim of our study was to adapt the PedsQLTM4.0 (CF and PF) into Arabic for young (5 - 7 years), and children (8 - 12 years), assess its psychometric properties, and evaluate HRQOL in urban and rural Lebanese population. The translated version retained the properties of the original version. The acceptability was in general very good. This rein- forces the expected validity (face validity), confirm the absence of problems related to translation (Sabbah et al., 2003), and suggest that children and parents are willing and able to provide good-quality data regarding the child’s HRQOL. The internal consistency reliabilities generally exceeded the recommended minimum alpha coefficient standard for group comparison of 0.70 (Sabbah et al., 2003; Varni et al., 2003; Ware, 1997; Nunnally et al., 1994). Indeed, Ware (1997), con- idered the reliability of 0.5 or above is acceptable. However, s Copyright © 2012 SciRes. 963  I. SABBAH ET AL. Copyright © 2012 SciRes. 964 Table 2. Items mean (SD), and principal component analysis with varimax rotation of the PedsQL4.0 for child self-reports and parent proxy-report. Child report Proxy report Rotated principal component1 Rotated principal component1 Item Items mean (SD) Physical EmotionalSchoolSocial Items mean (SD) Physical Emotional SchoolSocial Walk 88.3 (24.7) 0.72 0.12 82.0 (29.1) 0.77 0.16 0.17 Run 81.5 (30.9) 0.75 0.20 79.6 (31.5) 0.82 0.20 0.13 Do sports 84.4 (28.6) 0.76 0.19 79.4 (31.6) 0.78 0.17 0.11 Lift som ething heavy 60.0 (34.4) 0.53 0.18 64.9 (33.0) 0.45 0.28 0.14 Take a bath 75.1 (37.1) 0.56 0.16 0.13 72.6 (37.9) 0.47 Do chores 72.9 (33.0) 0.43 0.14 0.17 68.8 (34.3) 0.53 0.12 0.17 Hurt or ache 76.2 (31.4) 0.28 0.49 79.6 (26.5) 0.26 0.45 0.13 Low energy 75.8 (28.8) 0.46 0.43 0.24 80.7 (26.7) 0.32 0.56 0.21 0.13 Feel afraid 66.6 (32.2) 0.55 65.2 (30.4) 0.47 −0.210.18 Feel sad 70.0 (28.9) 0.73 69.9 (28.9) 0.63 0.18 Feel angry 55.3 (32.0) 0.47 0.25 0.21 54.6 (30.4) 0.52 0.12 0.13 Trouble sleeping 85.0 (26.9) 0.58 84.4 (25.3) 0.54 Worry 78.2 (31.3) 0.15 0.60 0.20 80.1 (30.2) 0.10 0.54 Trouble getting along with other 83.9 (28.4) 0.16 0.64 84.7 (26.5) 0.22 0.10 0.17 0.69 Kids do not w ant to be my friend 85.0 (27.4) 0.10 0.13 0.75 89.8 (22.2) 0.14 0.13 0.76 Kids tease me 85.4 (25.4) 0.35 0.58 89.9 (20.4) −0.15 0.22 0.13 0.67 Cannot do things 83.9 (27.2) 0.36 0.29 0.28 0.37 87.7 (23.7) 0.43 0.34 0.24 0.36 Hard to keep up when I play 83.3 (27.8) 0.35 0.11 0.20 0.50 84.8 (25.7) 0.43 0.14 0.55 Hard to pay atten tion in class 79.8 (29.8) 0.77 0.12 79.4 (29.4) 0.15 0.82 0.17 forget things 74.1 (27.9) 0.21 0.56 0.20 75.8 (27.4) 0.72 0.25 Trouble keeping up with my schoolwork 78.4 (30.7) 0.16 0.75 0.16 79.9 (29.9) 0.24 0.79 0.20 Miss school because of not feeling well 76.5 (30.9) 0.22 0.19 0.67 81.2 (28.1) 0.11 0.46 0.60 Miss school to go to the doctor 67.4 (31.8) 0.33 0.17 0.50 72.2 (29.9) 0.22 0.48 0.44 Notes and abbreviations: Strong association (r > 0.70); moderate association (0.30 < r < 0.70); weak association (r < 0.30). 1Correlation between each item and rotated principal component. Blanks in the table indicate low correlations (<0.10). The percentage of measured variance explained by these four factors for child report is 44.75%; The first component explain 13.95%, second (11.31%), third (11.04%) and the fourth (8.45%); The percentage of measured variance explained by these four factors for proxy report is 48.4%: The first component explains 14.7%, second (12.2%), third (11.9%) and the fourth (9.6%). according to Varni and al. (2002), the emotional, and social subscales (α < 0.70) may be utilized with a caveat until further testing is conducted, and then should be used only for descrip- tive or exploratory analyses. In our study the quality of life of children is deteriorated, especially the emotional functioning scale score, where most children feel afraid, sad, and angry. The responses did not differ from fixed responses, which could negatively bias the Cronbach’s α (Fong et al., 2010). The presence of a relation between the dimensions of Peds 4.0 and the sociodemographic and clinical parameters is an important finding as such instruments could be used in thera- peutic evaluations (Upton et al., 2005; Ware, 1997; Dean et al., 2010). Our results are in contrast with other results that have failed to observe gender differences (Varni et al., 2007; Varni et al., 2003) or found fewer negative associations (Reinfjell et al., 2006; Villalonga-Olives et al., 2010). This finding might be explained by changes in the traditional gender differences of coping with life events in childhood, modifications in social resources, and gender role expectations in the millennium (Villalonga-Olives et al., 2010). he education of mother, fam- T  I. SABBAH ET AL. Table 3. Description of scales scores of the PedsQL4.0 for child self-report and parent proxy-report. All Lebanese sample (n = 368) Young child (5 - 7 years) (n = 167) C hil d 8 - 12 years (n = 201) Scale Mean (SD) % Floor/Ceiling Mean (SD) % Floor/Ceiling Mean (SD) % Floor/Ceiling Child self-repor t (n = 368) Total score 76.7 (14.2) 0.0/0.0 74.0 (13.4) 0.0/0.0 78.9 (14.5) 0.0/0.0 Physical healt h 76.7 (19.0) 0.3/6.5 73.1 (19.3) 0.0/4.2 79.7 (18.3) 0.5/8.5 Psychosoc ial he alt h 76.7 (14.7) 0.0/0.8 74.6 (14.2) 0.0/1.2 78.4 (15.0) 0.0/0.5 Emotional fu nc tio nin g 70.8 (19.3) 0.0/6.5 70.0 (19.8) 0.0/11.4 71.6 (18.8) 0.0/2.5 Social functioning 84.2 (17.7) 0.0/32.1 81.3 (18.5) 0.0/27.5 86.6 (16.7) 0.0/35.8 School functioning 4 74.9 (21.5) 2.2/11.5 72.1 (22.6) 3.0/11.5 77.3 (20.3) 1.5/11.6 Proxy-re port (n = 36 6) Total score 77.6 (14.4) 0.0/0.8 76.6 (14.0) 0.0/0.0 78.4 (14.8) 0.0/1.5 Physical healt h 76.1 (19.9) 0.5/9.3 74.0 (18.8) 0.6/7.2 77.9 (20.6)ǂ 0.5/11.1 Psychosoc ial he alt h 78.4 (14.2) 0.0/1.4 78.1 (14.3) 0.0/0.0 78.8 (14.2) 0.0/2.5 Emotional fu nc tio nin g 70.9 (18.0) 0.0/4.9 70.8 (17.5) 0.0/4.8 70.9 (18.4) 0.0/5.0 Social functioning 87.1 (17.1) 0.3/40.7 85.9 (18.4) 0.6/38.3 88.1 (15.8) 0.0/42.7 School functioning 77.4 (21.6) 2.5/13.2 77.4 (22.4) 3.0/13.9 77.5 (21.0) 2.0/12.6 Table 4. Descriptive and effect size of the PedsQL4.0 scales child self-report and parent proxy-report: Healthy and cancer children sample. Cancer child Healthy child (Did not have cancer) n Mean SD n Mean SD Difference Effect size† T scores p-value* Child self-report Total score 34 62.2 20.5 334 78.2 12. 6 15.9 1.27 −6.6 <0.001 Physical healt h 34 58.6 26.9 334 78. 6 17.0 19.9 1.17 −6.1 <0.001 Psychosoc ial he alt h 34 64.3 20.9 334 77.9 13.4 13.7 1.00 −5.3 <0.001 Emotional fu nc tio nin g 34 63.7 26.4 334 71.6 18.3 7.9 0.43 −2.3 0.02 Social functioning 34 80.9 21.0 334 84.5 17.3 3.6 0.21 −1.1 0.25 School functioning 30 44.2 32.9 334 77.7 17.8 33.4 1.87 −9.0 <0.001 Parent proxy-report Total score 32 58.7 19.5 334 79.4 12.5 20.7 1.66 −8.5 <0.001 Physical healt h 32 51.6 28.5 334 78.5 18.1 26.9 1.49 −7.9 <0.001 Psychosoc ial he alt h 32 62.8 19.1 334 80.0 12.7 17.2 1.35 −7.0 <0.001 Emotional fu nc tio nin g 32 60.8 21.3 334 71.8 17.3 11.1 0.64 −3.4 <0.001 Social functioning 32 78.8 23.0 334 87.9 16.2 9.0 0.56 −2.9 <0.01 School functioning 29 45.9 35.0 334 80.2 17.6 34.3 1.95 −9.1 <0.001 Note: *p-value statistical significance. †Effect sizes are designated as small (0.20), medium (0.50), and large (0.80). Effect size was calculated by taking the difference between the healthy sample mean and the sample with health conditions mean, divided by the healthy sample standard deviation. Copyright © 2012 SciRes. 965  I. SABBAH ET AL. Table 5. PedsQLTM4.0 generic core scales internal consistency reliability by age group and minimal clinically important difference (SEM) for child self-report and parent proxy-report Lebanese sample. Chronbach alpha (n) Cut-off point scores >1 SD* of the total sample Scale Total sample Young ch ild 5 - 7 Child 8 - 12 SEM of the total sam ple Cut off n (%) Self-report Total score 0.84 (348) 0.80 (159) 0.86 (189) 5.70 62.48 57 (15.5) Physical healt h 0.76 (363) 0.73 (165) 0.80 (198) 9.25 57.72 55 (14.9) Psychosoc ial he alt h 0.78 (351) 0.73 (159) 0.81 (192) 6.90 61.94 62 (16.8) Emotional fu nc tio nin g 0.64 (363) 0.62 (164) 0.66 (199) 11.56 51.58 70 (19.0) Social functioning 0.66 (364) 0.63 (167) 0.68 (197) 10.36 66.50 58 (15.8) School functioning 0.73 (358) 0.72 (161) 0.74 (197) 11.15 53.39 52 (14.3) Proxy-report Total score 0.86 (342) 0.84 (158) 0.87 (184) 5.48 63.19 49 (13.4) Physical healt h 0.79 (357) 0.75 (163) 0.83 (194) 9.07 56.23 47 (12.8) Psychosoc ial he alt h 0.79 (350) 0.78 (162) 0.80 (188) 6.44 64.25 54 (14.8) Emotional fu nc tio nin g 0.60 (366) 0.59 (167) 0.61 (199) 7.20 52.9 62 (16.9) Social functioning 0.73 (357) 0.76 (164) 0.70 (193) 8.91 69.99 47 (12.8) School functioning 0.79 (359) 0.82 (165) 0.76 (194) 9.93 55.8 54 (14.9) Note: *SEM indicates Standard Error of Measurement and was derived by multiplying the standard deviation by the square root of (1-Cronbach alpha reliability coefficient). The PedsQL4.0 scores in the column represent the transformed value of 1 SEM. For example, a change in PedsQL4.0 Total Scale Score for child self-report of 5.70 repre- sents a minimal clinically important difference [18]. *1 SD (standard deviation) demonstrates the scores that fall 1 SD below the population sample mean and represent an at- risk status for impaired health-related quality of life. Table 6. Spearman correlation coefficients between PedsQL4.0 scales for child self-report parent proxy-report. Scale Total (5 - 12 year s) Young child Child (8 - 12 year s) Total score 0.69** 0.63** 0.73** Physical healt h 0.61** 0.53** 0.67** Psychosoc ial he alt h 0.66** 0.63** 0.70** Emotional fu nc tio nin g 0.51** 0.48** 0.53** Social functioning 0.51** 0.42** 0.59** School functioning 0.66** 0.67** 0.67** Notes and Abbreviations: **All correlations are significant at the P, 0.01 levels (2-tailed). Effect sizes are designated as small (0.10), medium (0.30), and large (0.50). ily situation of parents and the perception of the QoL of parents influence the quality of life of their children. This is in concor- dance with previous study in Lebanon using SF-36 (Sabbah et al., 2003). Prior research has shown that the family members influence each other mutually (Hatzmann et al., 2009; Pane- pinto et al., 2009; Duhamel, 2007), therefore, the family with children who have a chronic disease may have greater family burden, and need social support (Hatzmann et al., 2009; Pane- pinto et al., 2009). As has been reported in several studies (Dean et al., 2010; Abdel Hai, Taher, & Fattah, 2010; Farnik et al., 2010), it is well established that children with chronic con- ditions have significant impairments in HRQoL. As expected, self-reported scores for overall HRQOL of cancer children were more impaired than those of healthy children (Eiser, Eiser, & Stride, 2005; Sung et al., 2009; Sandeberg, Johansson, Hagell, & Wettergren, 2010; Varni, Limbers, & Burwinkle, 2007). School functioning was most impacted by chronic health condi- tions, as reflected by the higher rates of school absences (Dean et al., 2010), and quit of school. It should be noted that 11.6% of Lebanese pediatric cancer were outside the school and at risk to be illiterate people. The PedsQL4.0 scales scores of Lebanese children were lower than those of US (Varni et al., 2003), and UK (Upton et al., 2005) children. This was also observed for Lebanese people aged 14 year and more using the SF-36 Health survey (Sabbah et al., 2003), which could be due to factors such as stress, mor- bidity of the parents (Duhamel, 2007), war status, lack of health coverage (Sabbah et al., 2007), lack of public green spaces (Costa, Vescina, & Barcellos Pinheiro, 2010), and comorbidities (Sabbah et al., 2003; Varni et al., 2003; Upton et al., 2005). Additionally, the physical functioning of children is low. It may be related to their autonomic behavior e.g. parents consider that most children are incapable to take a bath alone. This in part may also be explained by the high number of servants in households (Bureau Centrale de la statistique au Liban, 2006). The social scale scores are high in general population and in ill hildren (effect ceiling). This is related to the oriental culture c Copyright © 2012 SciRes. 966 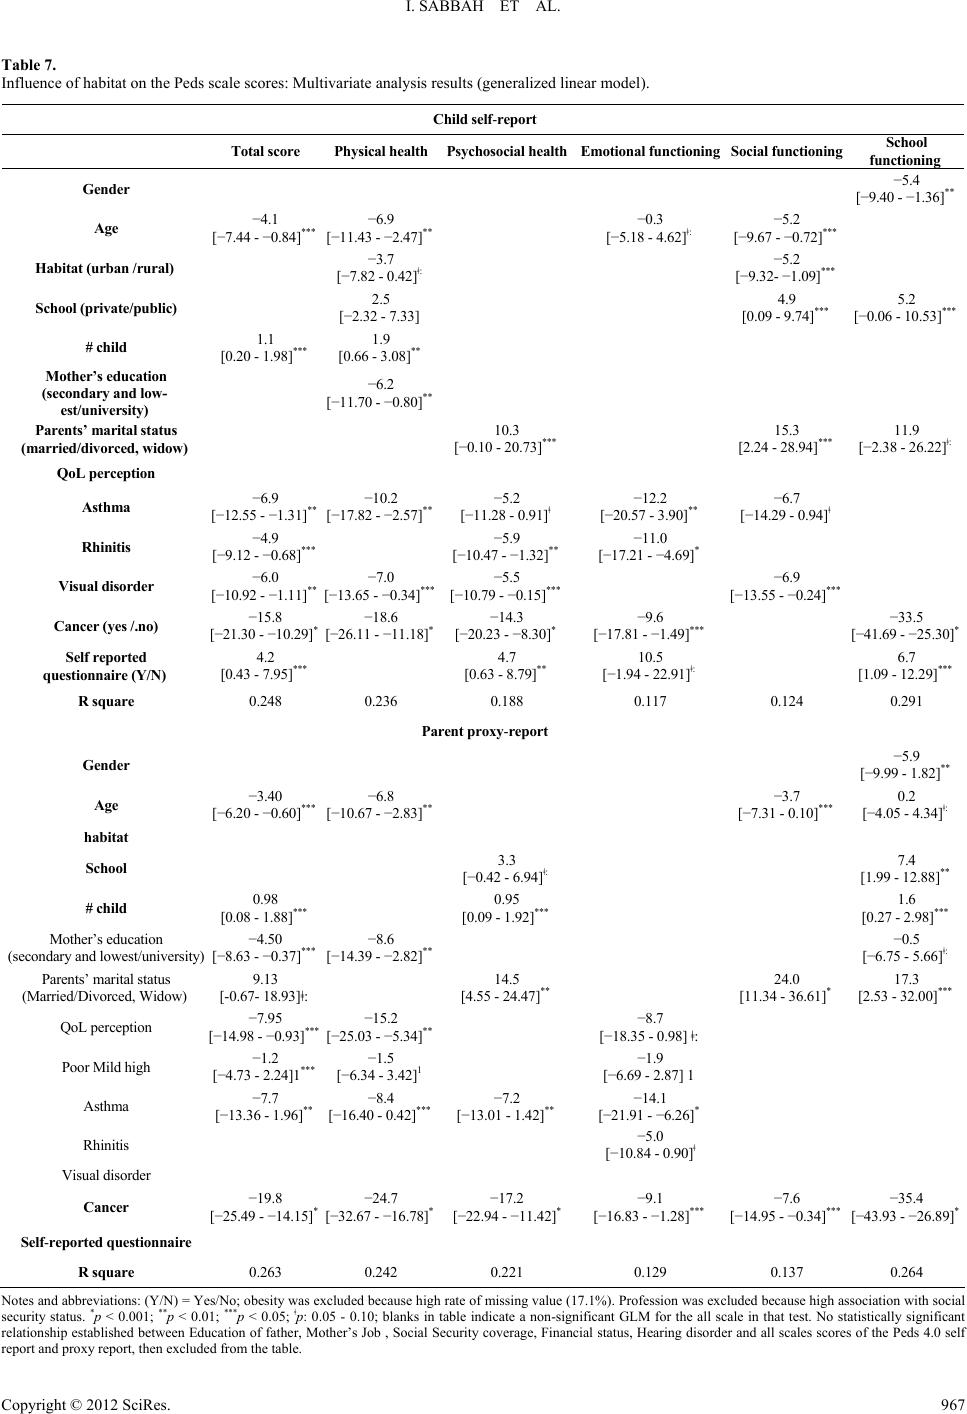 I. SABBAH ET AL. Table 7. Influence of habitat on the Peds scale scores: Multivariate analysis results (generalized linear model). Child self-report Total score P hysic al healthP syc hosocial healthEmotional functioningSocial functioning School functioning Gender −5.4 [−9.40 - −1.36]** Age −4.1 [−7.44 - −0.84]*** −6.9 [−11.43 - −2.47]** −0.3 [−5.18 - 4.62]ǂ: −5.2 [−9.67 - −0.72]*** Habitat (urban /rural) −3.7 [−7.82 - 0.42]ǂ: −5.2 [−9.32- −1.09]*** School (private/public) 2.5 [−2.32 - 7.33] 4.9 [0.09 - 9.74]*** 5.2 [−0.06 - 10.53]*** # child 1.1 [0.20 - 1.98]*** 1.9 [0.66 - 3.08]** Mother’s education (secondary and low- est/university) −6.2 [−11.70 - −0.80]** Parents’ marital status (married/divorced, widow) 10.3 [−0.10 - 20.73]*** 15.3 [2.24 - 28.94]*** 11.9 [−2.38 - 26.22]ǂ: QoL perception Asthma −6.9 [−12.55 - −1.31]** −10.2 [−17.82 - −2.57]** −5.2 [−11.28 - 0.91]ǂ −12.2 [−20.57 - 3.90]** −6.7 [−14.29 - 0.94]ǂ Rhinitis −4.9 [−9.12 - −0.68]*** −5.9 [−10.47 - −1.32]** −11.0 [−17.21 - −4.69]* Visual disorder −6.0 [−10.92 - −1.11]** −7.0 [−13.65 - −0.34]*** −5.5 [−10.79 - −0.15]*** −6.9 [−13.55 - −0.24]*** Cancer (yes /.no) −15.8 [−21.30 - −10.29]* −18.6 [−26.11 - −11.18]* −14.3 [−20.23 - −8.30]* −9.6 [−17.81 - −1.49]*** −33.5 [−41.69 - −25.30]* Self reported questionnaire (Y/N) 4.2 [0.43 - 7.95]*** 4.7 [0.63 - 8.79]** 10.5 [−1.94 - 22.91]ǂ: 6.7 [1.09 - 12.29]*** R square 0.248 0.236 0.188 0.117 0.124 0.291 Parent proxy-re port Gender −5.9 [−9.99 - 1.82]** Age −3.40 [−6.20 - −0.60]*** −6.8 [−10.67 - −2.83]** −3.7 [−7.31 - 0.10]*** 0.2 [−4.05 - 4.34]ǂ: habitat School 3.3 [−0.42 - 6.94]ǂ: 7.4 [1.99 - 12.88]** # child 0.98 [0.08 - 1.88]*** 0.95 [0.09 - 1.92]*** 1.6 [0.27 - 2.98]*** Mother’s education (secondary and lowest/university) −4.50 [−8.63 - −0.37]*** −8.6 [−14.39 - −2.82]** −0.5 [−6.75 - 5.66]ǂ: Parents’ marital status (Married/Divorced, Widow) 9.13 [-0.67- 18.93]ǂ: 14.5 [4.55 - 24.47]** 24.0 [11.34 - 36.61]* 17.3 [2.53 - 32.00]*** QoL perception −7.95 [−14.98 - −0.93]*** −15.2 [−25.03 - −5.34]** −8.7 [−18.35 - 0.98] ǂ: Poor Mild high −1.2 [−4.73 - 2.24]1*** −1.5 [−6.34 - 3.42]1 −1.9 [−6.69 - 2.87] 1 Asthma −7.7 [−13.36 - 1.96]** −8.4 [−16.40 - 0.42]*** −7.2 [−13.01 - 1.42]** −14.1 [−21.91 - −6.26]* Rhinitis −5.0 [−10.84 - 0.90]ǂ Visual disorder Cancer −19.8 [−25.49 - −14.15]* −24.7 [−32.67 - −16.78]* −17.2 [−22.94 - −11.42]* −9.1 [−16.83 - −1.28]*** −7.6 [−14.95 - −0.34]*** −35.4 [−43.93 - −26.89]* Self-reported questionnaire R square 0.263 0.242 0.221 0.129 0.137 0.264 Notes and abbreviations: (Y/N) = Yes/No; obesity was excluded because high rate of missing value (17.1%). Profession was excluded because high association with social security status. *p < 0.001; **p < 0.01; ***p < 0.05; ǂp: 0.05 - 0.10; blanks in table indicate a non-significant GLM for the all scale in that test. No statistically significant relationship established between Education of father, Mother’s Job , Social Security coverage, Financial status, Hearing disorder and all scales scores of the Peds 4.0 self report and proxy report, then excluded from the table. Copyright © 2012 SciRes. 967  I. SABBAH ET AL. where relationships are very close especially in case of an ill- ness. It was also observed for Lebanese SF-36 social scores (Sabbah et al., 2003). A minor difference between urban and rural areas is also observed for the different scales scores of the SF-36 in Lebanon (Sabbah et al., 2003), and for the morbidity (Sabbah et al., 2007). These findings confirm the demographic and epidemiological transition phenomenon occurred in Leba- non (Sabbah et al., 2003). This is in contrast with the Turkish population where Oguzturk (2008) found that both socio-eco- nomic status and quality of life were poorer in rural areas. The strength of the present study is that it is representative of the general population, thus able to make inferences based on the available observations (Villalonga-Olives et al., 2010). There are some limitations in the present study. It is limited to South Lebanon, because of a lack of resources. To continue the validation, it is necessary to include an assessment of its re- sponsiveness to change of the group over time. Self-reporting of diseases as a measurement of health status also presents some limitations (Sabbah et al., 2003). Some HRQOL scales were skewed, which is to be expected in a general population. However, the parametric techniques that were applied are quite robust, and have been demonstrated to be adequate in analyzing skewed data if sample size is large enough (Verrips et al., 1999). The PedsQL Total Score reliability coefficients were calculated only for those cases where all items have been completed (Ware, 1997). An algorithm must be recommended to substitute a personspecific estimate for any missing item when the re- spondent answered at least 50 percent of the items in a scale, then it is possible to derive scale scores for nearly all respon- dents across the PedsQL4.0 scales (Ware, 1997). Finally, the absence of a generic valid reference instrument in Arabic in Lebanon remains a major obstacle for the establishment of concurrent validity as well as predictive validity. In conclusion, the study supports the acceptability, reliability, and validity of the PedsQL4.0 Generic Core Scales as a child self-report and parent proxy-report HRQOL measurement in- strument for pediatric population health in Arabic Lebanon. Further psychometric evaluation in a large sample of children, in other departments of Lebanon is recommended to provide firmer conclusions. Acknowledgements The authors wish to acknowledge the help and support of the team of the Mapi Research Trust Institute, and Mr. James W. Varni. We are grateful to the subjects who participated in this survey, to F. Badran for her help with translation and advice on the manuscript, to A. Badran, M. A. Sabbah for their help with the translation of the PedsQLTM4.0. I would also like to thank the interviewers who helped to carry out this study. REFERENCES Abdel Hai, R., Taher, E., & Fattah, M. A. (2010). Assessing validity of the adapted Arabic Paediatric Asthma quality of life questionnaire among Egyptian children with asthma. Eastern Mediterranean Health Journal, 16, 274-280. Bek, N., Simsek, E., Erel, S., Yakut, Y., & Uygur, F. (2009). Turkish version of impact on family scale: A study of reliability and validity. Health and Quality of Life Outcomes, 7, 7 pp. doi:10.1186/1477-7525-7-4 Berkes, A., Pataki, I., Kiss, M., Kemény, C., Kardos, L., Varni, J. W., & Mogyorósy, G. (2010). Measuring health-related quality of life in Hungarian children with heart disease: Psychometric properties of the Hungarian version of the pediatric quality of life inventory TM 4.0 generic core scales and the cardiac module. Health and Quality of Life Outcomes, 8, 12p. doi:10.1186/1477-7525-8-14 Bollinger, M., Power, M. J., Aaronson, N. K., Cella, D. F., & Anderson R. T. (1996). Creating and evaluating cross-cultual instruments. In: B. Spilker (Ed.), Quality of Life and Pharmacoeconomics in Clinical Trials (2nd ed., pp. 659-668). PA: Lippincott-Raven Publishers. Bureau Centrale de la Statistique au Liban (2006). Annuaire, 15-23. http://www.localiban.org/IMG/pdf/La_Structure_Demographique_Li banaise.pdf Chan, K. S., Mangione-Smith, R., Burwinkle, T. M., Rosen, M., & Varni, J. W. (2005). The PedsQLTM: Reliability and validity of the short-form generic core scales and asthma module. Medical Care, 43, 256-265. doi:10.1097/00005650-200503000-00008 Sarah E. B. (2007). Expert committee recommendations regarding the prevention, assessment, and treatment of child and adolescent over- weight and obesity: Summary report. Pediatrics, 120, s164-s192. doi:10.1542/peds.2007-2329C Costa, S. A. L. M., Vescina, L., & Barcellos Pinheiro, M. D. (2010). Environmental restoration of urban rivers in the metropolitan region of Rio de Janeiro, Brazil. Environment Urban/Urban Environment, 4, a13-a26. http://www.vrm.ca/cyber_pub.asp? Cronbach, L. J. (1951). Coefficient alpha and the internal structure of tests. Psychometrika, 16, 297-334. doi:10.1007/BF02310555 Dean, B. B., Calimlim, B. C., Sacco, P., Aguilar, D., Maykut, R., & Tinkelman, D. (2010). Uncontrolled asthma: Assessing quality of life and productivity of children and their caregivers using a cross-sec- tional internet-based survey. Health and Quality of Life Outcomes, 8, 10. doi:10.1186/1477-7525-8-96 Duhamel F. (2007). La relation entre la problématique de santé et la famille. In F. Duhamel (Ed.), Gaeten Morin Editeur la Santé et la Famille une Approche Systémique en Soins Infirmiers (pp. 3-22). Gaëtan Morin éditeur, CA: Chenelière education. Eiser, C., Eiser, J. R., & Stride, C. B. (2005). Quality of life in children newly diagnosed with cancer and their mothers. Health and Quality of Life Outcomes, 3, 5 pp. doi:10.1186/1477-7525-3-29 Eshaghi, S.-R., Ramezani, M. A., Shahsanaee, A., & Pooya, A. (2006). Validity and reliability of the short form—36 items questionnaire as a measure of quality of life in elderly Iranian population. American Journal of Applied Sciences, 3, 1763-1766. Estrada, M.-D., Rajmil, L., Serra-Sutton, V., Tebe, C., Alonso, J., Herdman, M., & Starfield, B. (2010). Reliability and validity of the Spanish version of the child health and illness profile (CHIP) child-edition, parent report form (CHIP-CE/PRF). Health and Qual- ity of Life Outcomes, 8, 9 pp. doi:10.1186/1477-7525-8-78 Farnik, M., Brozek, G., Pierzchala, W., Zejda, J. E., Skrzypek, M., & Walczak, L. (2010). Development, evaluation and validation of a new instrument for measurement quality of life in the parents of children with chronic disease. Health and Quality of Life Outcomes, 8, 9 pp. doi:10.1186/1477-7525-8-151 Fong, D. Y. T., Ho, S., & Lam, T. (2010). Evaluation of internal reli- ability in the presence of inconsistent responses. Health and Quality of Life Outcomes, 8. doi:10.1186/1477-7525-8-27 Giampietro, O., Virgone, E., Carneglia, L., Griesi, E., Calvi, D., & Matteucci, E. (2002). Anthropometric indices of school children and familiar risk factors. Preventive Medicine, 35, 492-498. http://www.sciencedirect.com/science. doi:10.1006/pmed.2002.1098 Giannakopoulos, G., Dimitrakaki, C., Pedeli, X., Kolaitis, G., Rotsika, V., Ravens-Sieberer, U., & Tountas Y. (2009). Adolescents’ wellbe- ing and functioning: Relationships with parents’ subjective general physical and mental health. Health and Quality of Life Outcomes, 7, 9 pp. doi:10.1186/1477-7525-7-100 Gkoltsiou, K., Dimitrakaki, C., Tzavara, C., Papaevangelou, V., Varni, J. W., & Tountas, Y. (2008). Measuring health-related quality of life in Greek children: Psychometric properties of the Greek version of the pediatric quality of life inventoryTM 4.0 generic core scales. Quality of Life Research, 17, 299-305. doi:10.1007/s11136-007-9294-1 Copyright © 2012 SciRes. 968  I. SABBAH ET AL. Harrison, M. J., Lunt, M., Verstappen, S. M. M., Watson, K. D., Bans- back, N. J., & Symmons, D. P. M. (2010). Exploring the validity of estimating EQ-5D and SF-6D utility values from the health assess- ment questionnaire in patients with inflammatory arthritis. Health and Quality of Life Outcomes, 8, 8 pp. doi:10.1186/1477-7525-8-21 Hatzmann, J., Maurice-Stam, H., Heymans, H. S. A., & Grootenhuis, M. A. (2009). A predictive model of health related quality of life of parents of chronically ill children: The importance of care-depend- ency of their child and their support system. Health and Quality of Life Outcomes, 7. doi:10.1186/1477-7525-7-72 MAPI Institute. Questionnaires and Translations. http://www.mapi-institute.com/questionnaires-and-translation. Matza, L. S., Swensen, A. R, Flood, E. M, Secnik, K., & Leidy, N. K. (2004). Assessment of health-related quality of life in children: A re- view of conceptual, methodological, and regulatory issues. Value in Health, 7, 79-92. doi:10.1111/j.1524-4733.2004.71273.x Mistry, R. D., Stevens, M. W., & Gorelick, M. H. (2009). Health-related quality of life for pediatric emergency department febrile illnesses: An evaluation of the pediatric quality of life inventory™ 4.0 generic core scales. Health and Quality of Life Outcomes, 7, 9 pp. doi:10.1186/1477-7525-7-5 Nunnally, J. C., & Bernstein, I. H. (1994). Psychometric Theory (3rd ed.). New York: McGraw-Hill. Oguzturk, O. (2008). Differences in quality of life in rural and urban populations. Clinical and Investigative Medicine, 31, E346-E350. Panepinto, J. A., Hoffmann, R. G., & Pajewski, N. M (2009). A psy- chometric evaluation of the PedsQLTM family impact module in par- ents of children with sickle cell disease. Health and Quality of Life Outcomes, 7, 11p. http://www.hqlo.com/content/7/1/32. doi:10.1186/1477-7525-7-32 Reinfjell, T., Diseth, T. H., Veenstra, M., & Vikan, A. (2006). Measur- ing health-related quality of life in young adolescents: Reliability and validity in the Norwegian version of the Pediatric Quality of Life In- ventory™ 4.0 (PedsQL) generic core scales. Health and Quality of Life Outcomes, 4, 9 pp. doi:10.1186/1477-7525-4-61 Rumeau-Rouquette, C., Blondel, B., Kaminski, M., et al. (1993). Epidé- miologie Méthodes et Pratique. Paris: Flammarion Medecine Sciences. Sabbah, I., Drouby, N., Sabbah, S., Retel-Rude, N., & Mercier, M. (2003). Quality of life in rural and urban populations in Lebanon us- ing SF-36 health survey. Health and Quality of Life Outcomes, 1, 14p. http://www.hqlo.com/content/1/1/30. doi:10.1186/1477-7525-1-30 Sabbah, I., Vuitton, D.-A., Droubi, N., Sabbah, S., & Mercier, M. (2007). Morbidity and associated factors in rural and urban popula- tions of South Lebanon: A cross-sectional community-based study of self-reported health in 2000. Tropical Medicine and International Health, 12, 907-919. doi:10.1111/j.1365-3156.2007.01886.x Sandeberg, M. af., Johansson, E. M., Hagell, P., & Wettergren, L. (2010). Psychometric properties of the DISABKIDS chronic generic module (DCGM-37) when used in children undergoing treatment for cancer. Health and Quality of Life Outcomes, 8, 7. doi:10.1186/1477-7525-8-109 Sato, I., Higuchi, A., Yanagisawa, T., Mukasa, A., Ida, K., Sawamura, Y., Kamibeppu, K. (2010). Development of the Japanese version of the pediatric quality of life inventory™ brain tumor module. Health and Quality of Life Outcomes, 8, 14 pp. doi:10.1186/1477-7525-8-38 Schmidt, A., Wenninger, K., Niemann, N., Wahn, U., & Staab D. (2009). Health-related quality of life in children with cystic fibrosis: Validation of the German CFQ-R. Health and Quality of Life Out- comes, 7, 10 pp. doi:10.1186/1477-7525-7-97 Solans, M., Pane, S., Estrada, M.-D., Serra-Sutton, V., Berra, S., Herdman, M., Alonso, J., & Rajmil, L. (2008). Health-related quality of life measurement in children and adolescents:A systematic review of generic and disease-specific instruments. Value in Health, 11, 742-764. doi:10.1111/j.1524-4733.2007.00293.x Stevanovic, D. (2009). Serbian KINDL questionnaire for quality of life assessments in healthy children and adolescents: Reproducibility and construct validity. Health and Quality of Life Outcomes, 7, 7. doi:10.1186/1477-7525-7-79 Sung, L., Klaassen, R. J., Dix, D., Pritchard, S.,Yanofsky, R., Dzol- ganovski, B., & Klassen, A. (2009). Identification of paediatric can- cer patients with poor quality of life. British Journal of Cancer, 100, 82-88. doi:10.1038/sj.bjc.6604826 Tarride, J.-E., Burke, N., Bischof, M., Hopkins, R. B., Goeree, L., Campbell, K., & Goeree, R. (2010). A review of health utilities across conditions common in paediatric and adult populations. Health and Quality of Life Outcomes, 8, 11 pp. doi:10.1186/1477-7525-8-12 Torres, C. S., Paiva, S. M., Vale, M. P., Pordeus, I. A., Ramos-Jorge, M. L., Oliveira, A. C., & Allison, P. J. (2009). Psychometric properties of the Brazilian version of the child perceptions questionnaire (CPQ11-14)—Short forms. Health and Quality of Life Outcomes, 7, 7. doi:10.1186/1477-7525-7-43 Upton, P., Eiser, C., Cheung, I., Hutchings, H. A., Jenney, M., Mad- docks, A., Russell, I. T., & Williams J. G. (2005). Measurement properties of the UK English version of the pediatric quality of life inventory 4.0 (PedsQL) generic core scales. Health and Quality of Life Outcomes, 3, 7 pp. doi:10.1186/1477-7525-3-22 Vanderbilt University, Department of Biostatistics (2009). PS: Power and Sample Size Calculation. http://biostat.mc.vanderbilt.edu/wiki/Main/PowerSampleSize. Varni, J. W. (1998-2012). The PedsQLTM: Measurement model for the pediatric quality of life inventoryTM. Peds MetricsTM Qualifying the QualitativeSM. http://www.pedsql.org Varni, J. W. et al. (1999). The PedsQLTM: Measurement model for the pediatric quality of life inventory. Medical Care, 37, 126-139. doi:10.1097/00005650-199902000-00003 Varni, J. W. et al. (2001). The PedsQLTM4.0: Reliability and validity of the pediatric quality of life inventoryTM version 4.0 generic core scales in healthy and patient populations. Medical Care, 39, 800-812. doi:10.1097/00005650-200108000-00006 Varni, J. W. et al. (2002). The PedsQLTM4.0 generic core scales: Sensi- tivity, responsiveness, and impact on clinical decision-making. Journal of Behavioral Medicine, 25, 175-193. doi:10.1023/A:1014836921812 Varni, J. W., Burwinkle, T. M., Katz, E. R., Meeske, K., & Dickinson, P. (2002). The PedsQLTM in pediatric cancer reliability and validity of the pediatric quality of life inventory™ generic core scales, multi- dimensional fatigue scale, and cancer module. Cancer, 94, 2090- 2106. doi:10.1002/cncr.10428 Varni, J. W., Burwinkle, T. M., Seid, M., & Skarr, D. (2003). The PedsQL4.0 as a pediatric population health measure: Feasibility, re- liability, and validity. Ambulatory Pediatrics, 3, 329-341. doi:10.1367/1539-4409(2003)003<0329:TPAAPP>2.0.CO;2 Varni, J. W., Burwinkle, T. M., & Lane, M. M. (2005). Health-related quality of life measurement in pediatric clinical practice: An ap- praisal and precept for future research and application. Health and Quality of Life Outcomes, 3, 9. doi:10.1186/1477-7525-3-34 Varni, J. W., & Burwinkle, T. M. (2006). The PedsQLTM as a pa- tient-reported outcome in children and adolescents with Attention- Deficit/Hyperactivity Disorder: A population-based study. Health and Quality of Life Outcomes, 4, 10 pp. doi:10.1186/1477-7525-4-26 Varni, J. W, Limbers, C., & Burwinkle, T. M. (2007). Literature review: Health-related quality of life measurement in pediatric oncology: Hearing the voices of the children. Journal of Pediatric Psychology, 32, 1-13. doi:10.1093/jpepsy/jsm008 Varni, J. W., & Limbers, C. A. (2009). The PedsQLTM4.0 generic core scales young adult version: Feasibility, reliability and validity in a university student population. Journal of Health Psychology, 14, 611-622. doi:10.1177/1359105309103580 Verrips, E. G. H, Vogels, T. G. C., Koopman, H. M, Theunissen, N. C. M, Kamphuis, R. P., Fekkes, M, Wit, J. M., & Verloove-Vanhorick, P. S. (1999). Measuring health-related quality of life in a child popu- lation. International Child Health, 9, 188-193. http://eurpub.oxfordjournals.org/content/9/3/188.full.pdf. Villalonga-Olives, E., Rojas-Farreras, S., Vilagut, G., Palacio-Vieira, J. Copyright © 2012 SciRes. 969  I. SABBAH ET AL. Copyright © 2012 SciRes. 970 A., Valderas, J., & Herdman, M. (2010). Impact of recent life events on the health related quality of life of adolescents and youths: The role of gender and life events typologies in a follow-up study. Health and Quality of Life Outcomes, 8, 9 pp. doi:10.1186/1477-7525-8-71. Ware, J. E. Jr. (1997). SF-36 health survey manuel and interpretation guide. Second printing. Boston, MA: The Health Institute, New England Center. World Health Organization (1993). The International Statistical Classi- fication of Diseases and Related Health Problems (10th revision). Geneva, Europe: World Health Organization.
|