Computational Water, Energy, and Environmental Engineering, 2012, 1, 31-36
http://dx.doi.org/10.4236/cweee.2012.13004 Published Online October 2012 (http://www.SciRP.org/journal/cweee)
Design and Operation of Small-Scale Photovoltaic-Driven
Reverse Osmosis (PV-RO) Desalination Plant for Water
Supply in Rural Areas
Fawzi Banat1, Hazim Qiblawey2, Qais Al-Nasser3
1Department of Chemical Engineering, The Petroleum Institute, Abu Dhabi, United Arab Emirates
2Department of Chemical Engineering, Qatar University, Doha, Qatar
3Department of Chemical Engineering, Jordan University of Science and Technology, Irbid, Jordan
Email: fbanat@pi.ac.ae
Received August 30, 2012; revised September 3, 2012; accepted October 10, 2012
ABSTRACT
The alarming water and energy crisis in many regions of the world can be eased by combining renewable energy with
desalination technologies. The ADIRA project funded by the EU looked for demonstrating the feasibility of water de-
salination in areas around the Mediterranean by installing a number of autonomous desalination systems (ADS) which
are able to convert brackish or seawater into potable water for the needs of small communities. W ithin the activities of
the ADIRA project a reverse osmosis unit powered by photov oltaic electricity was installed in a village in the northern
part of Jordan with a capacity of 0.5 m3/day. The system was composed of a softener, reverse osmosis unit, PV panels
(432 Wp) and storage batteries. Residential type “OSMONICS” membrane (TFM-100) was utilized in the RO unit.
Field tests were performed on brackish water (1700 mg/L total dissolved solids (TDS)). This paper sheds the light on
the process flow diagram, sizing of the system main components and presents some of the results obtained.
Keywords: Reverse Osmosis; Water Filters; Ion Exchange System; Membranes; Carbon Filters
1. Introduction
Small capacity desalination units utilizing the reverse
osmosis (RO) technology and powered by photovoltaic
(PV) cells, is a potential solution for providing freshwa-
ter to small commin utes in isolated arid areas that have 1)
saline water problems; 2) no access to the electricity grid;
and 3) plenty solar resources. PVRO has minimal envi-
ronmental impact, can be easily designed and assembled
for different demand profiles using modular components
[1], and can be easily maintained and repaired.
Options of PV-RO configurations are available to over-
come the intermittent nature of solar power, th ese are: 1)
Use of fossil fuel to make up the gaps (grid-connected
systems), 2) store the solar energy, 3) run the desalina-
tion plant intermittently. Systems without a grid-connec-
tion are generally described as standalone or autonomous
systems.
Numerous renewable energy-powered RO plants, pri-
marily PV-battery systems of small to medium capacity
(0.5 to 50 m3/day), have been built in different locations
of the world. For example, Herold and Neskakis [2] pre-
sented a small PV-driven reverse osmosis desalination
plant on th e island o f Gran Cana ria with an ave rage da ily
drinking water production of 0.8 - 3 m3/d. The plant was
supplied by a stand-alone 4.8 kWp photovoltaic (PV)
system with additional battery storage of 60 kWh. The
nominal production was 1 m3/day. The specific energy
consumption of th is system was considered high with 16
$/m3 production cost.
The Energy Research Institute o f King Abdulaziz City
for Science and Technology (KACST) conducted exten-
sive research on a PV-battery-inverter RO system in Sa-
dous, Saudi Arabia. The RO system produced on average
5.7 m3/day, converting brackish water from 5700 ppm
TDS to 170 ppm TD S w ith an av era ge 30 % r ecov er y rate
[3].
In 2001 Solar Energy Systems (SES) in Australia work-
ed on commercializing a PV-RO unit, developed at Mur-
doch University, that is capable of producing 100 gallons
per day of water from feed water containing up to 5000
ppm TDS [4]. They installed approximately 20 systems,
primarily in the desert area of Australia. The system was
designed for 15 to 20 percent water recovery. Part of the
reasoning for the low water recovery was to reduce pro-
blems with scaling.
Carvalho et al. [5] presented the cost of PV-RO de-
salination plant with batteries in stalled in the community
of Ceara, of Brazil. The specific energy consumption of
C
opyright © 2012 SciRes. CWEEE
F. BANAT ET AL.
32
produced water was around 3.03 kWh/m3 with cost of
12.76 $/m3.
Riffel and Carvalho [6] presented a small-scale battery-
less PV-RO plant for stand-alone applications that oper-
ates at variable flow/pressure conditions in equatorial ar-
eas to desalinate brackish water.
Mohamed et al. [7] presented the experimental results
of a small seawater RO system, installed at the Univer-
sity of Athens, equipped with an ERD of the Clark pump
type.
Qiblawey et al. [8] presented experimental results of a
PV powered household RO unit installed in Jordan and
operated with tap water having 350 mg/L and 720 mg/L
total dissolved solids. The unit was operated with and
without storage batteries. The specific energy consump-
tion of the battery system ranged from 1.1 kWh/m3 to 4.3
kWh/m3 and ranged from 1.1 kWh/m3 to 1.5 kWh/m3 for
the battery-less system.
In the context of ADIRA project a PV-RO unit with
production capacity of 0.5 m3/day was designed and in-
stalled in a village in the northern part of Jordan. The
ADIRA project is one of the MEDA projects financially
supported by the European Union (EU) for the develop-
ment of the water sector in the Middle Eastern and North
African (MENA) countries. This paper presents sizing of
the unit components alon g with some results.
2. Method
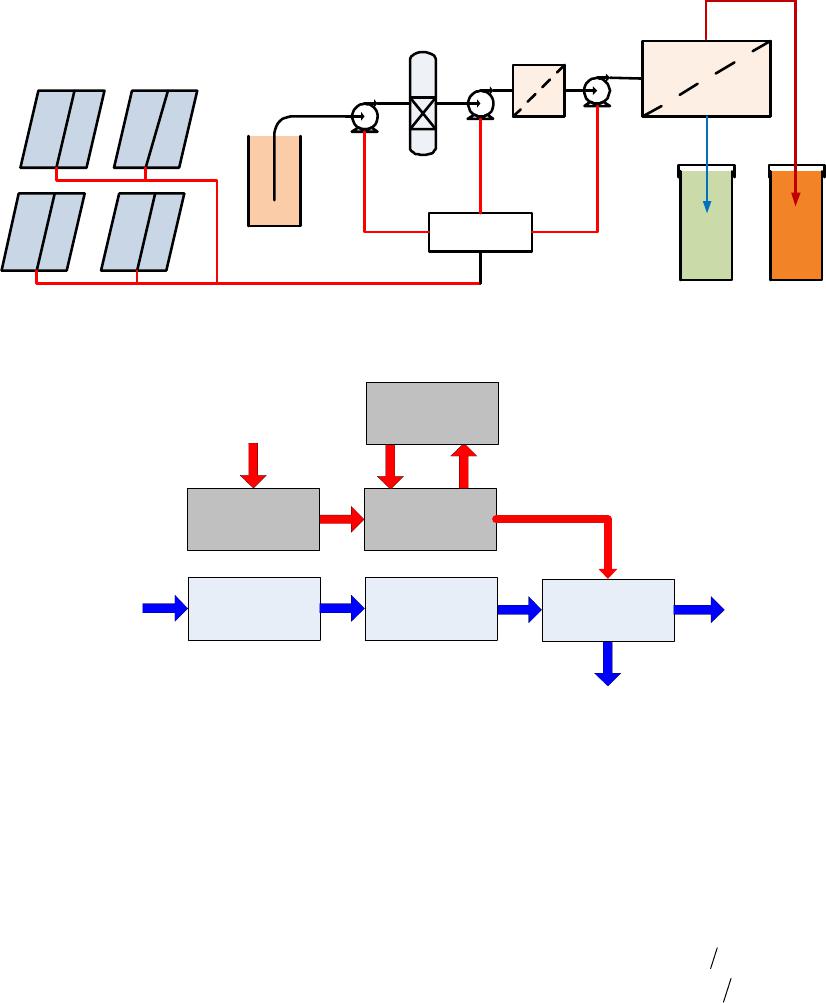
2.1. Process flow diagram
The process flow diagram of the PV-RO system is shown
in Figure 1. The system has three major components, a
PV array, a spiral wound membrane module, and a sof-
tener. The softener treats raw water from mineral ions
that cause scaling problems. The pretreatment step con-
sists of 4 stages: Softener, 5 Micron sediment filter,
granular activated carbon filter (GAC) and 1 Micron
sidemen filter. The system was fed with untreated brack-
ish water with a salinity of 1700 mg/L. In these experi-
ments, four residential membrane modulesOSMON-
ICS” type (TFM-100) were utilized. Electricity needed
by the system was partially supplied by the PV array
which consists from 8 PV modules each 54 Wp. Since
the RO unit needs a stable power supply, two batteries
(12 V, 230 Ah) were connected in series to increase the
voltage up to 24 V. The energy produced by the PV is
transferred through the solar charge regulator to battery
storage capable of storing enough energy for extra opera-
tion hours after sunset. The stored energy is transferred
back to regulator unit for powering the loads.
Solar charge controller was used to connect PV panels
to storage batteries. Charge controllers block reverse
current and prevent battery overcharge. Also prevent
battery over discharge, protect from electrical overload,
and display battery status. Its purpose is to keep batteries
and loads properly fed and safe for the long term. A se-
ries of temperature sensors (Pico Technology, UK) were
installed throughout the system in order to measure the
temperature of ambient, feed water, and the PV panels.
Two flow meters (FLR1000, USA) were installed to
measure the volumetric flow rate of raw water feed and
permeate. A pressure sensor (Omega PX309, USA) was
installed in the feed stream to control the pressure of the
feed pump. TDS probes (HMDigital, USA) were in-
stalled in the feed stream and in the permeate stream in
order to measure the quality of fed and treated water. A
pyranometer (PYR-PA2.5, USA) was installed to meas-
ure the global irradiation during the operation time. Two
clamps meter (Pico Technology, UK) were installed to
measure the available current from PV and to measure
the charger current of batteries.
The rechargeable batteries used aimed mainly for stor-
ing energy during the day to make it available through
nights to ensure continuous operation. Figure 2 shows
illustrative block diagram of the PV-RO system. The
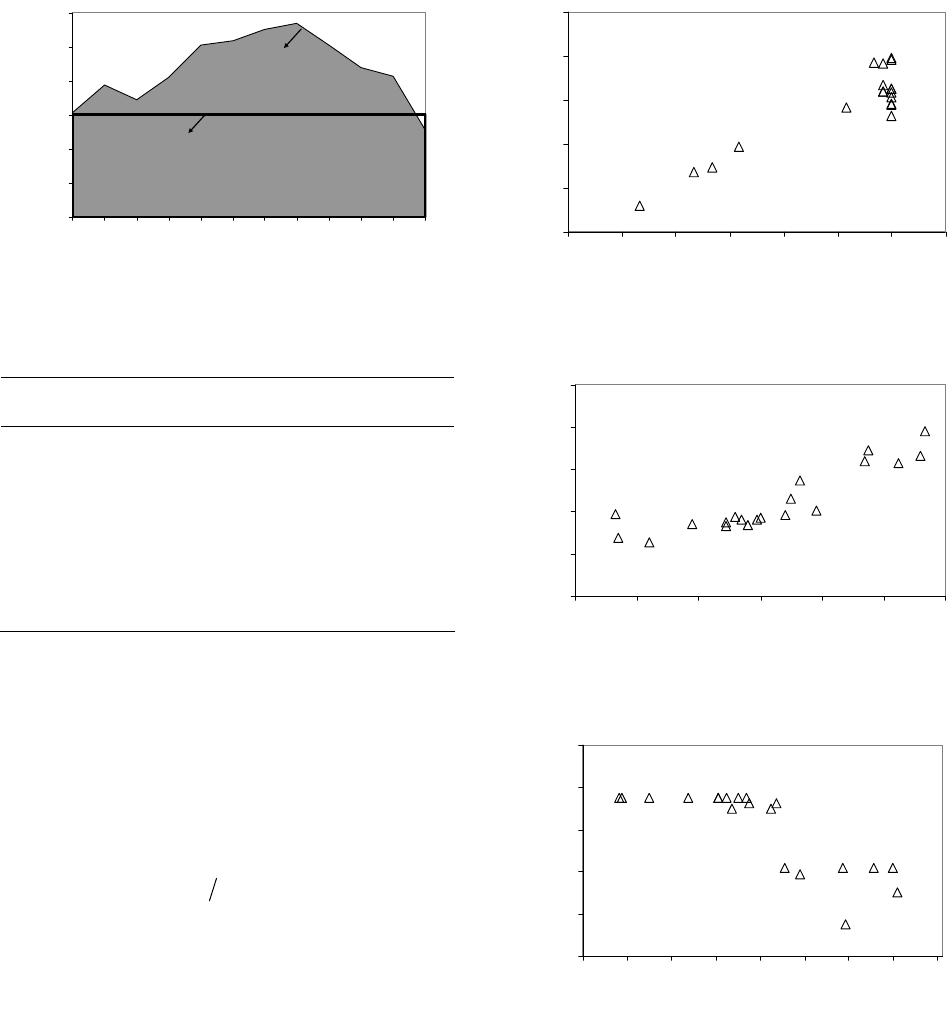
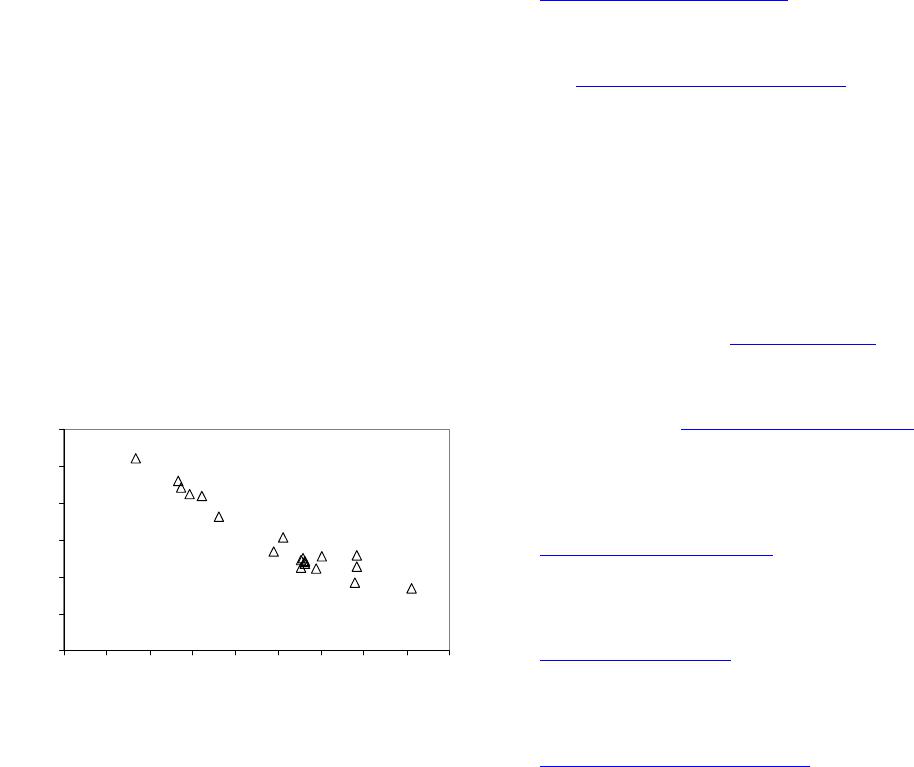
system was tested for about 10 months; the aim of the
system testing was to investigate the water production
quantity and quality as well as the specific energy con-
sumption of the unit under different operating condi-
tions.
2.2. Sizing of the System
2.2.1. Daily En e rgy Requirement
The total daily energy requirements for the RO unit, sof-
tener unit and the auxiliaries (sensors, data acquisition
system etc.) have been determined as follows:
2.2.2. RO Lo a d
Two high pressure pumps (HPP): Volts = 24 VDC,
Maximum current = 1.2 A
Power of one HPP = 24 * 1.2 = 28.8 W
Total Power = 28.8 * 2 = 57.6 W
Hours of o pe ration (av erage p e r da y ) = 8 h
Total RO energy required/day = 57.6 * 8 = 460.8 Wh
2.2.3. Intake Pump
Intake pump: Volts = 220 VAC, 50 Hz, Current = 0.54 A,
Output p ower = 60 W
Load including inverter losses (assuming the inverter
losses (ηinv) to be about 10% = 60/0.9 = 66.7 W
Hours of o pe ration = 8 h
Total energy required/day = 66.7 * 8 = 533.3 Wh
2.2.4. Softener Feed Pump
Softener pump: Volts = 230 VAC, 50 Hz, Current = 6.2
A, Output pow er = 1.0 h p
Power of Soften er pump = 1 hp = 746 W
Copyright © 2012 SciRes. CWEEE
F. BANAT ET AL.
Copyright © 2012 SciRes. CWEEE
33
Salt Water
Int ake
Softener
Fresh Water
Tank
Control
Electronics
PV ArraySoften er
Pump
Feed
Pump
Pre-Filter
AssemblyHigh P ress ur e
Pump RO
Modules
Reject Water
Tank
Figure 1. Process flow diagram.
Sola r Re gu la tor
12 V/24 V, 20 A
Solar Energy
PV Panel
(34.8 V, 433 Wp)
Re
j
ect wate r
RO Unit
(57.6 W , 24 VDC)
Fresh
water
Intak e Pump
(60 W, 220 VAC)
Soft en er Unit
(746 W, 220 V AC)
Feed
Water
Battery set
(230 Ah, 24 V)
Po wer L i n e
Figure 2. Block diagram of the system.
Load including inverter losses = 746/0.9 = 828.9 W
Hours of o per ation = 8 h
Total energy requ ired/day = 828.9 * 8 = 6631.2 Wh
2.2.5. Auxiliaries Load
Data acquisition system including sensors: Volts = 10
VDC, Current = 100 - 500 mA.
Maximum Power = 0.5 A * 1 0 V = 5 W
Hours of o pe ration = 24 h
Total Auxiliaries energy required/day = 5 * 24 = 120
Wh
Solar charge regulator: Volts = 24 VDC, Current = 15.8
mA
Maximum Power = 0.0 1 58 A * 24 V = 0.38 W
Hours of operati on = 2 4 h
Total energy required/day = 0.38 * 24 = 9.1 Wh
The daily energy required including the losses for in-
verters = 460.8 + 533.3 + 6631.2 + 120 + 9.1 = 7754.4
Wh/day.
2.2.6. PV Pane ls
The theoretical daily energy requirement for the system
is about 7.754 kWh/day (EL), including the inverter
losses.
The battery losses (ηb) is about 15% [9] and the PV
thermal losses (ηth) is about 15% [9] also. The average
peak sunshine hour (PSSH) in Jordan is about 7 h. The
peak power of the PV module can be determined as fol-
lows:

Lth
power of the PVE(PSSH)
7.75470.85 0.85
1.533KWp
Peak b



The size of PV module must be such as to produce
1.533 kW with operating voltage more than 24 V, in or-
der to charge the batteries. Commercially available PV
modules of polycrystalline silicon type of 54 Wp as peak
power were selected (ISC = 3.31 A, V
OC = 21.7 V, Im =
3.11 A, Vm = 17.4 V at STC). The system needs ap-
proximately 30 (1533/54) PV modules in order to cover
the daily energy requirements. Considering that the DC
side operating voltage of 24 V, then 2 PV modules in
series are required (2 * 17.4 = 34.8 V). These (2 PV
F. BANAT ET AL.
34
modules in series) have to be organized in sub-arrays of
15 parallel strings (15 * 3.11 A = 46.65 A), each string
connected to the charge controller. The total array peak
power is (3 .11 A * 17.4 V) * (2 * 15) = 1.6 23 kWp.
In the initial design of the PV modules; only the en-
ergy required for high pressure pumps as well as the aux-
iliaries were considered with 2 4 hou rs of o peration ({(2 *
24 V * 1.2 A) + (5 W + 0.38 W)} * 24 = 1511.52
Wh/day). Intake pump and the softener pump were in-
stalled later to improve the operational efficiency of the
RO unit, and they were powered directly from the elec-
tricity grid, not from the PV array. The desired peak
power of the PV module based on the new consideration
is about 350 Wp (1511.52/(6 * 0.85 * 0.85)), the aver-
age peak sunshine of 6 h is used to be on the safe side.
The PV array of the system consists of 4 parallel
strings each of 2 series PV modules, the total array peak
power of the system is 432.9 Wp ((3.11 * 17.4) * (2 * 4))
which covers the amount of energy required.
2.2.7. Battery Storage
The battery of the PV-RO system was designed to act as
energy storage to run the system whenever insufficient
solar irradiation is available (cloudy days and nights). If
80% [9] maximum depth of discharge (DOD) is consid-
ered, the required maximum battery capacity per day is
calculated as follows:


Lb
Battery capacity (Wh)EDOD
1511.52 0.8 0.85
2223 Wh



Two batteries of 2760 Wh (230 Ah * 12 V) connected
in series were selected, producing 5520 Wh (230 Ah * 24
V) in total. The battery storage was able to operate the
RO unit for more than 59 h continua lly.
 


L
DOAdayBattery capacityWhDODEWhd
5520 0.8 0.85 1511.522.48days59.6h
b

 
2.2.8. Charge Reg ulator
Charge regulators (controllers) are rated based on the
amount of amperage they can process from a solar array.
If a controller is rated at 20 amps it means that you can
connect up to 20 amps of solar panel output current to
this controller. A suitable charge regulator was used in
the PV-RO system with the specification of 12 V/24 V,
20 A.
3. Results and Discussion
3.1. Metrological Data
Average values of solar irradiation (W/m2), insolation
(kWh/m2/d), and ambient temperature (˚C) were recorded
for different months during the year 2007 and presented in
Table 1. As shown, the month of September was the hottest
(26˚C) with the highest solar insolation (7.5 kWh/m2/d).
The RO unit was designed to operate 24 h/day. The
energy required was supplied by a PV array and battery
storage was used to power the unit during the low solar
intensity periods. The generated energy form the PV array
varied in accordance with variations in the environmental
conditions (insolation and ambient temperature). These
variations affected the amount of daily produced water.
The average daily generated energy was calculated
during different months depending on the peak power of
the PV array (Ppeak), average daily peak sunshine hours
(PSSH), battery efficiency factor (ηb), and the PV array
thermal factor (ηth), and can be determined as follows:
generated peak
EPPSSH th b


Using the above equation, a comparison was made
between the average daily generated energy during
months and that required by the load to operate the sys-
tem for 24 h daily as shown in Figure 3.
As shown in Figure 3 the energy generated during
summer months exceeds that required by the s ystem (ex-
cluding the softener and feed pump) by about 40%. The
energy generated varies from month to month depending
mainly on the sky if sunny or cloudy.
3.2. System Performance
The solar irradiation and the ambient temperature had a
significant influence on the performance of the PV sys-
tem. As irradiation increases, the PV current increases
significantly due to high energy absorbed by the PV
modules. It increased by 46% when the irradiation in-
creased by 52% as illustrated in Table 2. The power
output follows the behavior of the modules current and
increases as irradiation increases. Slight variation in the
PV voltage was observed when the irradiation increased.
Table 1. Monthly average values for insolation, irradiation,
and ambient temperature.
Month Insolation
(kWh/m2/d) Irrad.
(W/m2) Ambient Temperature (˚C )
Av. Max. Min.
Sep, 077.5 595.4 26 40 18
Oct, 076.65 564.3 24 39 14
Nov, 075.3 485.4 17 33 6
Dec, 074.8 457.3 11.5 23 1.7
Jan, 084.7 442.2 7 19.3 0
Feb, 085.5 480 10.6 27.6 1.4
Mar, 086.6 531 18.6 37.7 5.1
Copyright © 2012 SciRes. CWEEE
F. BANAT ET AL. 35
Daily re quir ed
energ y by RO
Average daily
generated energy
0
0.5
1
1.5
2
2.5
3
Jan
Feb
Mar
Apr
May
Jun
Jul
Aug
Sep
Oct
Nov
Dec
Months
Energy (kWh/da y )
Figure 3. The average daily generated energy versus the
required by the RO unit at different months.
Table 2. The effect of irradiation on the power output.
Irradiation
(W/m2) Module Ampere
(A) Array Ampere
(A) Array Power (W)
0 0 0 0.0
200 0.75 3 104.4
400 1.25 5 174.0
600 2 8 278.4
800 2.6 10.4 361.9
1000 3.11 12.44 432.9
3.2.1. S pe cific Energy Consu m ption
The theoretical specific energy consumption (SEC) for
the PV-RO system was determined as follows:
SEC (kWh/m3) = Input Power * Opr. hours/Daily
produced flow
3
Input powersoftener pump powerintake pum
p
power
+high pressure pump power
=746 + 60 +57.6 =863.6 W
SEC=13.82 kWhm

 

With the sof tener the SEC was 13.82 kWh/m3 but was
1.9 kWh/m3 without it.
3.2.2. S ystem Res ults
At an operating pressure of 4.5 bar, the average feed flow
was 99 L/h and the permeate flow was around 34 L/h
(34% permeate recovery). Operating the system for three
hours produced 11 9 L of pe r meate as shown in Figure 4.
The effect of feed temperature on both of recovery and
salt rejection are illustrated in Figures 5 and 6, respective-
ly. The percentage of recovery increased from 30% to
38% when feed water temperature increased from 12.4˚C
to 21.2 ˚C, and the rejection of salts decreased from 98%
to 97.4% when feed water temperature increased from
13.8˚C to 21.4˚C.
0
30
60
90
120
150
0.0
0.5
1.0
1.5
2.0
2.5
3.0
3.5
Operating hours (h)
Daily production (L/d)
Figure 4. Daily production as a function of operating hours
(operating pressure = 4.5 bar).
25%
29%
33%
37%
41%
45%
10. 0
12. 0
14.0
16. 0
18.0
20.0
22. 0
Temperature
o
C
%Recovery
Figure 5. Percentage recovery as a function of feed tem-
perature (operating pressure = 4.5 bar).
97.2%
97.4%
97.6%
97.8%
98.0%
98.2%
10.0
11.6
13.2
14.8
16.4
18.0
19.6
21.2
22.8
Temperature
o
C
%Salt Rejection
Figure 6. Percentage of salt rejection as a function of feed
temperature (operating pressure = 4.5 bar).
At an operating pressure of 4.5 bar, the average feed
flow was 99 L/h and the permeate flow was around 34
L/h (34% permeate recovery). Operating the system for
three hours produced 119 L of permeate as shown in
Figure 4.
The effect of feed temperature on both of recovery and
salt rejection are illustrated in Figures 5 and 6, respec-
tively. The percentage of recovery increased from 30% to
Copyright © 2012 SciRes. CWEEE
F. BANAT ET AL.
Copyright © 2012 SciRes. CWEEE
36
5. Acknowledgements
38% when feed water temperature increased from 12.4˚C
to 21.2˚C, and the rejection of salts decreased from This work was supported by funds from the European
Union through the ADIRA project. Financial support
from the Petroleum Institute in Abu Dhabi to publish the
work is gratefully acknowledged.
98% to 97.4% when feed water temperature increased
from 13.8˚C to 21.4˚C.
The recovery percentage affected salt passage through
the membrane. In fact, the increase in recovery was asso-
ciated with a decrease in salt rejection. For example, as
the recovery percentage increased from 30% to 40%, the
salt rejection decreased from 98% to 97.5%. REFERENCES
[1] L. Garcia-Rodriguez, “Renewable Energy Applications in
Desalination: State of the Art,” Solar Energy, Vol. 75, No.
5, 2003, pp. 381-393.
doi:10.1016/j.solener.2003.08.005
The average specific energy consumption (SEC) was
about 26 kWh/m3 at an operating pressure of 4.5. The
SEC reached 19.4 kWh/m3 for a recovery percentage of
40.6% and reached 32 kWh/m3 for 30% of recovery as
shown in Figure 7.
[2] D. Herold and A. Neskakis, “A Small PV-Driven Reverse
Osmosis Desalination Plant on the Island of Gran Ca-
naria,” Desalination, Vol. 137, No. 1-3, 2001, pp. 285-
292. doi:10.1016/S0011-9164(01)00230-2
4. Conclusions [3] Energy Research Institute of King Abdulaziz City for
Science and Technology, “Photovoltaic Water Pumping
and Desalination at Sadous Village,” Newsletter of The
Middle East Desalination Research Center, Saudi Arabia.
Design and sizing of the PV-RO unit components was
presented. The main conclusions of this work are:
1) The percentage recovery was temperature depend-
ent and increased from 29 to 41% when temperature was
increased from 11˚C to 22˚C. However, the salt reject
slightly decreased with temperature increase.
[4] K. Mathew, S. Dallas, G. Ho and M. Anda, “Innovative Solar
Powered Village Potable Water Supply,” Proceedings of
Women Leaders on the Uptake of Renewable Energy Seminar,
Perth, 2001.
[5] P. Carvalho, D. Riffel, C. Freire and F. Montenegro, “The
Brazilian Experience with a Photovoltaic Powered Re-
verse Osmosis Plant,” Progress in Photovoltaics, Vol. 12,
No. 5, 2004, pp. 373-385. doi:10.1002/pip.543
2) The actual specific energy consumption depended
on recovery percentage and was in the range of 19 to 32
kWh/m3.
3) Installing the softener before the RO unit to pretreat
brackish water solved the problem of scaling. [6] D. Riffel and P. Carvalho, “Small-Scale Photovoltaic-
Powered Reverse Osmosis Plant without Batteries: De-
sign and Simulation,” Desalination, Vol. 247, No. 1-3,
2009, pp. 378-389. doi:10.1016/j.desal.2008.07.019
25%
28%
31%
34%
37%
40%
43%
16
18
20
22
24
26
28
30
32
34
Specific Energy Cons umption (kWh/m
3
)
%Recovery
[7] E. Mohamed, G. Papadakis, E. Mathioulakis and V.
Belessiotis, “The Effect of Hydraulic Energy Recovery in
a Small Sea Water Reverse Osmosis Desalination System;
Experimental and Economical Evaluation,” Desalination,
Vol. 184, No. 1-3, 2005, pp. 241-246.
doi:10.1016/j.desal.2005.02.066
[8] H. Qiblawey, F. Banat and Q. Al-Nasser, “Laboratory
Setup for Water Purification Using Household PV-Driven
Reverse Osmosis Unit,” Desalination and Water Treat-
ment, Vol. 7, No. 3, 2009, pp. 53-59.
doi:10.5004/dwt.2009.695
[9] G. Ahmad and J. Schmidt, “Feasibility Study of Brackish
Water Desalination in the Egyptian Deserts and rural Re-
gions Using PV Systems,” Energy Conversion and Man-
agement, Vol. 43, No. 18, 2002, pp. 2641-2649.
doi:10.1016/S0196-8904(01)00189-3
Figure 7. The relati on between recovery perc entage and the
specific energy consumption (operating pressure = 4.5 bar).