Journal of Surface Engineered Materials and Advanced Technology, 2012, 2, 292-294
http://dx.doi.org/10.4236/jsemat.2012.24044 Published Online October 2012 (http://www.SciRP.org/journal/jsemat)
Plastic Waste Management by Substituting Natural Fibres
Surabhi Srivastava
Department of Civil Engineering, Bahra University, Shimla Hills, Himachal Pradesh, India.
Email: surabhi0065@gmail.com
Received December 31st, 2011; revised February 1st, 2012; accepted February 11th, 2012
ABSTRACT
This paper presents substitute for non-biodegradable plastic packed material which comes as a part of municipal solid
waste and becoming global problem due to its overuse. The plastic as packaging material has its advantages but also
have more disadvantages because of its durability that it does not degraded. If the packaging material is made up of
natural fibres it has more effect on local ecosystem. This paper provides the solution that use of natural fibres as pack-
aging due to its light weight, high strength to weight ratio, corrosion resistance and other advantages are useful for the
industry as well as commercially availability for the markets.
Keywords: Solid Waste; Biodegradable; Non-Biodegradable; Plastic; Natural Fibres
1. Introduction
In developing countries of the world, plastic waste has
become a current challenge for the environmental engi-
neers to solve. For an example developing country like
India, statistics show that the exponential growth rate of
India with 1,210,000,000 (1.21 billion) people is the
second most populous country in the world, while China
is on the top with over 1,350,044,605 (1.35 billion) peo-
ple. The figures show that India represents almost
17.31% of the world's population, which means one out
of six people on this planet live in India. Although, the
crown of the world's most populous country is on China’s
head for decades, India is all set to take the numerous
positions by 2030. With the population growth rate at
1.58%, India is predicted to have more than 1.53 billion
people by the end of 2030. Being second most populous
country in the wor ld, India continuously k eeps on adding
waste material within its geographical boundaries. India
has about 16% of the world population and 2.5% of
world’s land area. In an already densely populated coun-
try with even more densely packed urban centers, land
for proper waste treatment, disposal and overall man-
agement is scarce. Recent and sustained economic
growth increasing living standards of the people, in-
creased manufacturing and production activities has led
to increased to rapid rise in the waste generation rated [1].
India produces around 42 Million tons of solid waste
annually. There is wide difference in the waste genera-
tion rates in rural and urban areas. Even within the urban
areas, the composition includes more paper and inert
material and less of organic and compostable material as
the city population and size increases. The per capita ge n-
eration rate increases and the overall calorific value of
the waste drops with increase in the size of the city
(Study by NEE RI).
Now with the above data we can calculate the per day
generation of solid waste of India & also we can calcu-
late the expected cost for its management which can be
done by the processes minimization, recycling & dis-
posal of the solid waste generated. These processes have
been adopted by the most developed countries as the
menu for developing solid waste management strategies
[2,3]. Depending upon a number of factors such as to-
pography climate [4], population density (village to metro
city), transportation infrastructure, socioeconomic and
environmental laws of India it is important to make proper
pre action plan to manage solid waste.
2. Composition of Municipal Solid Waste in
India
The biodegradable portion dominates the bulk of Mu-
nicipal Solid Waste. Generally the biod egradable portion
is mainly due to food and yard waste. With rising ur-
banization and change in lifestyle and food habits, the
amount of municipal solid waste has been increasing
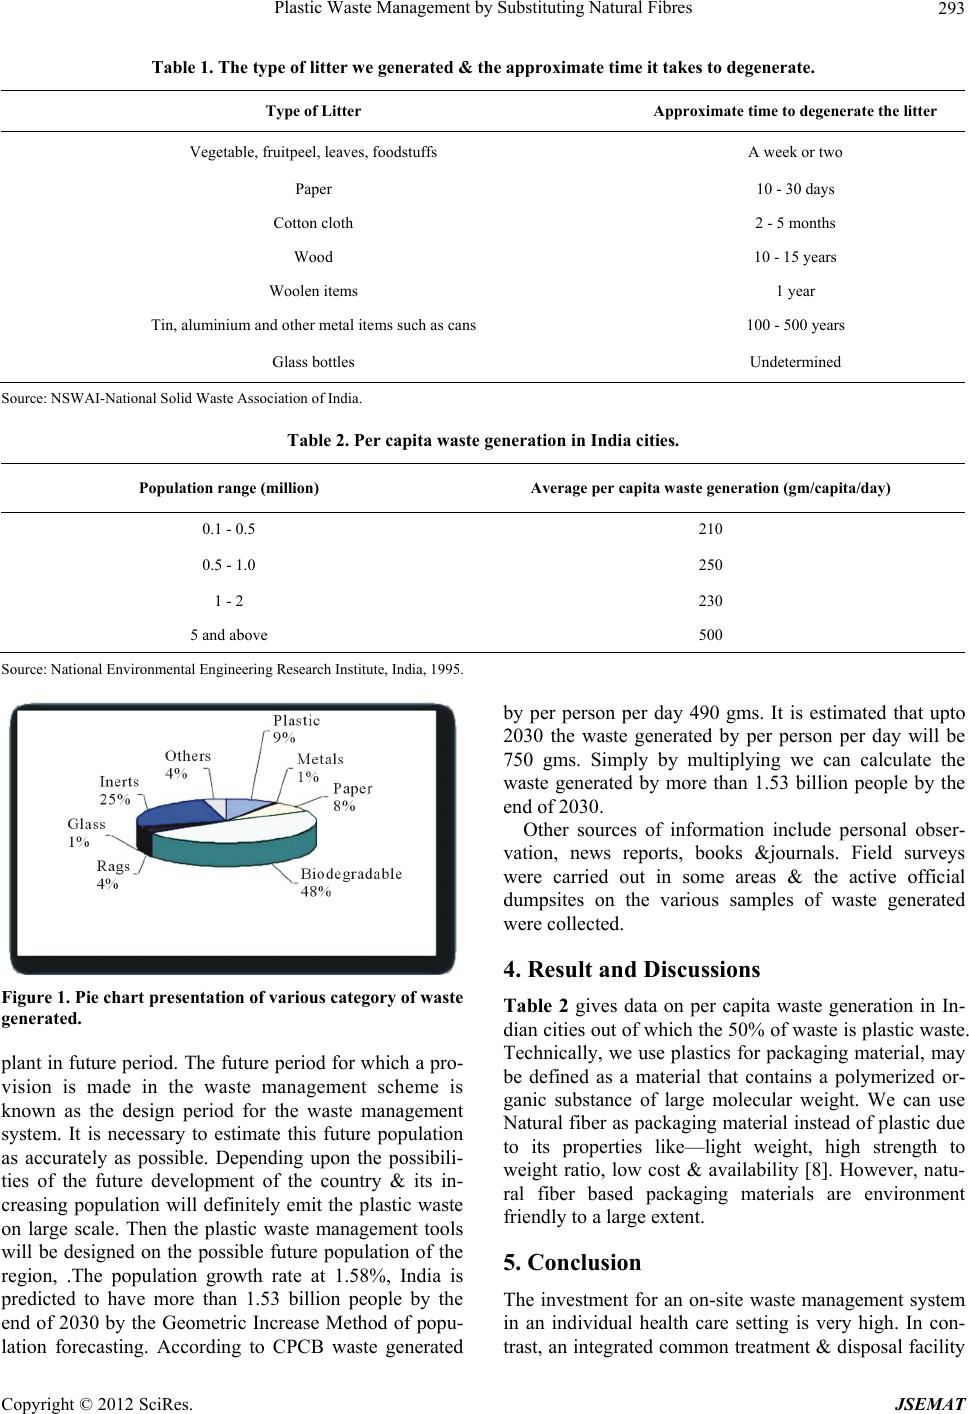
rapidly and its composition changing. Figure 1 repre-
sents Pie chart for the various category of waste gener-
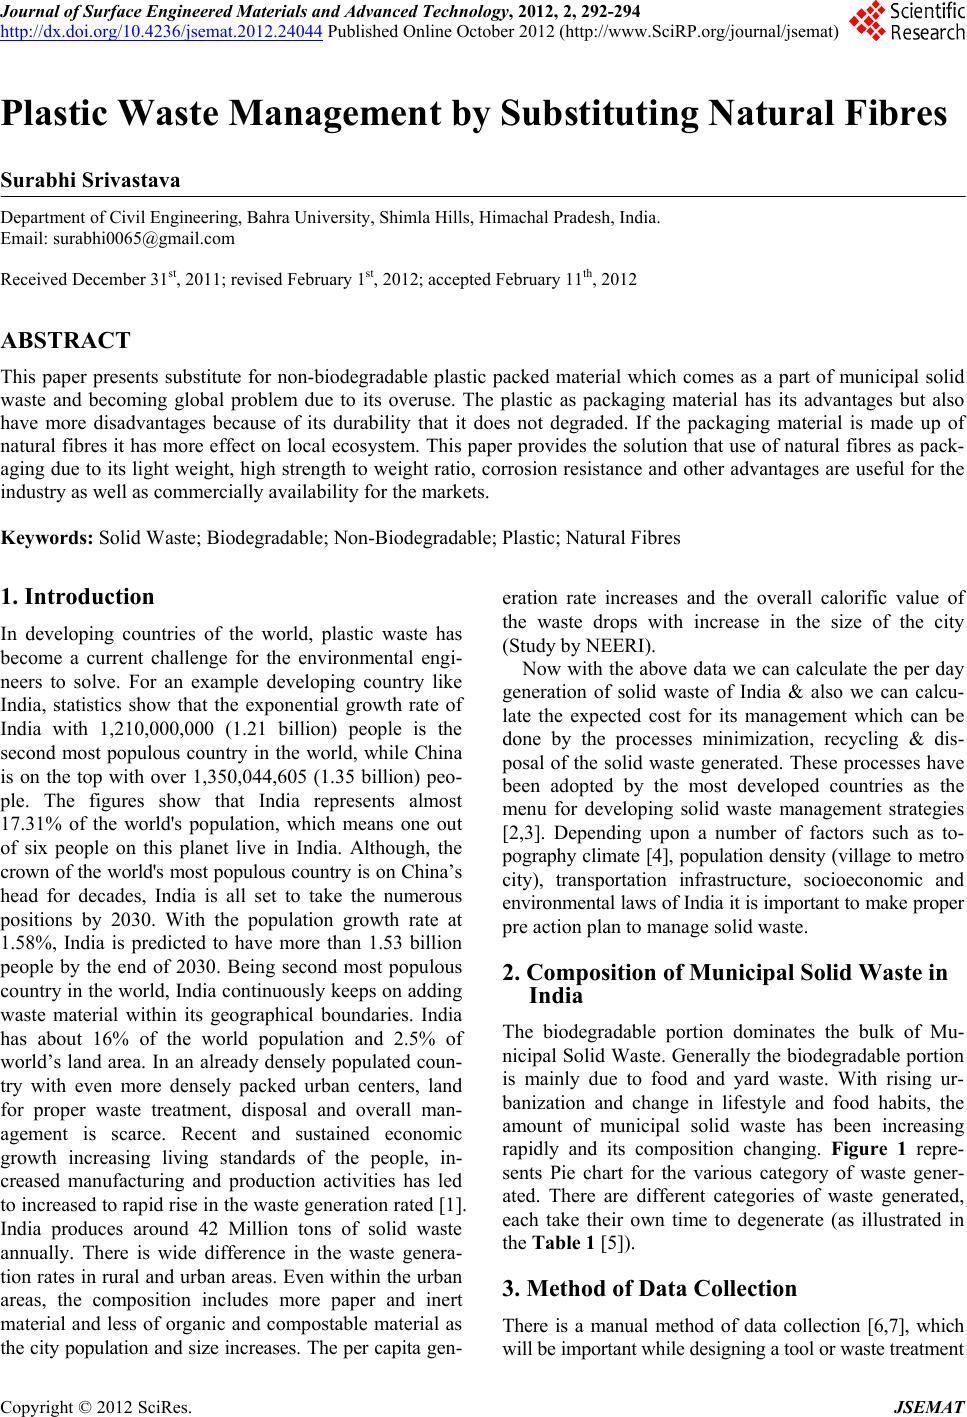
ated. There are different categories of waste generated,
each take their own time to degenerate (as illustrated in
the Table 1 [5]).
3. Method of Data Collection
There is a manual method of data collection [6,7], which
will be important whi le designing a t ool or waste treatment
Copyright © 2012 SciRes. JSEMAT