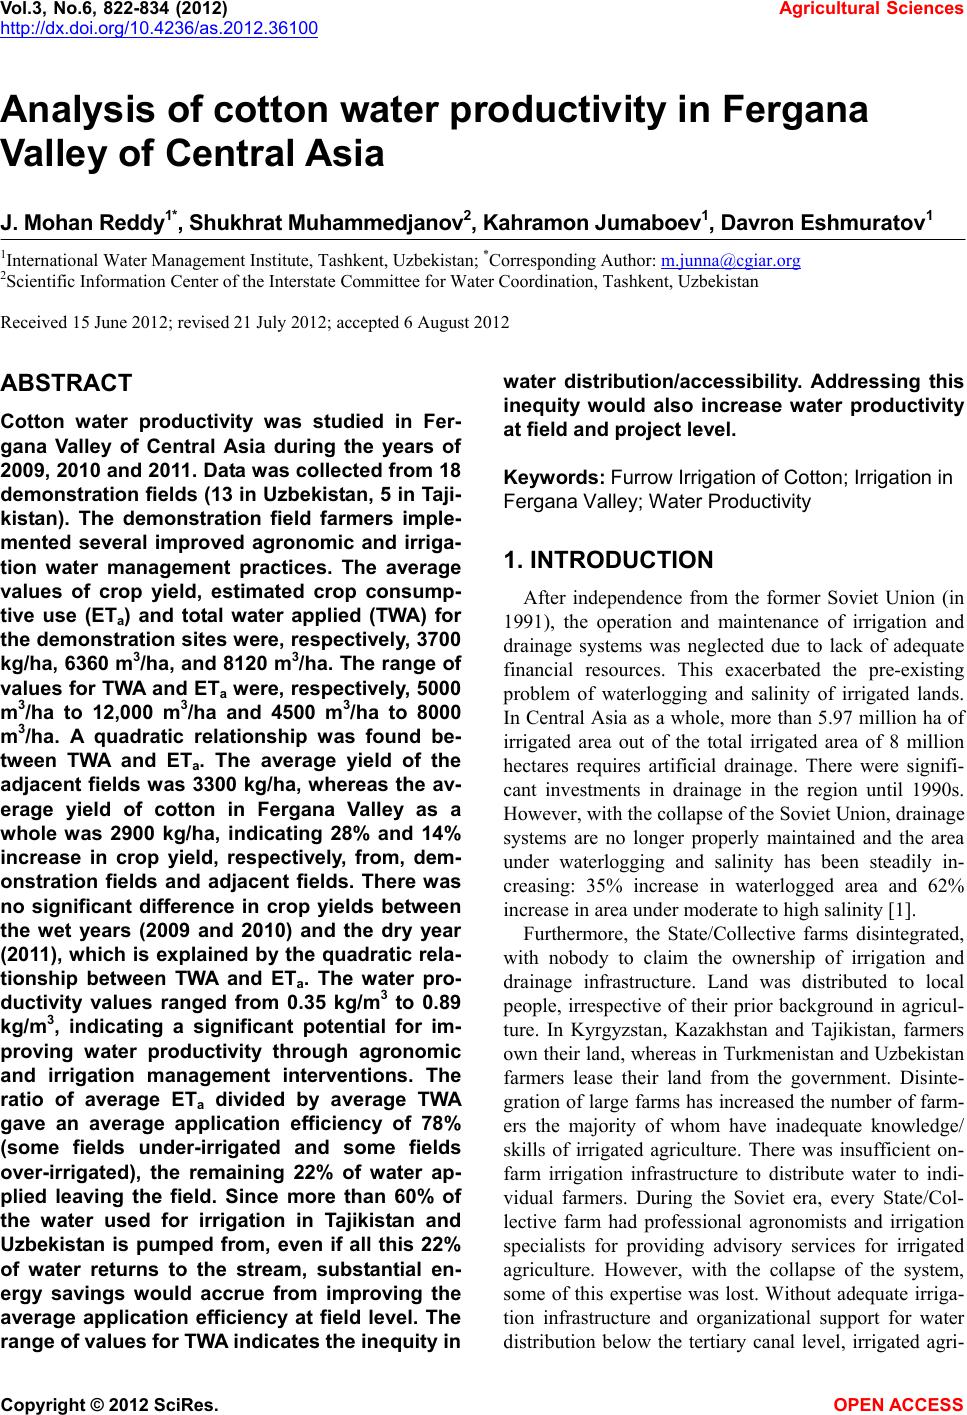
 Vol.3, No.6, 822-834 (2012) Agricultural Sciences http://dx.doi.org/10.4236/as.2012.36100 Analysis of cotton water productivity in Fergana Valley of Central Asia J. Mohan Reddy1*, Shukhrat Muhammed jano v2, Kahram on Juma boev 1, Davron Eshmuratov1 1International Water Management Institute, Tashkent, Uzbekistan; *Corresponding Author: m.junna@cgiar.org 2Scientific Information Center of the Interstate Committee for Water Coordination, Tashkent, Uzbekistan Received 15 June 2012; revised 21 July 2012; accepted 6 August 2012 ABSTRACT Cotton water productivity was studied in Fer- gana Valley of Central Asia during the years of 2009, 2010 and 2011. Data was collected from 18 demonstration fields (13 in Uzbekistan, 5 in Taji- kistan). The demonstration field farmers imple- mented several improved agronomic and irriga- tion water management practices. The average values of crop yield, estimated crop consump- tive use (ETa) and total water applied (TWA) for the demonstration sites were, respectively, 3700 kg/ha, 6360 m3/ha, and 8120 m3/ha. The range of values for TWA and ETa were, respectively, 5000 m3/ha to 12,000 m3/ha and 4500 m3/ha to 8000 m3/ha. A quadratic relationship was found be- tween TWA and ETa. The average yield of the adjacent fields was 3300 kg/ha, whereas the av- erage yield of cotton in Fergana Valley as a whole was 2900 kg/ha, indicating 28% and 14% increase in crop yield, respectively, from, dem- onstration fields and adjacent fields. There was no significant difference in crop yields between the wet years (2009 and 2010) and the dry year (2011), which is explained by the quadratic rela- tionship between TWA and ETa. The water pro- ductivity values ranged from 0.35 kg/m3 to 0.89 kg/m3, indicating a significant potential for im- proving water productivity through agronomic and irrigation management interventions. The ratio of average ETa divided by average TWA gave an average application efficiency of 78% (some fields under-irrigated and some fields over-irrigated), the remaining 22% of water ap- plied leaving the field. Since more than 60% of the water used for irrigation in Tajikistan and Uzbekistan is pumped from, even if all this 22% of water returns to the stream, substantial en- ergy savings would accrue from improving the average application efficiency at field level. The range of values for T WA indicates the inequity in water distribution/accessibility. Addressing this inequity would also increase water productivity at field and project level. Keywords: Furrow Irrigation of Cotton; Irrigation in Fergana Valley; Water Productivity 1. INTRODUCTION After independence from the former Soviet Union (in 1991), the operation and maintenance of irrigation and drainage systems was neglected due to lack of adequate financial resources. This exacerbated the pre-existing problem of waterlogging and salinity of irrigated lands. In Central Asia as a whole, more than 5.97 million ha of irrigated area out of the total irrigated area of 8 million hectares requires artificial drainage. There were signifi- cant investments in drainage in the region until 1990s. However, with the collapse of the Soviet Union, drainage systems are no longer properly maintained and the area under waterlogging and salinity has been steadily in- creasing: 35% increase in waterlogged area and 62% increase in area under moderate to high salinity [1]. Furthermore, the State/Collective farms disintegrated, with nobody to claim the ownership of irrigation and drainage infrastructure. Land was distributed to local people, irrespective of their prior background in agricul- ture. In Kyrgyzstan, Kazakhstan and Tajikistan, farmers own their land, whereas in Turkmenistan and Uzbekistan farmers lease their land from the government. Disinte- gration of large farms has increased the number of farm- ers the majority of whom have inadequate knowledge/ skills of irrigated agriculture. There was insufficient on- farm irrigation infrastructure to distribute water to indi- vidual farmers. During the Soviet era, every State/Col- lective farm had professional agronomists and irrigation specialists for providing advisory services for irrigated agriculture. However, with the collapse of the system, some of this expertise was lost. Without adequate irriga- tion infrastructure and organizational support for water distribution below the tertiary canal level, irrigated agri- Copyright © 2012 SciRes. OPEN ACCES S 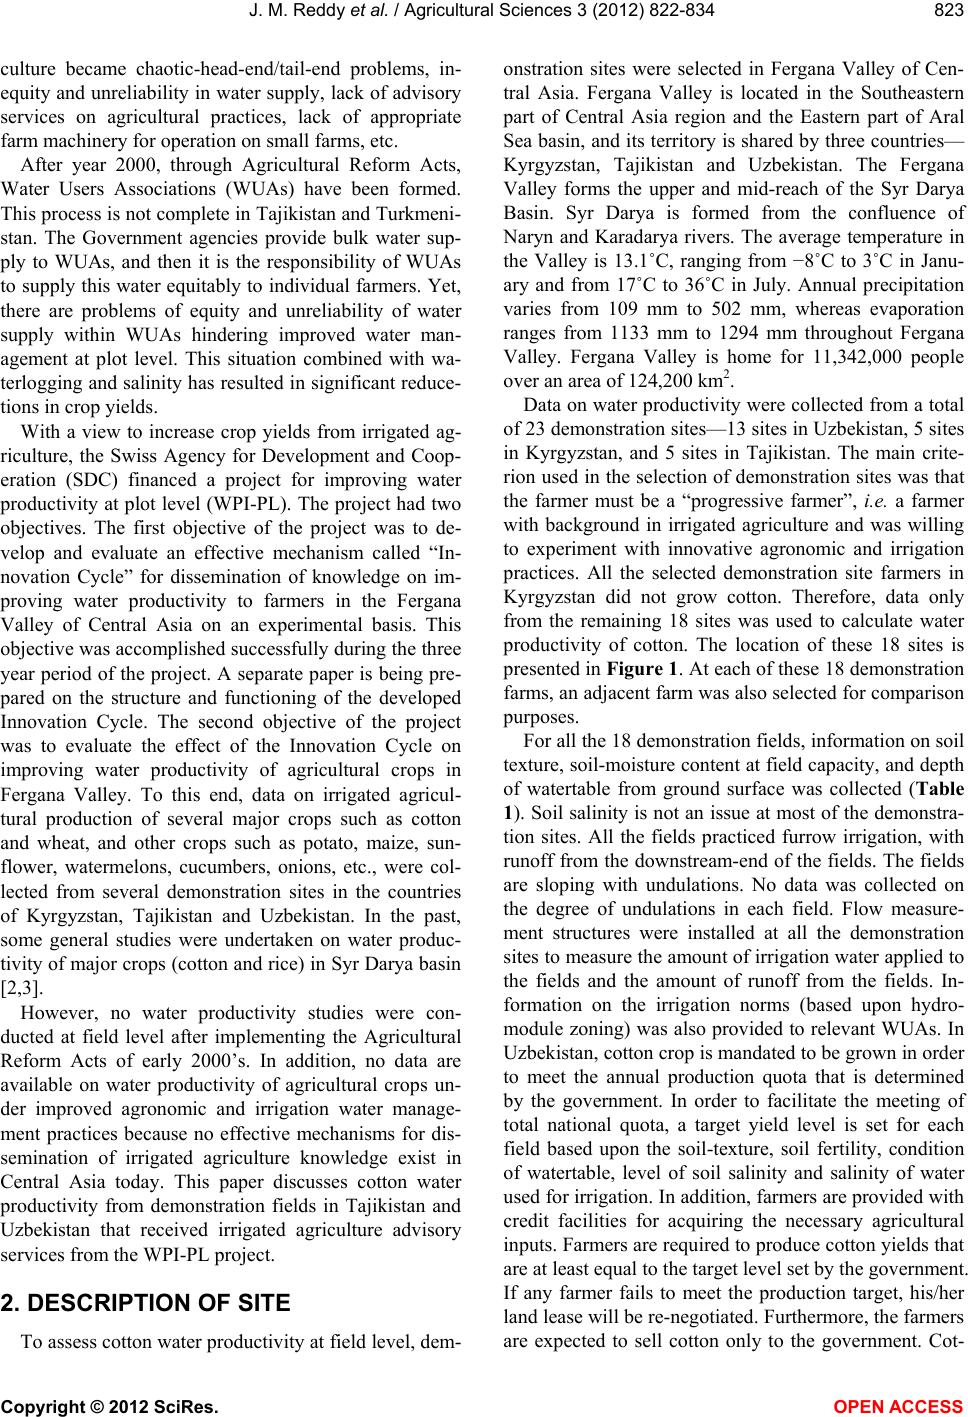 J. M. Reddy et al. / Agricultural Sciences 3 (2012) 822-834 823 culture became chaotic-head-end/tail-end problems, in- equity and unreliability in water supply, lack of advisory services on agricultural practices, lack of appropriate farm machinery for operation on small farms, etc. After year 2000, through Agricultural Reform Acts, Water Users Associations (WUAs) have been formed. This process is not complete in Tajikistan and Turkmeni- stan. The Government agencies provide bulk water sup- ply to WUAs, and then it is the responsibility of WUAs to supply this water equitably to individual farmers. Yet, there are problems of equity and unreliability of water supply within WUAs hindering improved water man- agement at plot level. This situation combined with wa- terlogging and salinity has resulted in significant reduce- tions in crop yields. With a view to increase crop yields from irrigated ag- riculture, the Swiss Agency for Development and Coop- eration (SDC) financed a project for improving water productivity at plot level (WPI-PL). The project had two objectives. The first objective of the project was to de- velop and evaluate an effective mechanism called “In- novation Cycle” for dissemination of knowledge on im- proving water productivity to farmers in the Fergana Valley of Central Asia on an experimental basis. This objective was accomplished successfully during the three year period of the project. A separate paper is being pre- pared on the structure and functioning of the developed Innovation Cycle. The second objective of the project was to evaluate the effect of the Innovation Cycle on improving water productivity of agricultural crops in Fergana Valley. To this end, data on irrigated agricul- tural production of several major crops such as cotton and wheat, and other crops such as potato, maize, sun- flower, watermelons, cucumbers, onions, etc., were col- lected from several demonstration sites in the countries of Kyrgyzstan, Tajikistan and Uzbekistan. In the past, some general studies were undertaken on water produc- tivity of major crops (cotton and rice) in Syr Darya basin [2,3]. However, no water productivity studies were con- ducted at field level after implementing the Agricultural Reform Acts of early 2000’s. In addition, no data are available on water productivity of agricultural crops un- der improved agronomic and irrigation water manage- ment practices because no effective mechanisms for dis- semination of irrigated agriculture knowledge exist in Central Asia today. This paper discusses cotton water productivity from demonstration fields in Tajikistan and Uzbekistan that received irrigated agriculture advisory services from the WPI-PL project. 2. DESCRIPTION OF SITE To assess cotton water productivity at field level, dem- onstration sites were selected in Fergana Valley of Cen- tral Asia. Fergana Valley is located in the Southeastern part of Central Asia region and the Eastern part of Aral Sea basin, and its territory is shared by three countries— Kyrgyzstan, Tajikistan and Uzbekistan. The Fergana Valley forms the upper and mid-reach of the Syr Darya Basin. Syr Darya is formed from the confluence of Naryn and Karadarya rivers. The average temperature in the Valley is 13.1˚C, ranging from −8˚C to 3˚C in Janu- ary and from 17˚C to 36˚C in July. Annual precipitation varies from 109 mm to 502 mm, whereas evaporation ranges from 1133 mm to 1294 mm throughout Fergana Valley. Fergana Valley is home for 11,342,000 people over an area of 124,200 km2. Data on water productivity were collected from a total of 23 demonstration sites—13 sites in Uzbekistan, 5 sites in Kyrgyzstan, and 5 sites in Tajikistan. The main crite- rion used in the selection of demonstration sites was that the farmer must be a “progressive farmer”, i.e. a farmer with background in irrigated agriculture and was willing to experiment with innovative agronomic and irrigation practices. All the selected demonstration site farmers in Kyrgyzstan did not grow cotton. Therefore, data only from the remaining 18 sites was used to calculate water productivity of cotton. The location of these 18 sites is presented in Figure 1. At each of these 18 demonstration farms, an adjacent farm was also selected for comparison purposes. For all the 18 demonstration fields, information on soil texture, soil-moisture content at field capacity, and depth of watertable from ground surface was collected (Table 1). Soil salinity is not an issue at most of the demonstra- tion sites. All the fields practiced furrow irrigation, with runoff from the downstream-end of the fields. The fields are sloping with undulations. No data was collected on the degree of undulations in each field. Flow measure- ment structures were installed at all the demonstration sites to measure the amount of irrigation water applied to the fields and the amount of runoff from the fields. In- formation on the irrigation norms (based upon hydro- module zoning) was also provided to relevant WUAs. In Uzbekistan, cotton crop is mandated to be grown in order to meet the annual production quota that is determined by the government. In order to facilitate the meeting of total national quota, a target yield level is set for each field based upon the soil-texture, soil fertility, condition of watertable, level of soil salinity and salinity of water used for irrigation. In addition, farmers are provided with credit facilities for acquiring the necessary agricultural inputs. Farmers are required to produce cotton yields that are at least equal to the target level set by the government. If any farmer fails to meet the production target, his/her land lease will be re-negotiated. Furthermore, the farmers are expected to sell cotton on the government. Cot- ly to Copyright © 2012 SciRes. OPEN ACCES S 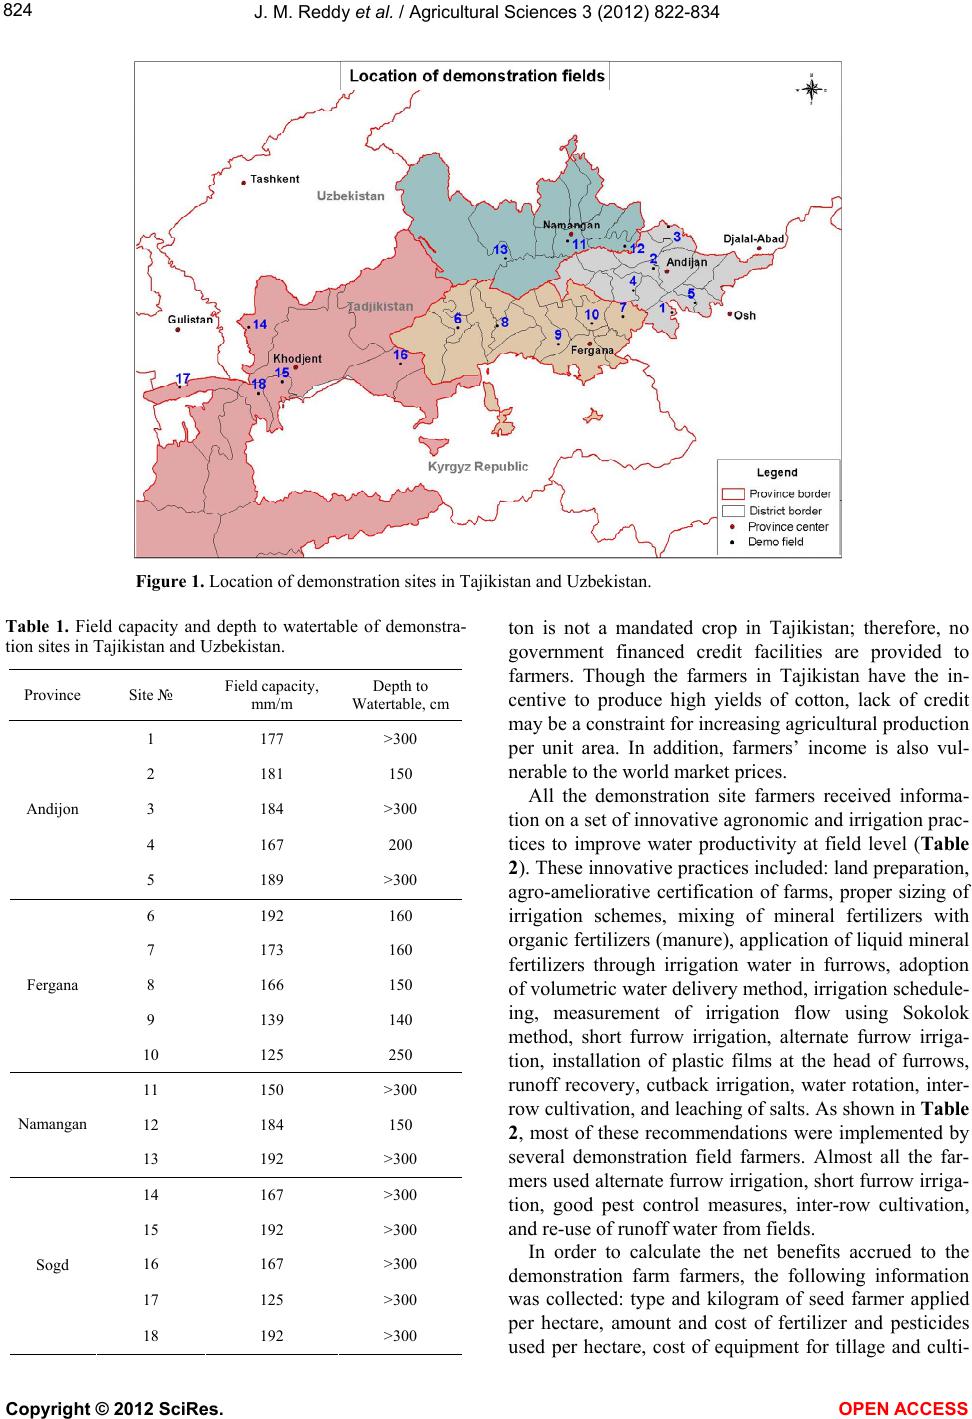 J. M. Reddy et al. / Agricultural Sciences 3 (2012) 822-834 Copyright © 2012 SciRes. 824 Figure 1. Location of demonstration sites in Tajikistan and Uzbekistan. Table 1. Field capacity and depth to watertable of demonstra- tion sites in Tajikistan and Uzbekistan. Province Site № Field capacity, mm/m Depth to Watertable, cm 1 177 >300 2 181 150 3 184 >300 4 167 200 Andijon 5 189 >300 6 192 160 7 173 160 8 166 150 9 139 140 Fergana 10 125 250 11 150 >300 12 184 150 Namangan 13 192 >300 14 167 >300 15 192 >300 16 167 >300 17 125 >300 Sogd 18 192 >300 ton is not a mandated crop in Tajikistan; therefore, no government financed credit facilities are provided to farmers. Though the farmers in Tajikistan have the in- centive to produce high yields of cotton, lack of credit may be a constraint for increasing agricultural production per unit area. In addition, farmers’ income is also vul- nerable to the world market prices. All the demonstration site farmers received informa- tion on a set of innovative agronomic and irrigation prac- tices to improve water productivity at field level (Table 2). These innovative practices included: land preparation, agro-ameliorative certification of farms, proper sizing of irrigation schemes, mixing of mineral fertilizers with organic fertilizers (manure), application of liquid mineral fertilizers through irrigation water in furrows, adoption of volumetric water delivery method, irrigation schedule- ing, measurement of irrigation flow using Sokolok method, short furrow irrigation, alternate furrow irriga- tion, installation of plastic films at the head of furrows, runoff recovery, cutback irrigation, water rotation, inter- row cultivation, and leaching of salts. As shown in Table 2, most of these recommendations were implemented by several demonstration field farmers. Almost all the far- mers used alternate furrow irrigation, short furrow irriga- tion, good pest control measures, inter-row cultivation, and re-use of runoff water from fields. In order to calculate the net benefits accrued to the demonstration farm farmers, the following information was collected: type and kilogram of seed farmer applied per hectare, amount and cost of fertilizer and pesticides used per hectare, cost of equipment for tillage and culti- OPEN A CCESS  J. M. Reddy et al. / Agricultural Sciences 3 (2012) 822-834 825 Table 2. Technologies used at demonstration sites. Site № Agro technical activities and land preparation for irrigation season Leveling of irrigated land Agro-ameliorative certification of farms Selecting technological irrigation scheme Application of mineral fertilizers (soil fertility improvement) for cotton and other crops in conditions of Fergana Valley (to irrigate through pits filled with organic fertilizers) Fertilizer irrigation through application of liquid mineral fertilizers with irrigation water (fertigation) Crop pest control Water accounting (construction of water measuring devices, implementation of water accounting) is organized on inlets and outlets Adoption of volumetric water delivery method (payment per m3 of water received). Preparation of necessary documents (contract between WUA and farmer, water accounting log, act, etc) Implementation of crop irrigation regime Irrigation considering soil moisture Mechanism of efficient irrigation water use in small farms (Sokolok) Defining needs and problems of farmers hindering land and water productivity improvement Short furrows Every second furrow irrigation Variable jet furrow irrigation Night irrigation Installation of plastic films in the furrow heads Use of plastic bottle heads and siphons Decrease of technological discharges from the fields (use of drainage water or secondary use of water on downstream fields) Water rotation Inter-row cultivation Leaching of saline soils with different types of salinity 2009 1 1 1 1 1 1 1 11 1 111 1 1 11 2 1 1 1 1 1 1 1 1 11 1 11 3 1 1 1 1 1 1 1 111 1 1 11 4 1 1 1 1 1 1 1 1 11 1 11 5 1 1 1 1 1 1 1 1 111 1 6 1 1 1 1 1 1 1 111 1 1 1 7 1 1 1 1 1 1 1 1 1 111 1 1 11 8 1 1 1 1 1 1 1 1 1 9 1 1 1 1 1 1 1 11 1 111 1 1 11 10 1 1 1 1 1 1 11 1 111 1 1 1 11 1 1 1 1 1 111 1 1 11 12 1 1 1 1 1 111 1 1 1 13 1 1 1 1 1 1 111 1 1 14 1 1 1 1 1 1 1 1 1 111 1 1 11 15 1 1 1 1 1 1 1 1 1 111 1 1 11 16 1 1 1 1 1 1 1 1 1 111 1 1 11 17 1 1 1 1 1 1 1 1 1 111 1 1 11 18 1 1 1 1 1 1 1 1 1 111 1 1 11 2010 1 1 1 1 1 1 1 11 1 111 1 1 11 2 1 1 1 1 1 1 1 1 111 1 1 3 1 1 1 1 1 1 11 1 111 1 1 1 11 4 1 1 1 1 1 1 1 1 11 1 11 5 1 1 1 1 1 1 11 1 111 1 1 6 1 1 1 1 1 1 1 111 1 1 1 7 1 1 1 1 1 1 1 1 1 1111 1 1 11 Copyright © 2012 SciRes. OPEN ACCES S  J. M. Reddy et al. / Agricultural Sciences 3 (2012) 822-834 826 Continued 8 1 1 1 1 1 1 1 1 1 11 1 1 1 9 1 1 1 1 1 1 1 11 1 111 1 1 11 10 1 1 1 1 1 1 11 1 111 1 1 1 11 1 1 1 1 1 1 1 11 1 1 1 12 1 1 1 1 1 1 1 1 111 1 1 14 1 1 1 1 1 1 1 1 1 111 1 1 11 15 1 1 1 1 1 1 1 11 1 1111 1 1 11 16 1 1 1 1 1 1 1 11 1 1111 1 1 11 17 1 1 1 1 1 1 1 11 1 1111 1 1 11 18 1 1 1 1 1 1 1 11 1 1111 1 1 11 2011 1 1 1 1 1 1 1 11 1 111 1 1 11 2 1 1 1 1 1 1 11 1 111 1 1 3 1 1 1 1 1 1 11 1 111 1 1 1 11 5 1 1 1 1 1 1 11 1 111 1 1 11 7 1 1 1 1 1 1 1 1 1 1111 1 1 11 8 1 1 1 1 1 1 1 1 1 11 1 1 1 9 1 1 1 1 1 1 1 11 1 111 1 1 1 10 1 1 1 1 1 1 11 1 111 1 1 1 11 1 1 1 1 1 1 1 1 11 1 1 1 14 1 1 1 1 1 1 1 111 1 1111 1 1 11 15 1 1 1 1 1 1 1 111 1 1111 1 1 11 17 1 1 1 1 1 1 1 111 1 1111 1 1 11 18 1 1 1 1 1 1 1 11 1 1111 1 1 11 vation, cost of labor, amount of irrigation water applied per hectare, cost of transportation, fixed costs for agri- cultural production, and finally yield of major crops. In addition, climatic data from the nearest weather station for each of the 18 sites was gathered for calculating ref- erence evapotranspiration of cotton crop at the given locations. 3. METHODOLOGY TO CALCULATE WATER PRODUCTIVITY There are several definitions of water productivity (WP). The most commonly used definition [4] is given as the ratio of the crop yield, Ycrop (kg/ha), divided by the consumptive use of water by the crop, ETa (m3/ha), i.e. crop a WP YET (1) in which Ycrop = measured crop yield under natural and irrigated conditions, kg/ha; and ETa = estimated/meas- ured seasonal evapotranspiration or crop water use, m3/ha. The above definition is independent of the source of water made available for ETa, and assumes that any water losses that occur at field level, in the form of run- off and deep percolation, are recaptured and re-used somewhere else in the basin, ignoring or discounting some “co-benefits” such as improved water quality (par- ticularly under Central Asian conditions where salinity is a major issue), increased crop production, increased re- liability in water supply, decreased energy demands and carbon emissions, and reduced or delayed infrastructure investments [5] that accrue from improved application efficiency at field level. The source of water for ETa may be a combination of one or more of the following: rain- fall, groundwater, residual soil-moisture from previous season or irrigation water. Sometimes, we are interested in the incremental change Copyright © 2012 SciRes. OPEN ACCES S 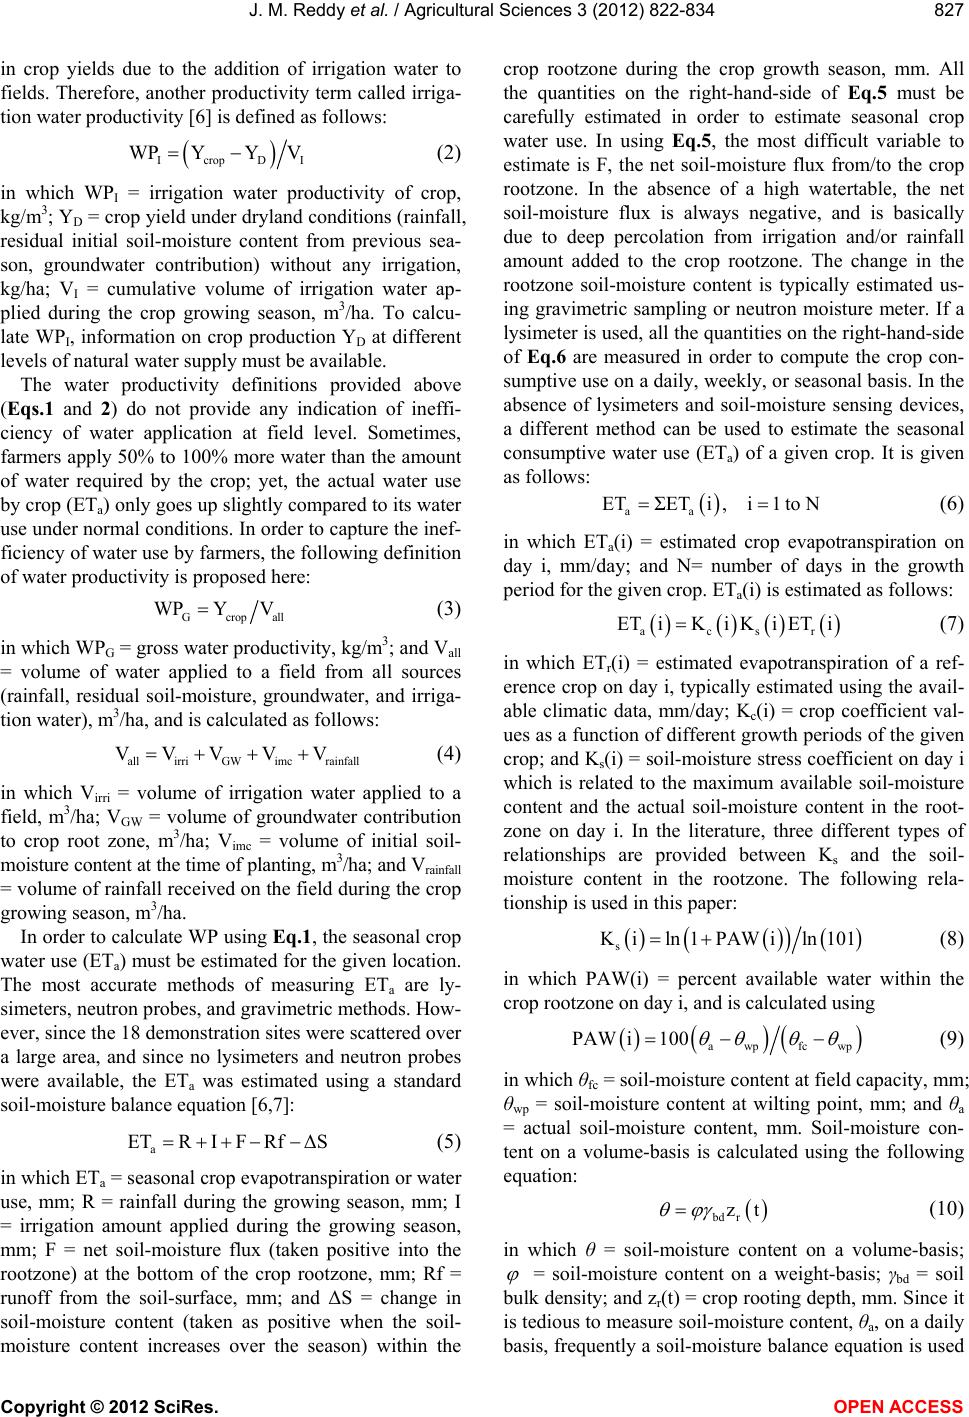 J. M. Reddy et al. / Agricultural Sciences 3 (2012) 822-834 827 in crop yields due to the addition of irrigation water to fields. Therefore, another productivity term called irriga- tion water productivity [6] is defined as follows: IcropD WPYY V I (2) in which WPI = irrigation water productivity of crop, kg/m3; YD = crop yield under dryland conditions (rainfall, residual initial soil-moisture content from previous sea- son, groundwater contribution) without any irrigation, kg/ha; VI = cumulative volume of irrigation water ap- plied during the crop growing season, m3/ha. To calcu- late WPI, information on crop production YD at different levels of natural water supply must be available. The water productivity definitions provided above (Eqs.1 and 2) do not provide any indication of ineffi- ciency of water application at field level. Sometimes, farmers apply 50% to 100% more water than the amount of water required by the crop; yet, the actual water use by crop (ETa) only goes up slightly compared to its water use under normal conditions. In order to capture the inef- ficiency of water use by farmers, the following definition of water productivity is proposed here: Gcropa WP YVll (3) in which WPG = gross water productivity, kg/m3; and Vall = volume of water applied to a field from all sources (rainfall, residual soil-moisture, groundwater, and irriga- tion water), m3/ha, and is calculated as follows: allirri GW imc rainfall VVVV V (4) in which Virri = volume of irrigation water applied to a field, m3/ha; VGW = volume of groundwater contribution to crop root zone, m3/ha; Vimc = volume of initial soil- moisture content at the time of planting, m3/ha; and Vrainfall = volume of rainfall received on the field during the crop growing season, m3/ha. In order to calculate WP using Eq.1, the seasonal crop water use (ETa) must be estimated for the given location. The most accurate methods of measuring ETa are ly- simeters, neutron probes, and gravimetric methods. How- ever, since the 18 demonstration sites were scattered over a large area, and since no lysimeters and neutron probes were available, the ETa was estimated using a standard soil-moisture balance equation [6,7]: a ETRIF RfΔS (5) in which ETa = seasonal crop evapotranspiration or water use, mm; R = rainfall during the growing season, mm; I = irrigation amount applied during the growing season, mm; F = net soil-moisture flux (taken positive into the rootzone) at the bottom of the crop rootzone, mm; Rf = runoff from the soil-surface, mm; and ΔS = change in soil-moisture content (taken as positive when the soil- moisture content increases over the season) within the crop rootzone during the crop growth season, mm. All the quantities on the right-hand-side of Eq.5 must be carefully estimated in order to estimate seasonal crop water use. In using Eq.5, the most difficult variable to estimate is F, the net soil-moisture flux from/to the crop rootzone. In the absence of a high watertable, the net soil-moisture flux is always negative, and is basically due to deep percolation from irrigation and/or rainfall amount added to the crop rootzone. The change in the rootzone soil-moisture content is typically estimated us- ing gravimetric sampling or neutron moisture meter. If a lysimeter is used, all the quantities on the right-hand-side of Eq.6 are measured in order to compute the crop con- sumptive use on a daily, weekly, or seasonal basis. In the absence of lysimeters and soil-moisture sensing devices, a different method can be used to estimate the seasonal consumptive water use (ETa) of a given crop. It is given as follows: aa ET ΣETi, i1to N (6) in which ETa(i) = estimated crop evapotranspiration on day i, mm/day; and N= number of days in the growth period for the given crop. ETa(i) is estimated as follows: acsr ETiKi KiETi (7) in which ETr(i) = estimated evapotranspiration of a ref- erence crop on day i, typically estimated using the avail- able climatic data, mm/day; Kc(i) = crop coefficient val- ues as a function of different growth periods of the given crop; and Ks(i) = soil-moisture stress coefficient on day i which is related to the maximum available soil-moisture content and the actual soil-moisture content in the root- zone on day i. In the literature, three different types of relationships are provided between Ks and the soil- moisture content in the rootzone. The following rela- tionship is used in this paper: s Kiln 1PAWiln 101 (8) in which PAW(i) = percent available water within the crop rootzone on day i, and is calculated using awpfcwp PAW i100 (9) in which θfc = soil-moisture content at field capacity, mm; θwp = soil-moisture content at wilting point, mm; and θa = actual soil-moisture content, mm. Soil-moisture con- tent on a volume-basis is calculated using the following equation: bd r zt (10) in which θ = soil-moisture content on a volume-basis; = soil-moisture content on a weight-basis; γbd = soil bulk density; and zr(t) = crop rooting depth, mm. Since it is tedious to measure soil-moisture content, θa, on a daily basis, frequently a soil-moisture balance equation is used Copyright © 2012 SciRes. OPEN ACCES S 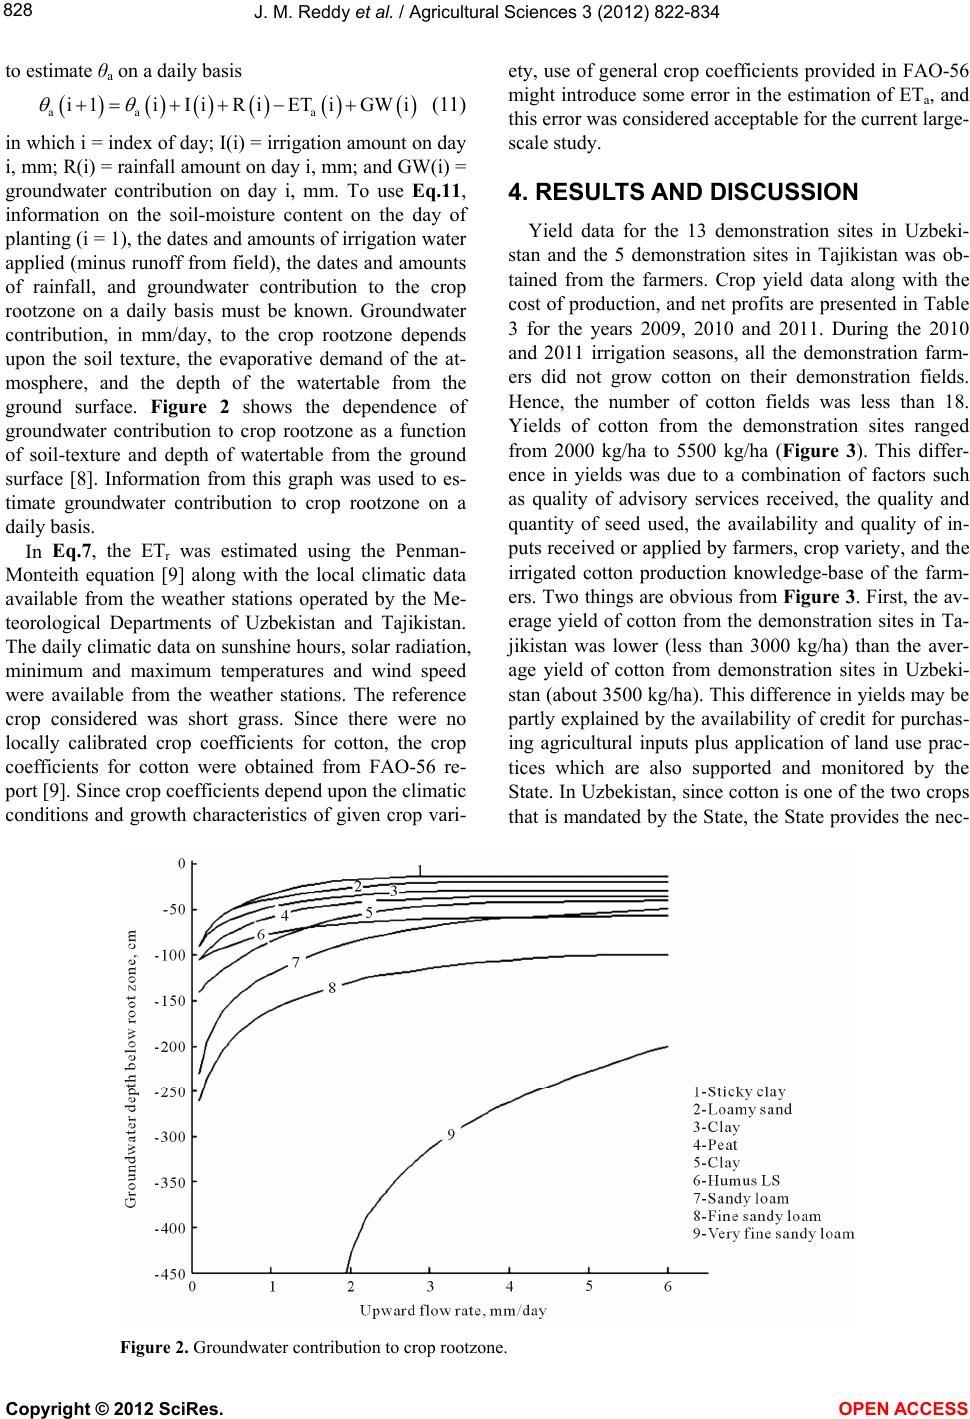 J. M. Reddy et al. / Agricultural Sciences 3 (2012) 822-834 Copyright © 2012 SciRes. 828 to estimate θa on a daily basis ety, use of general crop coefficients provided in FAO-56 might introduce some error in the estimation of ETa, and this error was considered acceptable for the current large- scale study. aa a i1 iIiRiETiGWi (11) in which i = index of day; I(i) = irrigation amount on day i, mm; R(i) = rainfall amount on day i, mm; and GW(i) = groundwater contribution on day i, mm. To use Eq.11 , information on the soil-moisture content on the day of planting (i = 1), the dates and amounts of irrigation water applied (minus runoff from field), the dates and amounts of rainfall, and groundwater contribution to the crop rootzone on a daily basis must be known. Groundwater contribution, in mm/day, to the crop rootzone depends upon the soil texture, the evaporative demand of the at- mosphere, and the depth of the watertable from the ground surface. Figure 2 shows the dependence of groundwater contribution to crop rootzone as a function of soil-texture and depth of watertable from the ground surface [8]. Information from this graph was used to es- timate groundwater contribution to crop rootzone on a daily basis. 4. RESULTS AND DISCUSSION Yield data for the 13 demonstration sites in Uzbeki- stan and the 5 demonstration sites in Tajikistan was ob- tained from the farmers. Crop yield data along with the cost of production, and net profits are presented in Table 3 for the years 2009, 2010 and 2011. During the 2010 and 2011 irrigation seasons, all the demonstration farm- ers did not grow cotton on their demonstration fields. Hence, the number of cotton fields was less than 18. Yields of cotton from the demonstration sites ranged from 2000 kg/ha to 5500 kg/ha (Figure 3). This differ- ence in yields was due to a combination of factors such as quality of advisory services received, the quality and quantity of seed used, the availability and quality of in- puts received or applied by farmers, crop variety, and the irrigated cotton production knowledge-base of the farm- ers. Two things are obvious from Figure 3. First, the av- erage yield of cotton from the demonstration sites in Ta- jikistan was lower (less than 3000 kg/ha) than the aver- age yield of cotton from demonstration sites in Uzbeki- stan (about 3500 kg/ha). This difference in yields may be partly explained by the availability of credit for purchas- ing agricultural inputs plus application of land use prac- tices which are also supported and monitored by the State. In Uzbekistan, since cotton is one of the two crops that is mandated by the State, the State provides the nec- In Eq.7, the ETr was estimated using the Penman- Monteith equation [9] along with the local climatic data available from the weather stations operated by the Me- teorological Departments of Uzbekistan and Tajikistan. The daily climatic data on sunshine hours, solar radiation, minimum and maximum temperatures and wind speed were available from the weather stations. The reference crop considered was short grass. Since there were no locally calibrated crop coefficients for cotton, the crop coefficients for cotton were obtained from FAO-56 re- port [9]. Since crop coefficients depend upon the climatic conditions and growth characteristics of given crop vari- Figure 2. Groundwater contribution to crop rootzone. OPEN A CCESS  J. M. Reddy et al. / Agricultural Sciences 3 (2012) 822-834 829 Figure 3. Cotton yields for the demonstration sites and the adjacent fields. essary credit to farmers for purchasing all the necessary inputs to grow cotton, and the district-level government officials prod the farmers to apply irrigation water on- time according to the irrigation norms (though outdated), and to apply appropriate plant protection measures. Though data on the type and quantity of each input was collected, no information was collected on the quality and the timing of the inputs. In the case of Tajikistan, no such credit is available to farmers, and hence no such monitoring of inputs including water is done by the State. Secondly, as mentioned elsewhere, 2009 and 2010 (more rainfall and more water was available for irrigation dur- ing the vegetation period) were considered as wet years whereas 2011 was a dry year (less rainfall and less amount of irrigation water was available during the vegetation period). Yet, on the average, there was no significant difference in the yield of cotton between the wet and dry years. The farmers used irrigation water ef- ficiently by under-irrigating the crop during the dry year. Under-irrigation was practiced not by choice, but by de- fault! Cotton yields from the adjacent fields are also shown in Figure 3. No data was available from the adjacent fields in Tajikistan. As expected, the average yields from the adjacent fields were lower (around 3300 kg/ha) than the average yields (3700 kg/ha) obtained from the dem- onstration sites in Uzbekistan. The demonstration field farmers implemented a variety of “innovations” or im- proved agronomic and irrigation practices, as shown in Table 2, whereas the adjacent farmers were using one or more of the innovative practices implemented by the demonstration farmers. The average cotton yields in Fergana Valley were about 2900 kg/ha, indicating that the average crop yields from the demonstration fields were 28% higher than the average crop yields in the area. From the above it is evident that there is a substantial opportunity to increase crop yields, and thus water pro- ductivity, in Fergana Valley through a combination of agronomic and irrigation water management intervene- tions (Table 2). Since there was so much variability in the quality of inputs used at various demonstration sites (including crop varieties), it was not possible to identify the most important factors for increase in crop yields. Also, the yields of adjacent fields increased by 14% (above the average for Fergana Valley) suggesting that, with time, more farmers would adapt these interventions to raise the average yield of cotton in Fergana Valley. Some of the demonstration field farmers were using some additional innovative agronomic practices such as irradiation of seed, plastic mulching, and passing irriga- tion water through a magnetic field. All of these prac- tices contributed to decent increases in crop yields. However, detailed field investigations are still underway to confirm and document the benefits of using these technologies so that they can be disseminated through the Innovation Cycle. To estimate water productivity of cotton, the con- sumptive use of cotton crop was estimated using a simu- lation model (using Eqs.7-11 in an Excel Spreadsheet) on all the 18 sites. The total amount of water supplied from all the sources-initial soil-moisture content, ground- water contribution, irrigation, and rainfall was also cal- culated for all the 18 demonstration sites. Information on daily rainfall amounts (in millimeters) and daily weather Copyright © 2012 SciRes. OPEN ACCES S 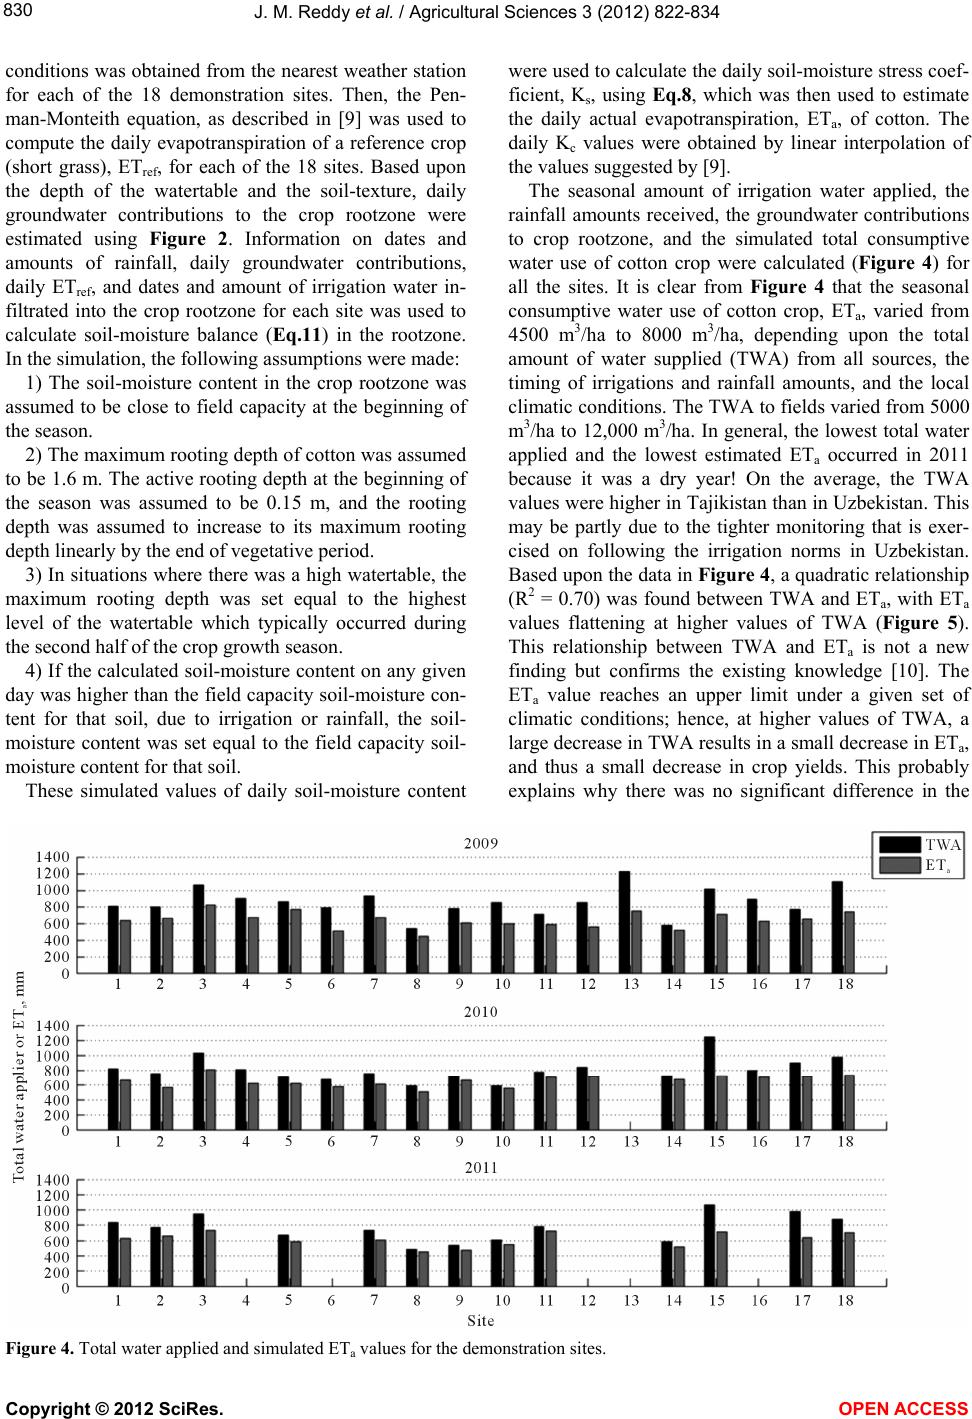 J. M. Reddy et al. / Agricultural Sciences 3 (2012) 822-834 830 conditions was obtained from the nearest weather station for each of the 18 demonstration sites. Then, the Pen- man-Monteith equation, as described in [9] was used to compute the daily evapotranspiration of a reference crop (short grass), ETref, for each of the 18 sites. Based upon the depth of the watertable and the soil-texture, daily groundwater contributions to the crop rootzone were estimated using Figure 2. Information on dates and amounts of rainfall, daily groundwater contributions, daily ETref, and dates and amount of irrigation water in- filtrated into the crop rootzone for each site was used to calculate soil-moisture balance (Eq.11) in the rootzone. In the simulation, the following assumptions were made: 1) The soil-moisture content in the crop rootzone was assumed to be close to field capacity at the beginning of the season. 2) The maximum rooting depth of cotton was assumed to be 1.6 m. The active rooting depth at the beginning of the season was assumed to be 0.15 m, and the rooting depth was assumed to increase to its maximum rooting depth linearly by the end of vegetative period. 3) In situations where there was a high watertable, the maximum rooting depth was set equal to the highest level of the watertable which typically occurred during the second half of the crop growth season. 4) If the calculated soil-moisture content on any given day was higher than the field capacity soil-moisture con- tent for that soil, due to irrigation or rainfall, the soil- moisture content was set equal to the field capacity soil- moisture content for that soil. These simulated values of daily soil-moisture content were used to calculate the daily soil-moisture stress coef- ficient, Ks, using Eq.8, which was then used to estimate the daily actual evapotranspiration, ETa, of cotton. The daily Kc values were obtained by linear interpolation of the values suggested by [9]. The seasonal amount of irrigation water applied, the rainfall amounts received, the groundwater contributions to crop rootzone, and the simulated total consumptive water use of cotton crop were calculated (Figure 4) for all the sites. It is clear from Figure 4 that the seasonal consumptive water use of cotton crop, ETa, varied from 4500 m3/ha to 8000 m3/ha, depending upon the total amount of water supplied (TWA) from all sources, the timing of irrigations and rainfall amounts, and the local climatic conditions. The TWA to fields varied from 5000 m3/ha to 12,000 m3/ha. In general, the lowest total water applied and the lowest estimated ETa occurred in 2011 because it was a dry year! On the average, the TWA values were higher in Tajikistan than in Uzbekistan. This may be partly due to the tighter monitoring that is exer- cised on following the irrigation norms in Uzbekistan. Based upon the data in Figure 4, a quadratic relationship (R2 = 0.70) was found between TWA and ETa, with ETa values flattening at higher values of TWA (Figure 5). This relationship between TWA and ETa is not a new finding but confirms the existing knowledge [10]. The ETa value reaches an upper limit under a given set of climatic conditions; hence, at higher values of TWA, a large decrease in TWA results in a small decrease in ETa, and thus a small decrease in crop yields. This probably explains why there was no significant difference in the Figure 4. Total water applied and simulated ETa values for the demonstration sites. Copyright © 2012 SciRes. OPEN ACCES S 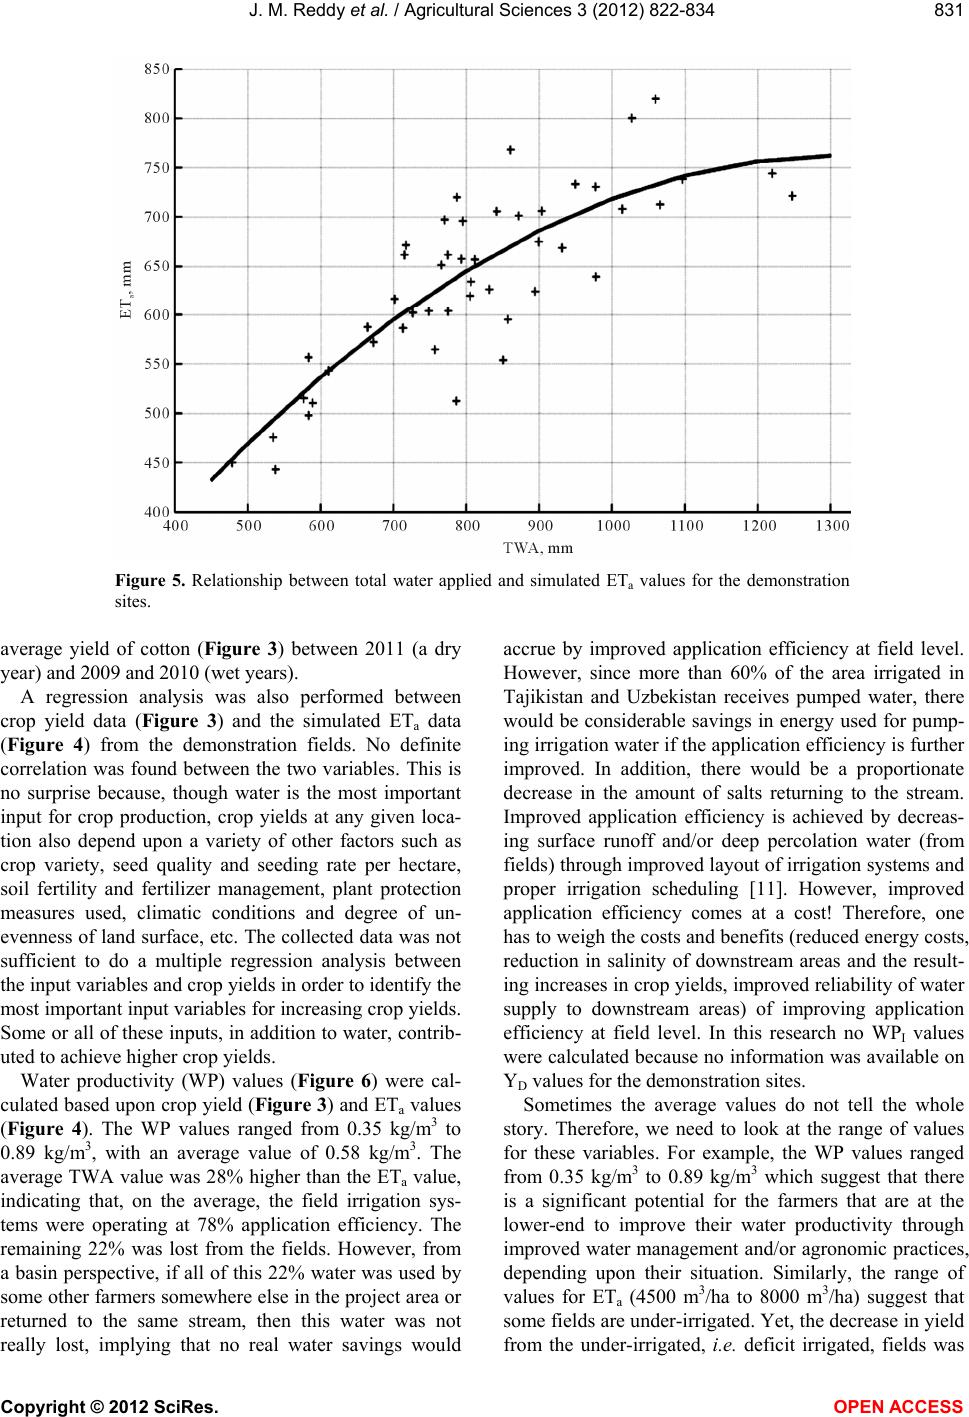 J. M. Reddy et al. / Agricultural Sciences 3 (2012) 822-834 831 Figure 5. Relationship between total water applied and simulated ETa values for the demonstration sites. average yield of cotton (Figure 3) between 2011 (a dry year) and 2009 and 2010 (wet years). A regression analysis was also performed between crop yield data (Figure 3) and the simulated ETa data (Figure 4) from the demonstration fields. No definite correlation was found between the two variables. This is no surprise because, though water is the most important input for crop production, crop yields at any given loca- tion also depend upon a variety of other factors such as crop variety, seed quality and seeding rate per hectare, soil fertility and fertilizer management, plant protection measures used, climatic conditions and degree of un- evenness of land surface, etc. The collected data was not sufficient to do a multiple regression analysis between the input variables and crop yields in order to identify the most important input variables for increasing crop yields. Some or all of these inputs, in addition to water, contrib- uted to achieve higher crop yields. Water productivity (WP) values (Figure 6) were cal- culated based upon crop yield (Figure 3) and ETa values (Figure 4). The WP values ranged from 0.35 kg/m3 to 0.89 kg/m3, with an average value of 0.58 kg/m3. The average TWA value was 28% higher than the ETa value, indicating that, on the average, the field irrigation sys- tems were operating at 78% application efficiency. The remaining 22% was lost from the fields. However, from a basin perspective, if all of this 22% water was used by some other farmers somewhere else in the project area or returned to the same stream, then this water was not really lost, implying that no real water savings would accrue by improved application efficiency at field level. However, since more than 60% of the area irrigated in Tajikistan and Uzbekistan receives pumped water, there would be considerable savings in energy used for pump- ing irrigation water if the application efficiency is further improved. In addition, there would be a proportionate decrease in the amount of salts returning to the stream. Improved application efficiency is achieved by decreas- ing surface runoff and/or deep percolation water (from fields) through improved layout of irrigation systems and proper irrigation scheduling [11]. However, improved application efficiency comes at a cost! Therefore, one has to weigh the costs and benefits (reduced energy costs, reduction in salinity of downstream areas and the result- ing increases in crop yields, improved reliability of water supply to downstream areas) of improving application efficiency at field level. In this research no WPI values were calculated because no information was available on YD values for the demonstration sites. Sometimes the average values do not tell the whole story. Therefore, we need to look at the range of values for these variables. For example, the WP values ranged from 0.35 kg/m3 to 0.89 kg/m3 which suggest that there is a significant potential for the farmers that are at the lower-end to improve their water productivity through improved water management and/or agronomic practices, depending upon their situation. Similarly, the range of values for ETa (4500 m3/ha to 8000 m3/ha) suggest that some fields are under-irrigated. Yet, the decrease in yield from the under-irrigated, i.e. eficit irrigated, fields was d Copyright © 2012 SciRes. OPEN ACCES S 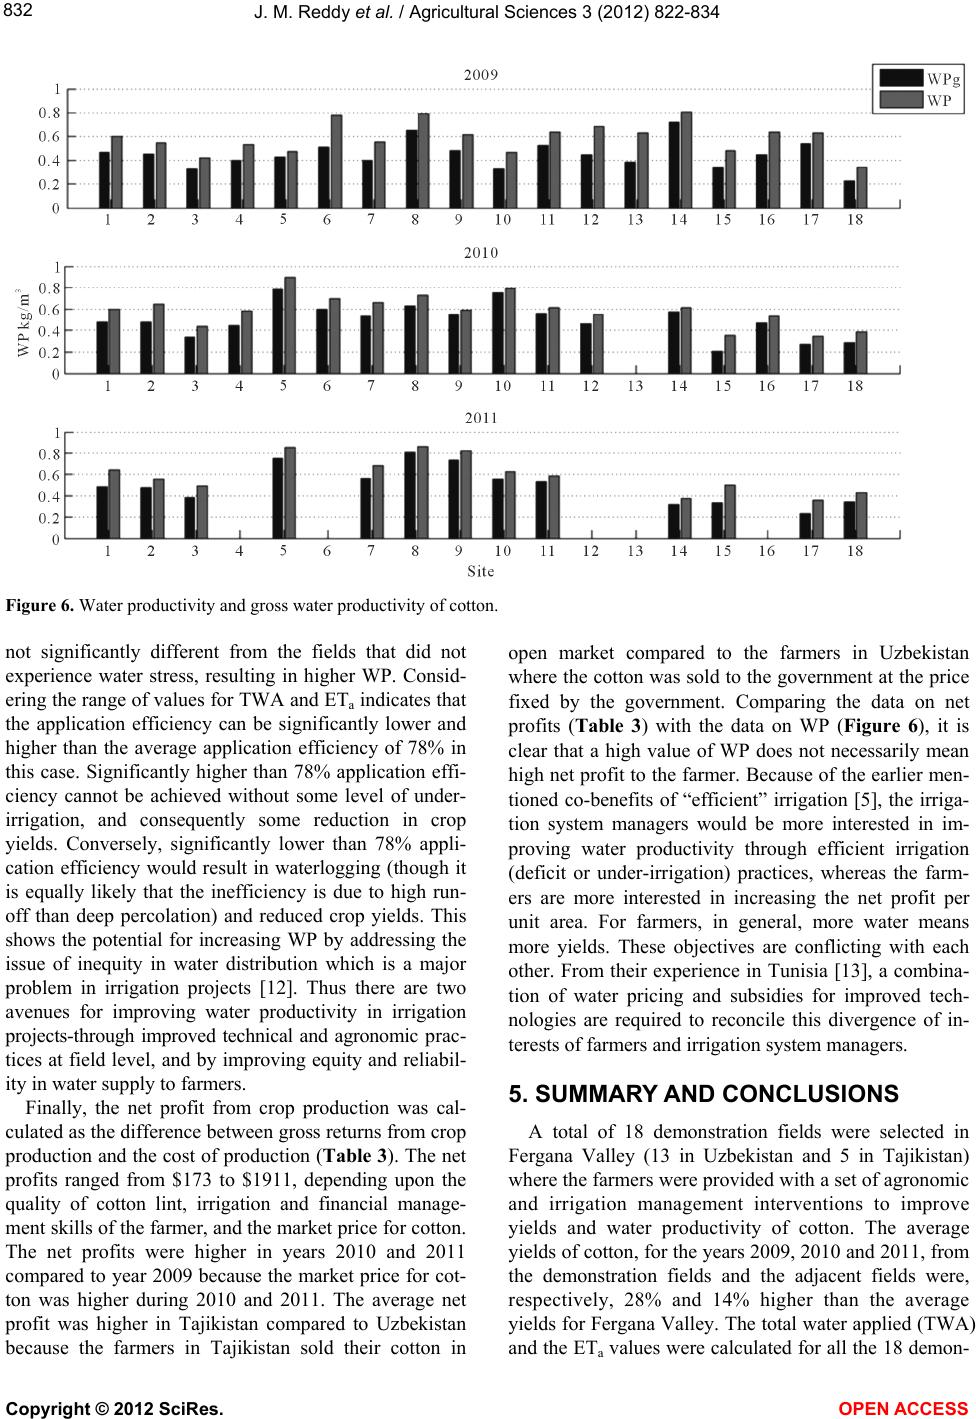 J. M. Reddy et al. / Agricultural Sciences 3 (2012) 822-834 832 Figure 6. Water productivity and gross water productivity of cotton. not significantly different from the fields that did not experience water stress, resulting in higher WP. Consid- ering the range of values for TWA and ETa indicates that the application efficiency can be significantly lower and higher than the average application efficiency of 78% in this case. Significantly higher than 78% application effi- ciency cannot be achieved without some level of under- irrigation, and consequently some reduction in crop yields. Conversely, significantly lower than 78% appli- cation efficiency would result in waterlogging (though it is equally likely that the inefficiency is due to high run- off than deep percolation) and reduced crop yields. This shows the potential for increasing WP by addressing the issue of inequity in water distribution which is a major problem in irrigation projects [12]. Thus there are two avenues for improving water productivity in irrigation projects-through improved technical and agronomic prac- tices at field level, and by improving equity and reliabil- ity in water supply to farmers. Finally, the net profit from crop production was cal- culated as the difference between gross returns from crop production and the cost of production (Table 3). The net profits ranged from $173 to $1911, depending upon the quality of cotton lint, irrigation and financial manage- ment skills of the farmer, and the market price for cotton. The net profits were higher in years 2010 and 2011 compared to year 2009 because the market price for cot- ton was higher during 2010 and 2011. The average net profit was higher in Tajikistan compared to Uzbekistan because the farmers in Tajikistan sold their cotton in open market compared to the farmers in Uzbekistan where the cotton was sold to the government at the price fixed by the government. Comparing the data on net profits (Table 3) with the data on WP (Figure 6), it is clear that a high value of WP does not necessarily mean high net profit to the farmer. Because of the earlier men- tioned co-benefits of “efficient” irrigation [5], the irriga- tion system managers would be more interested in im- proving water productivity through efficient irrigation (deficit or under-irrigation) practices, whereas the farm- ers are more interested in increasing the net profit per unit area. For farmers, in general, more water means more yields. These objectives are conflicting with each other. From their experience in Tunisia [13], a combina- tion of water pricing and subsidies for improved tech- nologies are required to reconcile this divergence of in- terests of farmers and irrigation system managers. 5. SUMMARY AND CONCLUSIONS A total of 18 demonstration fields were selected in Fergana Valley (13 in Uzbekistan and 5 in Tajikistan) where the farmers were provided with a set of agronomic and irrigation management interventions to improve yields and water productivity of cotton. The average yields of cotton, for the years 2009, 2010 and 2011, from the demonstration fields and the adjacent fields were, respectively, 28% and 14% higher than the average yields for Fergana Valley. The total water applied (TWA) and the ETa values were calculated for all the 18 demon- Copyright © 2012 SciRes. OPEN ACCES S  J. M. Reddy et al. / Agricultural Sciences 3 (2012) 822-834 833 Table 3. Cost of production, gross returns, and net returns from the demonstration sites for years 2009-2011. 2009 2010 2011 Total expenses Yield Gross revenue Net profit Total expenses Yield Gross revenue Net profit Total expenses Yield Gross revenue Net profit Site № Country Province Area, ha $/ha kg/ha $/ha $/ha Area, ha $/ha kg/ha$/ha $/ha Area, ha $/ha kg/ha $/ha $/ha 1 Uz Andijan 6 834 3800 1393 560 6 1472 4000 2347875 2 Uz Andijan 14 821 3600 1212 392 6 1079 3600 1532453 3 Uz Andijan 6.5 10963460 1269 173 11.5 1178 3620 1572395 4 Uz Andijan 7 855 3610 1221 3652 948.236001310 362 5 Uz Andijan 16.4 733 3660 1637 9043 1017 55002879 18623 1379 5000 25591179 6 Uz Fergana 4.8 857 4000 1360 5034.5577.140001593 1015 7 Uz Fergana 2 12883700 1607 3202 731.740001246 5141 1415 4100 1768353 8 Uz Fergana 4 648 3520 1412 7634 982.936501934 9510.15 1050 3887 1623573 9 Uz Fergana 2.5 838 3720 1116 2784 622.839251557 9343 756 3930 1631876 10 Uz Fergana 2.2 830 2800 1020 1904.2573 44201691 11182.5 1122 3380 1458336 11 Uz Namangan 10 684 3750 1294 6106 1026.442801315 28810834 4210 26891855 12 Uz Namangan 2 735 3800 1405 6702 506.639001545 1038 13 Uz Namangan 2 857 4700 1589 732 14 Taj Soght 2.4 873 4160 1725 8522.41004.441002596 15922.4 560 1900 1120560 15 Taj Soght 4.2 763 3440 3422 26594.2884.125801976 10924.2 877 3548 27651888 16 Taj Soght 1 10673970 1824 7571 912 41502623 1711 17 Taj Soght 1.6 944 4100 1699 7551.3749.232002023 12731.3 651 2308 1360710 18 Taj Soght 2 966 2500 2877 19112 1112.928001949 8362 1115 3020 29551839 stration sites for the irrigation seasons of 2009, 2010 and 2011, and these values for TWA and ETa ranged, respec- tively, from 5000 m3/ha to 12,000 m3/ha and 4500 m3/ha to 8000 m3/ha, suggesting a quadratic relationship be- tween TWA and ETa, with ETa values flattening off at higher values of TWA. During the three irrigation sea- sons, the calculated WP values ranged from 0.38 kg/m3 to 0.89 kg/m3, indicating that the farmers with a WP value less than the average WP of 0.58 kg/m3 have a high potential to increase crop yields (and thus WP) through improved irrigation and agronomic practices (including selection of appropriate crop variety). Cotton yields in year 2011 (dry year) were not significantly different from the yields achieved during 2009 and 2010 (wet years), which is basically explained by the quadratic re- lationship between TWA and ETa. On the average, the TWA values were 28% higher than the ETa, suggesting an average application effi- ciency of 78%. The remaining 22% of the water is lost from individual fields, but may or may not be lost from the basin. This needs to be carefully evaluated for each project. Considering the fact that more than 60% of the water used for irrigation in Tajikistan and Uzbekistan is pumped from rivers and collector drains, even if all this 22% of the water returns to the stream without any deg- radation in water quality, considerable energy savings would accrue from improved water management at field level. Since salinity of return flows is also a major issue in Central Asia, improved efficiency at field level would alleviate the problems of salinity in lower reaches of the river basins. An average application efficiency of 78% suggests that there were some fields that were under- irrigated (yield losses due to water stress), and some fields that were over-irrigated (yield losses due to leach- ing of fertilizers and temporary waterlogging conditions). Addressing the issue of inequity and reliability in water supply, through improved water management, would also increase crop yields and water productivity from project areas. In general, there is significant potential for increasing water productivity in Central Asia through a combination of improved agronomic and irrigation prac- tices at field level, and improved equity and reliability in Copyright © 2012 SciRes. OPEN ACCES S  J. M. Reddy et al. / Agricultural Sciences 3 (2012) 822-834 834 water delivery to fields. 6. ACKNOWLEDGEMENTS The funding for this research was provided by the Swiss Agency for Development and Cooperation (SDC)-Tashkent office, Uzbekistan, as part of the Water Productivity Improvement at Plot Level (WPI-PL) project. Their financial support is highly appreciated. REFERENCES [1] Abdullaev, I. and Molden, D. (2004) Spatial and temporal variability of water productivity in the Syr Darya basin, Central Asia. Water Resources Research, 40, 1-6. doi:10.1029/2003WR002364 [2] Allen, R., Pereira, L.S., Raes, D. and Smith, M. (2000) Crop Evapotranspiration. FAO Irrigation and Drainage Paper 56, Rome. [3] Evett, S.R. (2002) Water and energy balances at soil- plant-atmosphere interfaces. In: Warrick, A.A., Ed., The Soil Physics Companion, CRC Press LLC, Boca Raton. [4] Food and Agriculture Organization (1979) Yield Res- ponse to Water. FAO Irrigation and Drainage Paper 33, Rome. [5] Food and Agriculture Organization (1984) Crop water requirements. FAO Irrigation and Drainage Paper 24, Rome. [6] Gleick, P.H., Christian-Smith, J. and Cooley, H. (2011) Water use efficiency and productivity: Rethinking the basin approach. Water International, 36, 784-798. doi:10.1080/02508060.2011.631873 [7] Ibragimov, N., Evett, S.R., Esanbekov, Y., Kamilov, B.S., Mirzaev, L. and Lamers, J.P.A. (2007) Water use effi- ciency of irrigated cotton in Uzbekistan under drip irrigation and furrow irrigation. Agricultural Water Mana- gement, 90, 112-120. doi:10.1016/j.agwat.2007.01.016 [8] Kranz, W., Eisenhauer, D. and Retka, M. (1992) Water and energy conservation using irrigation scheduling with center-pivot irrigation systems. Agricultural Water Mana- gement, 22, 325-334. doi:10.1016/0378-3774(92)90040-4 [9] Luquet, D., Vidal, A., Smith, M. and Dauzat, J. (2005) “More crop per drop”: How to make it acceptable for farmers? Agricultural Water Management, 76, 108-119. doi:10.1016/j.agwat.2005.01.011 [10] Molden, D.J., Murray-Rust, H., Sakthivadivel, R. and Makin, I. (2003) A water productivity framework for understanding and action. In: Kijne, J.W., Barker, R. and Molden, D.J., Eds., Water Productivity in Agriculture: Limits and Opportunities for Improvement, CABI Pub- lishing, CAB International, Wallingford. doi:10.1079/9780851996691.0001 [11] Murray-Rust, H., Abdullaev, I., Ul-Hassan, M. and Ho- rinkova, V. (2003) Water productivity in the Syr Darya River Basin. Research Report 67, IWMI, Colombo. [12] Pereira, L.S., Dukhovny, V.A. and Horst, M.G., Eds. (2005) Irrigation management for combating desertification in the Aral Sea Basin: Assessment and tools. Vita Color Press, Tashkent. doi:10.1016/j.agwat.2004.09.041 [13] Reddy, J.M., Matyakubov, B., Jumaboev, K. and Eshmu- ratov, D. (2012) Analysis of equity and adequacy in water distribution within water users associations of Fergana Valley in Uzbekistan. Irrigation and Drainage Systems, unpublished. Copyright © 2012 SciRes. OPEN ACCES S
|