 Vol.3, No.6, 854-864 (2012) Agricultural Sciences http://dx.doi.org/10.4236/as.2012.36104 Effects of broad-leaf crop frequency in various rotations on soil organic C and N, and inorganic N in a Dark Brown soil Sukhdev S. Malhi1*, R. L. Lemke2, S. A. Brandt3 1Agriculture and Agri-Food Canada, Melfort, Canada; *Corresponding Author: sukhdev.malhi@agr.gc.ca 2Agriculture and Agri-Food Canada, Saskatoon, Canada 3Agriculture and Agri-Food Canada, Scott, Canada Received 23 June 2012; revised 24 July 2012; accepted 2 August 2012 ABSTRACT The objective of this study was to determine the impact of frequency of broad-leaf crops canola and pea in various crop rotations on pH, total organic C (TOC), total organic N (TON), light fraction organic C (LFOC) and light fraction or- ganic N (LFON) in the 0 - 7.5 and 7.5 - 15 cm soil depths in autumn 2009 after 12 years (1998-2009) on a Dark Brown Chernozem (Typic Boroll) loam at Scott, Saskatchewan, Canada. The field ex- periment contained monoculture canola (herbi- cide tolerant and blackleg resistant hybrid) and monoculture pea compared with rotations that contained these crops every 2-, 3-, and 4-yr with wheat. There was no effect of crop rotation du- ration and crop phase on soil pH. Mass of TOC and TON in the 0 - 15 cm soil was greater in ca- nola phase than pea phase in the 1-yr (mono- culture) and 2-yr crop rotations, while the oppo- site was true in the 3-yr and 4-yr crop rotations. Mass of TOC and TON (averaged across crop phases) in soil generally increased with in- creasing crop rotation duration, with the maxi- mum in the 4-yr rotation while no difference in the 1-yr and 2-yr rotations. Mass of LFOC and LFON in soil was greater in canola phase than pea phase in the 1-yr, 2-yr and 3-yr rot ations, but the opposite w as true in the 4-yr rotation. There was no consistent effect of crop rotation dura- tion on mass of LFOC and LFON. The N balance sheet over the 1998 to 2009 period indicated large amounts of unaccounted N for monocul- ture pea, suggesting a great potential for N loss from the soil-plant system in this treatment through nitrate leaching and/or deni trification. In conclusion, the findings suggest that the quan- tity of organic C and N can be maximized by in- creasing duration of crop rotation and by in- cluding hybrid canola in the rotation. Keywords: Broad -Leaf Crops; Canola; Frequency; Light Fraction Organi c C ; Light Fraction Organic N; Pea; Total Organic C; Total Organic N 1. INTRODUCTION Crop rotation (the growing of different crops in the same field in a planned sequence) is often practiced to mitigate pests that often become unmanageable in mono- cultures (cultivation of the same crop year after year on the same field) [1,2]. In western Canada, research has indicated that rotations balanced between broad-leaf crops (canola and pea) with cereals (wheat and barley) tended to have less pest problems and lower production risk than rotations that were heavily cereal or broad-leaf based [3]. In many years, canola and/or pea provide the best economic return to producers compared to other field crops grown in western Canada. For this reason production of canola or pea is often intensive, meaning it is grown more than once every four years on the same field. Research has shown that organic C in soil can be maintained or enhanced by combining reduced tillage or no-tillage with proper crop rotations that increase input of crop residues to soil and/or decrease their decomposi- tion [4-8]. However, the magnitude of change in organic C in soil may vary with crop type/species/diversity/in- tensity, rooting characteristics (layer/volume/mass) of each crop, soil type and climatic conditions [9,10]. Our previous paper has discussed the impacts of frequency of broad-leaf crops canola and pea in various crop rotations on accumulation and distribution of nitrate-N and ex- tractable P in the soil profile after 8 years [11]. The ob- jective of this study was to determine the impact of fre- quency of broad-leaf crops canola and pea in various crop rotations (grown in monoculture or in rotation with Copyright © 2012 SciRes. OPEN ACCESS  S. S. Malhi et al. / Agricultural Sciences 3 (2012) 854-864 855 wheat) on total organic C (TOC), total organic N (TON), light fraction organic C (LFOC), light fraction organic N (LFON) and pH in the 0 - 7.5 and 7.5 - 15 cm soil depths in autumn 2009 after 12 years (1998-2009) on a Dark Brown Chernozem (Typic Boroll) loam at Scott, Sas- katchewan, Canada. 2. MATERIALS AND METHODS A 12-yr field experiment was conducted from 1998 to 2009 on a Dark Brown Chernozem (Typic Boroll) loam at Scott, Saskatchewan. The field experiment was de- signed as split-plot of 12 crop rotations (main plots) and two fungicide (treated and untreated) treatments applied to sub-plots (Table 1), with all phases of each rotation present every year in four replications. For this area, the long-term average precipitation in the growing season (from May to August) is about 210 mm. Growing season precipitation was substantially below average in 1998, 2001 and 2008, fairly below average in 2002, 2003 and 2004, slightly below average in 2000, 2006 and 2009, above average in 1999 and 2007, and very wet in 2005. All crops were seeded with a Versatile Noble hoe drill set at 23-cm row spacing. Seeding rate was 245 kg·ha−1 for pea, 7 - 9 kg·ha−1 for canola, 100 kg·ha−1 for wheat and 50 - 62 kg·ha−1 for flax. All plots received monoammo- nium phosphate seed placed to supply adequate amounts of P (15 kg·P·ha−1 plus 7 kg·N·ha−1) and nitrogen (N) as 46-0-0 midrow banded at the time of seeding at rates based on soil test recommendations (on average ranged from 11 to 60 kg·N·ha−1, with no N fertilizer to pea) for optimum crop growth and yield. Appropriate herbicides were applied to control annual weeds. The crops were harvested for seed yield every year and straw was re- turned to each corresponding plot/treatment. In the autumn of 2009, soil samples in selected treat- ments were obtained by taking 10 cores (about 2.4 cm diameter) from the 0 - 7.5, 7.5 - 15 and 15 - 20 cm layers. Bulk density of soil was determined by the core method using soil weight and core volume [12]. The soil samples were air dried at room temperature after removing coarse roots and easily detectable crop residues, and ground to pass a 2-mm sieve. Sub-samples were pulverized in a vibrating-ball mill (Retsch, Type MM2, Brinkman In- struments Co., Toronto, Ontario) for determination of TOC, TON, LFOC and LFON in soil. Soil samples used for organic C and N analyses were tested for the presence of inorganic C (carbonates) using dilute HCl, and none was detected in any soil sample. Therefore, C in soil as- sociated with each fraction was considered to be of or- ganic origin. Total organic C in soil was measured by Dumas combustion using a Carlo Erba instrument (Model NA 1500, Carlo Erba Strumentazione, Italy), and Technicon Industrial Systems [13] method was used to determine TON in the soil. Light fraction organic matter (LFOM) was separated using a NaI solution of 1.7 Mg·m−3 specific gravity, as described by Janzen et al. [6] and modified by Izaurralde et al. [14]. The C and N in LFOM (LFOC, LFON) were measured by Dumas com- bustion. Soil samples (ground to pass a 2-mm sieve) from the 0 - 7.5 and 7.5 - 15 cm layers were also moni- tored for pH in 0.01 M CaCl2 solution with a pH meter. In autumn 2009, soil samples were also obtained by taking 4 cores (using 4-cm diameter coring tube) from the 0 - 15, 15 - 30 and 30 - 60 cm layers. The bulk den- sity of soil was determined by the core method using soil weight and core volume [12]. The soil samples were air dried at room temperature, ground to pass a 2-mm sieve, and then analyzed for ammonium-N [15] and nitrate-N [16] by extracting soil in a 1:5 ratio of soil and 2 M KCl solution. The cumulative amounts of crop residue (CR) input from 1998 to 2009 growing seasons were estimated as: above-ground residue (AGR) + belowground residue (BGR) returned to soil. The AGR was determined from the straw yield of each crop from 1998 to 2009 growing seasons. The BGR was estimated from grain dry weight Table 1. Description of crop rotations in a field experiment from 1998 to 2009 at Scott Saskatchewan. Crop rotation name (duration) Crop rotation Input of C from crop residue in 12 years (kg·C·ha−1) Monoculture (1-yr) Monoculture hybrid canola 20,847 Monoculture (1-yr) Monoculture pea 9930 2-year rotation (2-yr) Hybrid canola-wheat 26,697 2-year rotation (2-yr) Pea-wheat 18,482 3-year rotation (3-yr) Pea-hybrid canola-wheat 20,724 3-year rotation (3-yr) Pea-hybrid canola-wheat 22,705 4-year rotation (4-yr) Hybrid canola-wheat-pea-wheat 24,854 4-year rotation (4-yr) Hybrid canola-wheat-pea-wheat 23,910 Copyright © 2012 SciRes. OPEN ACCESS  S. S. Malhi et al. / Agricultural Sciences 3 (2012) 854-864 856 (GDW) and AGR, using the formula: BGR = a (GDW + AGR). The value of the constant “a” was 0.24 for wheat and 0.25 for canola [17], and 0.25 for pea. The amounts of crop residue C input were estimated by multiplying the concentration of total C by the amount of crop resi- due input in various rotation treatments. The estimated C concentration was 45% for wheat, 42% for canola [18], and 40% for pea [19]. The cumulative amounts of crop residue C were calculated as: CR-C = AGR-C + BGR-C; for 1998 to 2009 (12 years). The estimated amounts of N balance and unaccounted N over the 1998 to 2009 period for the 8 treatments [two crop phases (canola and pea) and four crop rotation durations (1-yr, 2-yr, 3-yr and 4-yr)]; Table 7 was calculated as the difference between total of N applied as fertilizers in 12 years + N fixed by pea in rotations with pea + N added in seed at seeding in 12 years minus N removed in seed in 12 years (for N balance) + nitrate-N recovered in soil in autumn 2009 (for unaccounted N). The data for each parameter were subjected to analysis of variance (ANOVA) using procedures as outlined in SAS [20]. Significant (P ≤ 0.05) differences between treatments were determined using LSmeans (Proc GLM, SAS 6.1 for windows). The least significant difference (LSD0.05) test was used to compare treatment means for various parameters. Correlations between mass of or- ganic C or N in soil in autumn 2009 and the amount of crop residue C input from 1998 to 2009 growing seasons were calculated using the linear (REG) procedure. 3. RESULTS AND DISCUSSION 3.1. Soil pH There was no significant effect of crop rotation dura- tion and crop phase on pH in the 0 - 7.5 and 7.5 - 15 cm soil layers (data not shown). The soil pH ranged from 4.9 to 5.5 in the 0 - 7.5 cm layer and from 4.7 to 5.6 in the 7.5 to 15 cm layer among different treatments. Similar to a previous study at this site, there was no consistent ef- fect of crop diversification/rotation on soil pH [21]. Be- cause soil at this site is already fairly acid, acidification of soil from application of N fertilizer at moderate rates or from including pea legume in the rotation is not ex- pected to be a serious problem in this soil site. 3.2. Organic C and N Fraction in Soil The mass of TOC and TON in soil varied with the crop rotation duration and/or frequency of canola or pea in the rotation, but the crop rotation duration × crop phase interaction effect was significant only for TOC (P ≤ 0.10) and TON (P ≤ 0.05) in the 7.5 - 15 cm soil layer (Table 2). For example, mass of TOC and TON in the 0 - 15 cm soil tended to be greater in canola phase than pea phase in the 1-yr (monoculture) and 2-yr crop rotations, while the opposite was true in the 3-yr and 4-yr crop ro- tations. Averaged across crop phases, mass of TOC and TON in soil generally increased with increasing crop rotation duration (but significant only for TOC (P ≤ 0.06) and TON (P ≤ 0.05) in the 7.5 - 15 cm soil layer, with the maximum in the 4-yr crop rotation while no difference in the 1-yr and 2-yr rotations. When ANOVA was con- ducted separately for canola and pea phases, the ANOVA for canola phase did not indicate any significant effect of crop rotation duration and/or frequency of canola in the rotation on TOC and TON. However, the ANOVA for pea phase showed significant effect of crop rotation du- ration and/or frequency of pea in the rotation on TOC and TON in the 7.5 - 15 (P ≤ 0.05) soil layer and in the total 0 - 15 (P ≤ 0.14) cm soil depth. Mass of TOC and TON (averaged across crop rotation duration) tended to be greater (but not significant) in canola phase than pea phase. Of interest, despite markedly lower C inputs, TOC under the continuous pea treatment was not greatly dis- similar to other treatments. Similar results have been reported by other workers. In a long-term study on a Brown Chernozem, Campbell et al. [22] reported lower C inputs but similar SOC status for a wheat-lentil com- pared to a continuous wheat treatment. In an incubation study using 13C-CO2 to label C inputs from growing crops, Comeau [23] estimated significantly lower C in- puts to soil under pea compared to canola, but similar amounts of 13C “stabilized” in the soil at the end of two growing cycles. These results support the hypothesis that pea residues are more efficiently stabilized as SOC than wheat and particularly canola. The mass of LFOC and LFON in soil varied greatly with the duration/frequency of canola/pea in the crop rotations, but the crop rotation duration × crop phase interaction effect was significant only for TOC (P ≤ 0.12) in the 0 - 7.5 cm soil layer (Table 3). Like TOC and TON, mass of LFOC and LFON in soil tended to be greater in canola phase than pea phase in the 1-yr and 2-yr rota- tions, but the opposite was true in the 3-yr and 4-yr rota- tions. Compared to 1-yr rotation, mass of LFOC and LFON (averaged across crop phases) in soil decreased with 2-yr and 3-yr rotations, and then increased, with greater LFOC and LFON in soil for 4-yr than 1-yr rota- tions in the 0 - 7.5 cm layer, but again the effect was sig- nificant only for LFOC (P ≤ 0.12) in the 0 - 7.5 cm soil layer. When ANOVA was conducted separately for ca- nola and pea phases, there was no significant effect of crop rotation duration and/or frequency of canola in the rotation on LFOC and LFON for canola phase. However, for pea phase, the ANOVA showed significant effect of crop rotation duration and/or frequency of canola in the rotation on LFOC in the 0 - 7.5 cm soil layer (P ≤ 0.06) Copyright © 2012 SciRes. OPEN ACCESS  S. S. Malhi et al. / Agricultural Sciences 3 (2012) 854-864 857 Tabl e 2. Effect of broad-leaf crop phase and frequency over 12 years from 1998 to 2009 on mass of total organic C (TOC) and total organic N (TON) in soil in autumn 2009 at Scott, Saskatchewan, Canada. Treatment TOC mass (Mg·C·ha−1) in soil layers (cm) TON mass (Mg·N·ha−1) in soil layers (cm) Crop rotation (duration) Crop phase 0 - 7.5 7.5 - 15 0 - 15 0 - 7.5 7.5 - 15 0 - 15 Monoculture (1-year) Canola 24.77 21.57 46.34 2.198 1.965 4.163 Monoculture (1-year) Pea 22.33 21.95 44.28 2.007 1.960 3.967 Canola-wheat (2-year) Canola 26.08 23.99 50.07 2.253 2.166 4.419 Pea-wheat (2-year) Pea 21.19 20.00 41.19 1.858 1.787 3.645 Pea-canola-wheat (3-year) Canola 23.55 24.03 47.58 2.045 2.103 4.148 Pea-canola-wheat (3-year) Pea 23.14 26.81 49.95 2.086 2.388 4.474 Canola-wheat-pea-wheat (4-year) Canola 24.75 24.95 49.70 2.152 2.208 4.360 Canola-wheat-pea-wheat (4-year) Pea 26.00 25.56 51.56 2.222 2.256 4.478 LSD0.05 ns 4.74 ns ns 0.387 ns SEM (significance) 1.589ns 1.612 2.712ns 0.1348ns 0.1316 0.2330ns Crop rotation duration 1-year 23.55 21.76 45.31 2.103 1.962 4.065 2-year 23.64 21.99 45.63 2.055 1.977 4.032 3-year 23.35 25.42 48.76 2.066 2.246 4.312 4-year 25.37 25.25 50.63 2.187 2.232 4.419 LSD0.05 ns 3.44 ns ns 0.291 ns SEM (significance) 1.151ns 1.178 2.015ns 0.0965 ns 0.0997 0.1701 ns Crop phase Canola 24.79 23.63 48.42 2.162 2.111 4.273 Pea 23.17 23.58 46.75 2.044 2.098 4.141 LSD0.05 ns ns ns ns ns ns SEM (significance) 0.814ns 0.833ns 1.425ns 0.0682 ns 0.0705 ns 0.1203 ns Additional statistical comparisons Significance of four crop rotation durations for canola phase only LSD0.05 ns ns ns ns ns ns SEM (significance) 1.109ns 1.670ns 2.515ns 0.0829ns 0.1458ns 0.2108ns Significance of four crop rotation durations for pea phase only LSD0.05 ns 5.00 10.18 ns 0.398 0.832 SEM (significance) 2.135ns 1.564 3.183 0.1856ns 0.1244* 0.2599 , * and ns refer to significant treatment effects in ANOVA at P ≤ 0.1, P ≤ 0.05 and not significant, respectively. Copyright © 2012 SciRes. OPEN ACCESS  S. S. Malhi et al. / Agricultural Sciences 3 (2012) 854-864 858 Table 3. Effect of broad-leaf crop phase and frequency over 12 years from 1998 to 2009 on mass of light fraction organic C (LFOC) and light fraction organic N (LFON) in soil in autumn 2009 at Scott, Saskatchewan, Canada. Treatment LFOC mass (kg·C·ha−1) in soil layers (cm) LFON mass (kg·N·ha−1) in soil layers (cm) Crop rotation (duration) Crop phase 0 - 7.5 7.5 - 15 0 - 15 0 - 7.5 7.5 - 15 0 - 15 Monoculture (1-year) Canola 3283 889 4172 212 48 260 Monoculture (1-year) Pea 2520 694 3214 168 42 210 Canola-wheat (2-year) Canola 2733 831 3564 171 46 217 Pea-wheat (2-year) Pea 2317 814 3131 154 49 203 Pea-canola-wheat (3-year) Canola 2193 816 3009 150 47 197 Pea-canola-wheat (3-year) Pea 2723 962 3685 176 54 230 Canola-wheat-pea-wheat (4-year) Canola 3081 923 4004 186 51 237 Canola-wheat-pea-wheat (4-year) Pea 3348 855 4203 201 48 249 LSD0.05 918 ns ns ns ns ns SEM (significance) 312.0 110.5ns 365.9ns 18.5ns 6.3ns 22.7ns Crop rotation duration 1-year 2901 792 3693 190 45 235 2-year 2525 822 3347 162 47 209 3-year 2458 889 3347 163 50 213 4-year 3215 889 4014 193 49 242 LSD0.05 677 ns ns ns ns ns SEM (significance) 231.8 77.2ns 273.1ns 13.4ns 4.3ns 16.2ns Crop phase Canola 2823 865 3688 180 48 228 Pea 2727 831 3558 175 48 223 LSD0.05 ns ns ns ns ns ns SEM (significance) 163.9ns 54.6ns 193.1ns 9.5ns 3.0ns 11.5ns Additional statistical comparisons Significance of four crop rotation durations for canola phase only LSD0.05 ns ns ns ns ns ns SEM (significance) 334.5ns 125.2ns 430.8ns 21.9ns 7.2ns 27.1ns Significance of four crop rotation durations for pea phase only LSD0.05 769 ns 818 ns ns ns SEM (significance) 240.3 112.4ns 255.8* 13.2ns 6.3ns 17.6ns * and ns refer to significant treatment effects in ANOVA at P ≤ 0.1, P ≤ 0.05 and not significant, respectively. , Copyright © 2012 SciRes. OPEN ACCESS  S. S. Malhi et al. / Agricultural Sciences 3 (2012) 854-864 Copyright © 2012 SciRes. OPEN ACCESS 859 and in the total 0 - 15 cm soil depth (P ≤ 0.05), but for LFON it was significant at P ≤ 0.16 in the 0 - 7.5 soil layer. Mass of LFOC and LFON (averaged across crop rotation duration) in soil tended to be greater in canola phase than pea phase in most cases. There were strong and highly significant positive cor- relation coefficients between TOC and TON, and be- tween LFOC and LFON fractions in soil (Ta ble 4). The correlations between TOC and LFOC (significant at P ≤ 0.12), and between TON and LFON (significant at P ≤ 0.10) were moderate. The crop residue C or N input over 12 growing seasons (Table 1) had significant correlation coefficients with TOC (significant at P ≤ 0.05) and TON (significant at P ≤ 0.06). For linear regressions between crop residue C input and TOC, TON, LFOC or LFON, the R2 values were significant (significant at P ≤ 0.05) for TOC and TON (Table 5). In an 8-yr study with 4-yr rotations on a Black Cher- nozem soil in northeastern Saskatchewan, previous re- search has shown no effect of broad-leaf frequency (1, 2 or 3 broad-leaf crops in 4-yr rotations) on organic C and N in soil [10]. In another study on a Brown Chernozem soil in southern Saskatchewan, annually cropped rota- tions stored more organic C in soil than crop rotations with bare summer fallow, but there was no influence of crop phase on soil organic C under continuously cropped rotations [9]. However in our present 12-yr study, TOC, TON, LFOC and LFON all increased (although signifi- cant only in a few cases) with increasing duration of crop rotation, with the maximum soil organic C and N in the 4-yr rotations and also greater organic C and N in soil in canola phase than pea phase. It is possible that inclusion of other crops, such as wheat with high lignin content in straw which is relatively slow to decompose, may have resulted in this slow build-up of organic C and N in soil in the longer duration rotations, especially 4-year rota- tion with two wheat crops. Because of relatively much smaller amounts of annual inputs of crop residue C or N compared to the amounts of organic C or N stocks in soil, there is generally a slow build-up of organic C or N in soil. This makes it very difficult to detect significant increase in storage of or- ganic C or N in soil due to management practices, espe- cially from crop rotations where crop residues (roots and Tab le 4 . Relationships among organic C or N fractions (TOC, TON, LFOC, LFON) in the 0 - 15 cm soil, or between crop residue input from 1998 to 2009 growing seasons and organic C or N stored in the 0 - 15 cm soil sampled in autumn 2009 at Scott, Saskatchewan, Canada. Correlation coefficients (r) Parameter TOC TON LFOC LFON Relationships among soil organic C or N fractions TOC 0.986*** 0.598 0.463ns TON 0.626 0.516ns LFOC 0.973*** LFON Relationships between crop residue C input and soi l o rgan ic C or N fractions Crop residue C input 0.717* 0.678 0.511ns 0.359ns , *, *** and ns refer to significant treatment effects in ANOVA at P ≤ 0.1, P ≤ 0.05, P ≤ 0.001 and not significant, respectively. Table 5. Linear regressions for relationships between crop residue C input from 1998 to 2009 growing sea- sons and organic C or N (TOC, TON, LFOC, LFON) stored in the 0 - 15 cm soil sampled in autumn 2009 at Scott, Saskatchewan, Canada. Crop parameter (X) Soil C or N parameter (Y)zLinear regression (Y = a + bX) R2 Crop residue C input TOC Y = 37.42 + 0.0005X 0.514* TON Y = 3.408 + 0.00004X 0.458* LFOC Y = 2640 + 0.047X 0.261ns LFON Y = 192.4 + 0.002X 0.131ns zY = Soil organic C or N fraction (TOC and TON as Mg C or N·ha−1; and LFOC, LFON as kg C or N·ha−1; a = Intercept on Y, ori- gin of the line; b = Regression coefficient of Y on X, slope of line; X = Crop residue and/or swine manure C input (Mg·ha−1); * and ns refer to significant treatment effects in ANOVA at P ≤ 0.05 and not significant, respectively.  S. S. Malhi et al. / Agricultural Sciences 3 (2012) 854-864 860 straw) are returned to soil in all crop phases. Similarly, in our study there was an increase in storage of TOC or TON in soil with increasing length of crop rotation from monoculture pea (1-year) to canola-wheat-pea-wheat ro- tation (4-year) but the differences were significant only in a few cases even after 12 years. Previous research has shown that dynamic organic C or N fractions are more responsive to management prac- tices than total organic C or N under annual crops [24- 27]. Similarly, in our study the changes in LFOC and LFON were more pronounced than TOC and TON, al- though the increases in LFOC and LFON in soil due to crop rotations were not significant. 3.3. Residual Nitrate-N and Ammonium-N in Soil The crop rotation duration × crop phase interaction effect was significant in most soil layers (Table 6). This was due to usually greater amounts of nitrate-N in pea phase than canola phase, particularly in the 1-yr rotation. The mean effect of crop rotation length/duration on soil ni- trate-N was significant (at P ≤ 0.1) only in the total 0 - 60 cm depth, but the amounts of nitrate-N were usually highest in all soil layers for monocultures, with the low- est nitrate-N in the 4-yr rotation. When ANOVA was conducted separately for canola and pea phases, there was no significant effect of crop rotation duration and/or frequency of canola in the rotation on soil nitrate-N. However, for pea phase there was a significant (at P ≤ 0.1) effect of crop rotation duration and/or frequency of pea in the rotation on nitrate-N in the 15 - 30 and 30 - 60 cm soil layers. The amount of nitrate-N (averaged across crop rotation duration) was significantly greater in pea phase than canola phase in all soil layers. The generally higher soil nitrate-N in most layers with monoculture was probably due to relatively lower cumulative crop yield and total N uptake in seed in 1-yr rotation com- pared to longer rotations [11]. In another study in Sas- katchewan, nitrate-N in soil was also higher in 6-yr con- tinuous rotations with low crop diversity compared to rotations with high diversity of annual grain crops [21]. Earlier research has also suggested that residual N in soil can be decreased with efficient cropping systems [28]. Similarly, in our study soil nitrate-N in most soil layers was usually lowest in the 3-yr and 4-yr rotations with pea and 4-yr rotation with canola, suggesting the importance of 3- or 4-year rotations in reducing residual nitrate-N in the soil profile. The mean effect of crop phase on ammonium-N in soil was not significant in any soil layer, but the crop rotation duration × crop phase interaction effect was significant in the 0 - 60 cm depth most likely due to greater amounts of ammonium-N in soil in canola phase than pea phase (Table 6). When ANOVA was conducted separately for canola and pea phases, there was no significant effect of crop rotation duration and/or frequency of pea in the ro- tation on soil ammonium-N. But, there was a significant effect of crop rotation duration and/or frequency of ca- nola in the rotation on ammonium-N in the 15 - 30 and 30 - 60 cm soil layers. The tendency of greater amounts of ammonium-N (averaged across crop phases) in 1-yr or 2-yr rotation than 3-yr or 4-yr rotations in the 30 - 60 cm soil layer or 0 - 60 cm depth were most likely due to con- tribution through ammonification of N of recently added residue from crops with relatively longer taproots at deeper depth, particularly canola. 3.4. Amounts of N Uptake in Seed, Residual Nitrate-N in Soil and N Balance The N balance over the 1998 to 2009 period for the 8 treatments (4 rotation durations × 2 crop phases) in- cluded amount of inorganic N applied as fertilizers, N added in seed at seeding time, estimated biologically fixed N (BFN) by pea when it was grown, amount of N recovered in seed over 12 years and mineral N (nitrate-N + ammonium-N) recovered in the 0 - 60 cm soil in au- tumn 2009 after 12 growing seasons, and the estimated amount of unaccounted N (Table 7). The estimated amount of N recovered in seed (which was removed from the land/field) plus the amount of mineral-N recov- ered in soil in various treatments ranged from 658 to 1103 kg·N·ha−1. The corresponding values of N applied as inorganic fertilizers, plus N added in seed and BFN during the 12-year experimental period ranged between 556 and 1522 kg·N·ha−1. The amounts of N that could not be accounted for ranged from 441 to −296 kg·N·ha−1. The amounts of unaccounted N were positive with monoculture pea, and the unaccounted N was much greater with pea than canola in the monoculture and 2-yr rotations, while the differences were small between the canola and pea phases in the 3-yr and 4-yr rotations. The positive unaccounted N reflects an excess of N that was applied to and/or fixed by pea compared to the N recov- ered in crop seed yield plus nitrate-N recovered in soil in the 1-yr rotation. The results of our study do not suggest any over-application of N, because little N was applied to pea and annual rates of applied N to other crops were moderate, and in canola phase the N balance was nega- tive. It is possible that a portion of the fixed/applied N in 1-yr rotation in pea phase may have leached down below the 60 cm soil depth, as evidenced by greater amounts of nitrate-N recovered in the 30 - 60 cm layer in this study (Table 6), and also in the 60 - 90 cm layer in some treat- ments in the same experiment in autumn 2005 in our previous report [11]. Other researchers have reported an increase in the concentration f residual soil nitrate-N at o Copyright © 2012 SciRes. OPEN ACCESS 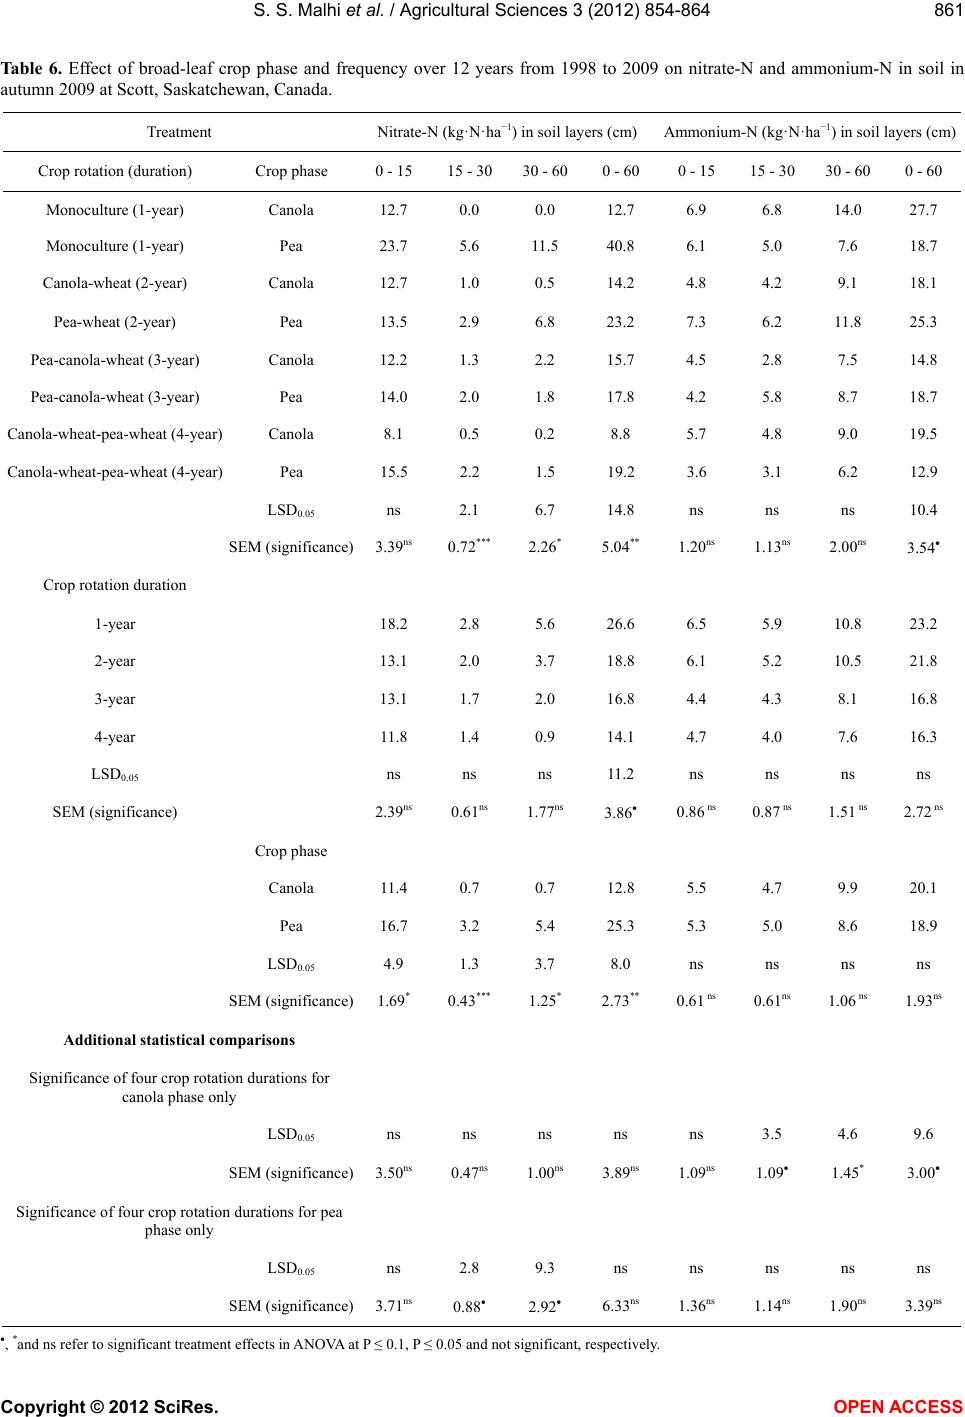 S. S. Malhi et al. / Agricultural Sciences 3 (2012) 854-864 861 Ta b l e 6 . Effect of broad-leaf crop phase and frequency over 12 years from 1998 to 2009 on nitrate-N and ammonium-N in soil in autumn 2009 at Scott, Saskatchewan, Canada. Treatment Nitrate-N (kg·N·ha−1) in soil layers (cm) Ammonium-N (kg·N·ha−1) in soil layers (cm) Crop rotation (duration) Crop phase 0 - 15 15 - 3030 - 600 - 60 0 - 15 15 - 30 30 - 600 - 60 Monoculture (1-year) Canola 12.7 0.0 0.0 12.7 6.9 6.8 14.0 27.7 Monoculture (1-year) Pea 23.7 5.6 11.5 40.8 6.1 5.0 7.6 18.7 Canola-wheat (2-year) Canola 12.7 1.0 0.5 14.2 4.8 4.2 9.1 18.1 Pea-wheat (2-year) Pea 13.5 2.9 6.8 23.2 7.3 6.2 11.8 25.3 Pea-canola-wheat (3-year) Canola 12.2 1.3 2.2 15.7 4.5 2.8 7.5 14.8 Pea-canola-wheat (3-year) Pea 14.0 2.0 1.8 17.8 4.2 5.8 8.7 18.7 Canola-wheat-pea-wheat (4-year) Canola 8.1 0.5 0.2 8.8 5.7 4.8 9.0 19.5 Canola-wheat-pea-wheat (4-year) Pea 15.5 2.2 1.5 19.2 3.6 3.1 6.2 12.9 LSD0.05 ns 2.1 6.7 14.8 ns ns ns 10.4 SEM (significance) 3.39ns 0.72*** 2.26* 5.04** 1.20ns 1.13ns 2.00ns 3.54 Crop rotation duration 1-year 18.2 2.8 5.6 26.6 6.5 5.9 10.8 23.2 2-year 13.1 2.0 3.7 18.8 6.1 5.2 10.5 21.8 3-year 13.1 1.7 2.0 16.8 4.4 4.3 8.1 16.8 4-year 11.8 1.4 0.9 14.1 4.7 4.0 7.6 16.3 LSD0.05 ns ns ns 11.2 ns ns ns ns SEM (significance) 2.39ns 0.61ns 1.77ns 3.86 0.86 ns 0.87 ns 1.51 ns 2.72 ns Crop phase Canola 11.4 0.7 0.7 12.8 5.5 4.7 9.9 20.1 Pea 16.7 3.2 5.4 25.3 5.3 5.0 8.6 18.9 LSD0.05 4.9 1.3 3.7 8.0 ns ns ns ns SEM (significance) 1.69* 0.43*** 1.25* 2.73** 0.61 ns 0.61ns 1.06 ns 1.93ns Additional statistical comparisons Significance of four crop rotation durations for canola phase only LSD0.05 ns ns ns ns ns 3.5 4.6 9.6 SEM (significance) 3.50ns 0.47ns 1.00ns 3.89ns 1.09ns 1.09 1.45* 3.00 Significance of four crop rotation durations for pea phase only LSD0.05 ns 2.8 9.3 ns ns ns ns ns SEM (significance) 3.71ns 0.88 2.92 6.33ns 1.36ns 1.14ns 1.90ns 3.39ns , *and ns refer to significant treatment effects in ANOVA at P ≤ 0.1, P ≤ 0.05 and not significant, respectively. Copyright © 2012 SciRes. OPEN ACCESS 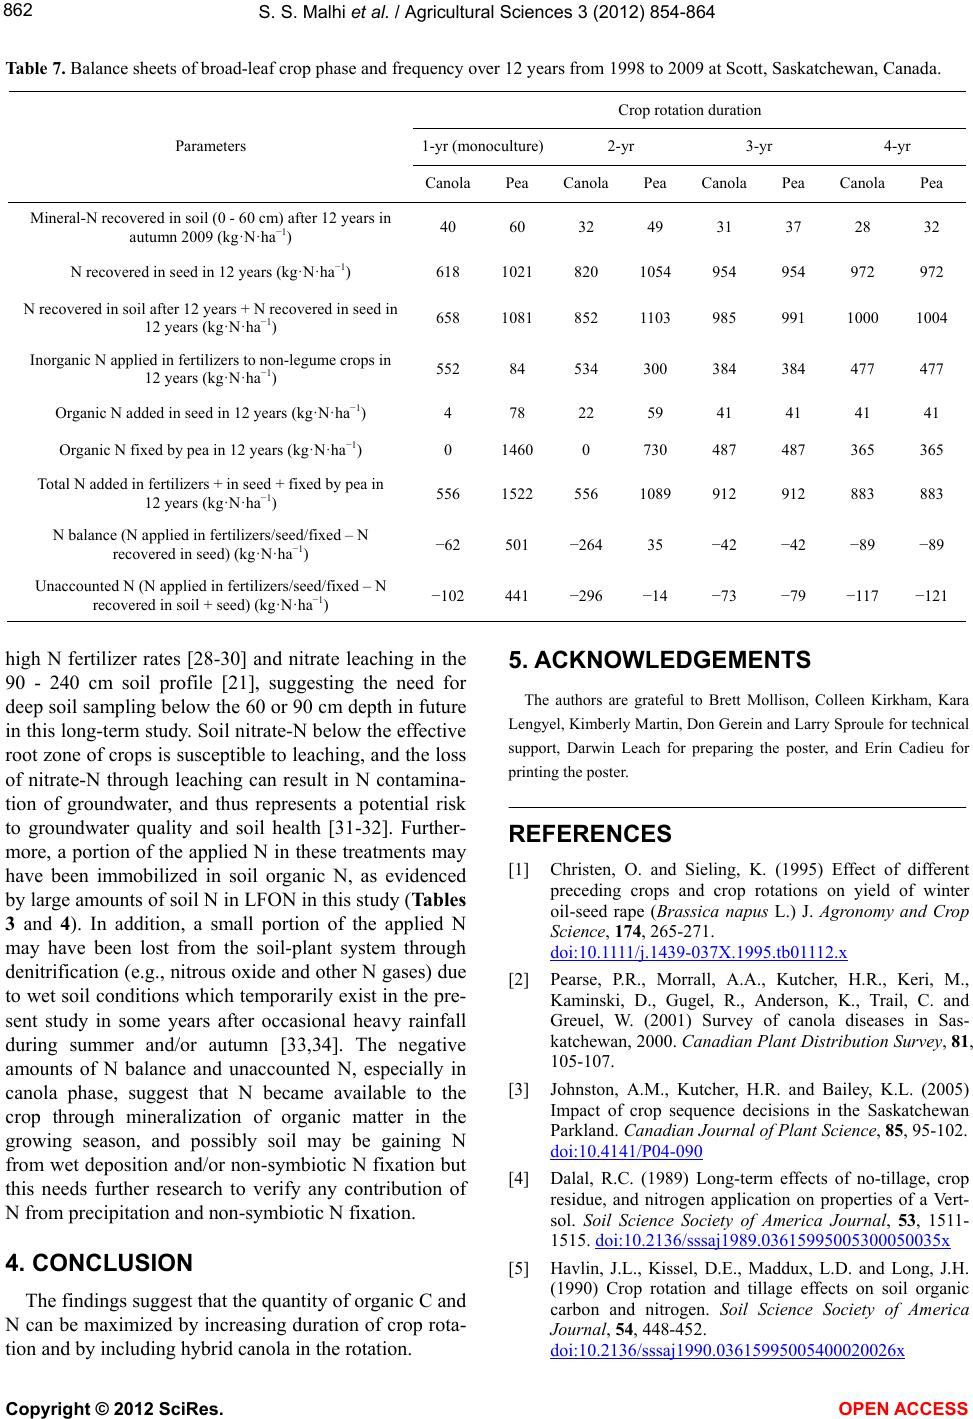 S. S. Malhi et al. / Agricultural Sciences 3 (2012) 854-864 862 Table 7. Balance sheets of broad-leaf crop phase and frequency over 12 years from 1998 to 2009 at Scott, Saskatchewan, Canada. Crop rotation duration 1-yr (monoculture)2-yr 3-yr 4-yr Parameters Canola Pea Canola Pea Canola Pea Canola Pea Mineral-N recovered in soil (0 - 60 cm) after 12 years in autumn 2009 (kg·N·ha−1) 40 60 32 49 31 37 28 32 N recovered in seed in 12 years (kg·N·ha−1) 618 1021 820 1054 954 954 972 972 N recovered in soil after 12 years + N recovered in seed in 12 years (kg·N·ha−1) 658 1081 852 1103 985 991 1000 1004 Inorganic N applied in fertilizers to non-legume crops in 12 years (kg·N·ha−1) 552 84 534 300 384 384 477 477 Organic N added in seed in 12 years (kg·N·ha−1) 4 78 22 59 41 41 41 41 Organic N fixed by pea in 12 years (kg·N·ha−1) 0 1460 0 730 487 487 365 365 Total N added in fertilizers + in seed + fixed by pea in 12 years (kg·N·ha−1) 556 1522 556 1089 912 912 883 883 N balance (N applied in fertilizers/seed/fixed – N recovered in seed) (kg·N·ha−1) −62 501 −264 35 −42 −42 −89 −89 Unaccounted N (N applied in fertilizers/seed/fixed – N recovered in soil + seed) (kg·N·ha−1) −102 441 −296 −14 −73 −79 −117 −121 high N fertilizer rates [28-30] and nitrate leaching in the 90 - 240 cm soil profile [21], suggesting the need for deep soil sampling below the 60 or 90 cm depth in future in this long-term study. Soil nitrate-N below the effective root zone of crops is susceptible to leaching, and the loss of nitrate-N through leaching can result in N contamina- tion of groundwater, and thus represents a potential risk to groundwater quality and soil health [31-32]. Further- more, a portion of the applied N in these treatments may have been immobilized in soil organic N, as evidenced by large amounts of soil N in LFON in this study (Tables 3 and 4). In addition, a small portion of the applied N may have been lost from the soil-plant system through denitrification (e.g., nitrous oxide and other N gases) due to wet soil conditions which temporarily exist in the pre- sent study in some years after occasional heavy rainfall during summer and/or autumn [33,34]. The negative amounts of N balance and unaccounted N, especially in canola phase, suggest that N became available to the crop through mineralization of organic matter in the growing season, and possibly soil may be gaining N from wet deposition and/or non-symbiotic N fixation but this needs further research to verify any contribution of N from precipitation and non-symbiotic N fixation. 4. CONCLUSION The findings suggest that the quantity of organic C and N can be maximized by increasing duration of crop rota- tion and by including hybrid canola in the rotation. 5. ACKNOWLEDGEMENTS The authors are grateful to Brett Mollison, Colleen Kirkham, Kara Lengyel, Kimberly Martin, Don Gerein and Larry Sproule for technical support, Darwin Leach for preparing the poster, and Erin Cadieu for printing the poster. REFERENCES [1] Christen, O. and Sieling, K. (1995) Effect of different preceding crops and crop rotations on yield of winter oil-seed rape (Brassica napus L.) J. Agronomy and Crop Science, 174, 265-271. doi:10.1111/j.1439-037X.1995.tb01112.x [2] Pearse, P.R., Morrall, A.A., Kutcher, H.R., Keri, M., Kaminski, D., Gugel, R., Anderson, K., Trail, C. and Greuel, W. (2001) Survey of canola diseases in Sas- katchewan, 2000. Canadian Plant Distribution Survey, 81, 105-107. [3] Johnston, A.M., Kutcher, H.R. and Bailey, K.L. (2005) Impact of crop sequence decisions in the Saskatchewan Parkland. Canadian Journal of Plant Science, 85, 95-102. doi:10.4141/P04-090 [4] Dalal, R.C. (1989) Long-term effects of no-tillage, crop residue, and nitrogen application on properties of a Vert- sol. Soil Science Society of America Journal, 53 , 1511- 1515. doi:10.2136/sssaj1989.03615995005300050035x [5] Havlin, J.L., Kissel, D.E., Maddux, L.D. and Long, J.H. (1990) Crop rotation and tillage effects on soil organic carbon and nitrogen. Soil Science Society of America Journal, 54, 448-452. doi:10.2136/sssaj1990.03615995005400020026x Copyright © 2012 SciRes. OPEN ACCESS  S. S. Malhi et al. / Agricultural Sciences 3 (2012) 854-864 863 [6] Janzen, H.H., Campbell, C.A., Brandt, S.A., Lafond, G.P. and Townley-Smith, L. (1992) Light-fraction organic matter in soil from long term rotations. Soil Science Soci- ety of America Journal, 56, 1799-1806. doi:10.2136/sssaj1992.03615995005600060025x [7] Halvorson, A.D., Wienhold, B.J. and Black, A.L. (2002) Tillage, nitrogen and cropping system effects on soil car- bon sequestration. Soil Science Society of America Jour- nal, 66, 906-912. doi:10.2136/sssaj2002.0906 [8] Liang, B.C., McConkey, B.G., Schoenau, J.J., Curtin, D., Campbell, C.A., Moulin, A., Lafond, G.P., Brandt, S.A. and Wang, H. (2003) Effect of tillage and crop rotations on the light fraction organic carbon and carbon minerali- zation in Chernozemic soils of Saskatchewan. Canadian Journal of Soil Science, 83, 65-72. doi:10.4141/S01-083 [9] McConkey, B.G., Liang, B.C., Campbell, C.A., Curtin, D., Moulin, A., Brandt, S.A. and Lafond, G.P. (2003) Crop rotation and tillage impact on carbon sequestration in ca- nadian prairie soils. Soil and Tillage Research, 74, 81-90. doi:10.1016/S0167-1987(03)00121-1 [10] Malhi, S.S., Moulin, A.P., Johnston, A.M. and Kutcher, R.H. (2008) Short-term and long-term effects of tillage and crop rotation on some soil physical and biological properties in a Black Chernozem soil in northeastern Saskatchewan. Canadian Journal of Soil Science, 88, 273- 282. doi:10.4141/CJSS07062 [11] Malhi, S.S., Brandt, S.A. and Kutcher, H.R. (2011) Ef- fects of broad-leaf crops frequency and fungicide applica- tion in various crop rotations on seed yield, and accumu- lation of nitrate-N and extractable P in soil after eight years in a Dark Brown Chernozem in Saskatchewan. Communications in Soil Science and Plant Analysis, 42, 2795-2812. doi:10.1080/00103624.2011.605496 [12] Culley, J.L.B. (1993) Density and compressibility. In: M.R. Carter, Ed., Soil Sampling and Methods of Analysis, Lewis Publishers, Boca Raton, 529-549. [13] Technicon Industrial Systems (1977) Industrial/simulta- neous determination of nitrogen and/or phosphorus in BD acid digests. Industrial Method 334-74W/Bt. Technicon Industrial Systems, Tarrytown. [14] Izaurralde, R.C., Nyborg, M., Solberg, E.D., Janzen, H.H., Arshad, M.A., Malhi, S.S. and Molina-Ayala, M. (1997) Carbon storage in eroded soils after five years of recla- mation techniques. In: Lal, R., Kimble, J.M., Follett, R.F. and Stewart, B.A., Eds., Management of Carbon Seques- tration in Soil, Advances in Soil Sciences, CRC Press, Boca Raton, 369-385. [15] Technicon Industrial Systems (1973) Ammonium in water and waste water. Industrial Method No. 90-70W-B. Tech- nicon Industrial Systems, Tarrytown. [16] Technicon Industrial Systems (1973) Nitrate in water and waste water. Industrial Method No. 100-70W-B. Techni- con Industrial Systems, Tarrytown. [17] IPCC (Integovernmental Panel on Climate Change) (2006) N2O emissions from managed soils, and CO2 emissions from lime and urea application. Chapter 11. In: IPCC Guidelines for National Greenhouse Gas Inventories, Ag- riculture, Forestry and Other Land Use, Vol. 4, Institute for Global Environment Strategies, Hayama. [18] Lupwayi, N.Z., Clayton, G.W., O’Donovan, J.T., Harker, K.N., Turkington, T.K. and Soon, Y.K. (2007) Phosphorus release during decomposition of crop residues under conventional and zero tillage. Soil and Tillage Research, 95, 231-239. doi:10.1016/j.still.2007.01.007 [19] Malhi, S.S. and Lemke, R. (2007) Tillage, crop residue and N fertilizer effects on crop yield, nutrient uptake, soil quality and greenhouse gas emissions in the second 4-yr rotation cycle. Soil and Tillage Research, 96, 269-283. doi:10.1016/j.still.2007.06.011 [20] SAS Institute, Inc. (2004) SAS product documentation. Version 8, SAS Institute, Cary. http://support.sas.com/documentation/onlinedoc/index.ht ml [21] Malhi, S.S., Brandt, S.A., Lemke, R., Moulin, A.P. and Zentner, R.P. (2009) Effects of input level and crop diver- sity on soil nitrate-N, extractable P, aggregation, organic C and N, and N and P balance in the Canadian Prairie. Nutrient Cycling in Agroecosystems. doi:10.1007/s10705-008-9220-0 [22] Campbell, C.A., VandenBygaart, A.J., Grant, B., Zentner, R.P., McConkey, B.G., Lemke, R., Gregorich, E.G. and Fernandez,M. R. (2007) Quantifying carbon sequestration in a conventionally tilled crop rotation study in south- western Saskatchewan. Canadian Journal of Soil Science, 87, 23-38. doi:10.4141/S06-015 [23] Comeau, L. (2012) The influence of lentil, canola, pea and wheat on carbon and nitrogen dynamics in two Chernozemic soils. M.Sc. thesis, University of Saska- tchewan, Saskatoon. [24] Gregorich, E.G. and Janzen, H.H. (1995) Storage of soil carbon in the light fraction and macroorganic. In: Carter, M.R. and Stewart, B.A., Eds., Structure and Organic Matter Storage in Agricultural Soils. Advances in Soil Science, Lewis Publishers, CRC Press, Boca Raton, 167- 190 [25] Malhi, S.S., Nyborg, M., Goddard, T. and Puurveen, D. (2010) Long-term tillage, straw and N rate effects on quantity and quality of organic C and N in a Gray Luvisol soil. Nutrient Cycling in Agroecosystems. [26] Malhi, S.S., Nyborg, M., Goddard, T. and Puurveen, D. (2011b). Long-term tillage, straw management and N fer- tilization effects on quantity and quality of organic C and N in a Black Chernozem soil. Nutrient Cycling in Agro- ecosystems, 90, 227-241. doi:10.1007/s10705-011-9424-6 [27] Malhi, S.S., Nyborg, M., Solberg, E.D., McConkey, B., Dyck, M. and Puurveen, D. (2011) Long-term straw management and N fertilizer rate effects on quantity and quality of organic C and N, and some chemical properties in two contrasting soils in western Canada. Biology and Fertility of Soils, 47, 785-800. doi:10.1007/s00374-011-0587-8 [28] Guillard, K., Griffin, G.F., Allinson, D.W., Yamartino, W.R., Rafey, M.M. and Pietryzk, S.W. (1995) Nitrogen utilization of selected cropping systems in the US north- east. II. Soil profile nitrate distribution and accumulation. Agronomy Journal, 87, 199-207. doi:10.2134/agronj1995.00021962008700020011x [29] Malhi, S.S., Harapiak, J.T., Nyborg, M. and Flore, N.A. Copyright © 2012 SciRes. OPEN ACCESS  S. S. Malhi et al. / Agricultural Sciences 3 (2012) 854-864 Copyright © 2012 SciRes. OPEN ACCESS 864 (1991) Soil chemical properties after long-term N fertili- zation of bromegrass: Nitrogen rate. Communications in Soil Science and Plant Analysis, 22, 1447-1458. doi:10.1080/00103629109368505 [30] Malhi, S.S., Harapiak, J.T., Gill, K.S. and Flore, N. (2002) Long-term N rates and subsequent lime application ef- fects on macroelements concentration in soil and in bromegrass hay. Journal of Sustainable Agriculture, 21, 79-97. doi:10.1300/J064v21n01_07 [31] Zhang, W.L., Tian, Z.X., Zhang, N. and Li, X.O. (1996) Nitrate pollution of groundwater in northern China. Ag- riculture, Ecosystem and Environment, 59, 223-231. doi:10.1016/0167-8809(96)01052-3 [32] Yuan, X., Tong, Y., Yang, X., Li, X. and Zhang, F. (2000) Effect of organic manure on soil nitrate accumulation. Soil Environmental Science, 9, 197-200. [33] Heaney, D.J., Nyborg, M., Solberg, E.D., Malhi, S.S. and Ashworth, J. (1992) Overwinter nitrate loss and denitrifi- cation potential of cultivated soils in Alberta. Soil Biology and Biochemistry, 24, 877-884. doi:10.1016/0038-0717(92)90009-M [34] Nyborg, M., Laidlaw, J.W., Solberg, E.D. and Malhi, S.S. (1997) Denitrification and nitrous oxide emissions from soil during spring thaw in a Malmo loam, Alberta. Cana- dian Journal of Soil Science, 77, 53-160. doi:10.4141/S96-105
|