Vol.3, No.6, 799-805 (2012) Agricultural Sciences
http://dx.doi.org/10.4236/as.2012.36097
Relative effects of anaerobically-digested and
conventional liquid swine manure, and N fertilizer
on crop yield and greenhouse gas emissions
Reynald L. Lemke1*, Sukhdev S. Malhi2, Fernando Selles3, Mark Stumborg1
1Agriculture and Agri-Food Canada, Saskatoon, Canada; *Corresponding Author: reynald.lemke@agr.gc.ca
2Agriculture and Agri-Food Canada, Melfort, Canada
3Agriculture and Agri-Food Canada, Brandon, Canada
Received 23 June 2012; revised 29 July 2012; accepted 8 August 2012
ABSTRACT
Anaerobic digestion is a promising technology
that could provide an option for managing ani-
mal waste with reduced greenhouse gas emis-
sions. A three-year (2006-2008) field experiment
was conducted at Star City, Saskatchewan, Can-
ada, to compare the effects of land-applied an-
aerobically digested swine manure (ADSM), con-
ventionally treated swine manure (CTSM) and N
fertilizer on grain yield of barley, applied N use
efficiency (ANUE, kg·grain·kg1 of applied N·ha1),
ammonia (NH3) volatilization and nitrous oxide
(N2O) emissions. Treatments included spring
and autumn applications of CTSM and ADSM at
a 1× rate (10,000 and 7150 L·ha1, respectively)
applied every year, a 3× rate (30,000 and 21,450
L·ha1, respectively) applied once at the begin-
ning of the experiment, plus a treatment receiv-
ing commercial fertilizer (UAN at 60
kg·N·ha1·yr1) and a zero-N control. There was a
significant grain yield response of barley to ap-
plied N in all three years. The ANUE of ADSM or
CTSM applied once at the 3× rate were lower
than annual applications at the 1× rate (grain
yield by 595 kg·ha1 and NFUE by 6 kg·grain·kg1
of applied N·ha1). On average, agronomic per-
formance of ADSM was similar to CTSM. The
APNU of N fertilizer was greater than the 3× rate
but lower than the 1× rate of ADSM or CTSM.
Ammonia loss from ADSM was similar to CTSM,
except for much higher loss of NH3-N from
CTSM at the 3× rate applied in the autumn (8100
g·N·ha1) compared to the other treatments (1100 -
2600 g·N·ha1). The percentage of applied N lost
as N2O gas was generally higher for treatments
receiving CTSM (4.0%) compared to ADSM
(1.4%). In conclusion, the findings suggest that
ADSM is equal or slightly better than CTSM in
terms of agronomic performance, but has lower
environmental impact.
Keywords: Ammonia Volatilization; Anaerobic
Digestion; Barley Yield; Nitrogen Fertilizer Use
Efficiency; Nitrous Oxide; Swine Manure
1. INTRODUCTION
In 2009, over 28 million hogs were marketed by Ca-
nadian farmers, with nearly one-half of that industry lo-
cated in the prairie region. Approximately 90% of inten-
sive livestock operations in the prairie region store ma-
nure in liquid form in a holding tank or lagoon [1] until it
can be land-applied. Considerable amounts of methane
(CH4) are emitted to the atmosphere during storage [2]
and, while land application of liquid swine manure pro-
vides an effective source of nutrients for crop production
[3], high ammonia (NH3) volatilization rates can occur
following application [4-6]. In addition, soil-emitted ni-
trous oxide can also be stimulated [7]. Economically
feasible, environmentally friendly, and socially accept-
able management of animal wastes from intensive live-
stock operations is a key element for the future viability
of this industry.
Anaerobic digestion of liquid swine manure is a prom-
ising technology that could provide a cost effective op-
tion for reducing greenhouse gas (GHG) emissions from
liquid swine manure management by avoiding lagoon
storage and the associated CH4 emissions, and utilizing
the biogas produced during digestion to displace fossil-
fuels. Biogas digestion has the potential to directly or
indirectly influence NH3 volatilization and N2O emis-
sions. Anaerobic digestion decreases slurry viscosity and
volatile fatty acid content, while increasing slurry pH and
inorganic C content [8,9]. Reduced viscosity could de-
crease NH3 volatilization from pig slurry [4,10], whereas
increased pH and carbonate content could stimulate NH3
Copyright © 2012 SciRes. OPEN ACCESS
R. L. Lemke et al. / Agricultural Sciences 3 (2012) 799-805
800
volatilization [11,12]. Rubaek et al. [13] measured simi-
lar NH3 volatilization following application of undi-
gested and anaerobically digested pig slurry on grass-
lands in the United Kingdom. Similarly, Chantigny et al.
[14] found no differences between undigested and an-
aerobically digested pig slurry from a site in Quebec,
Canada. Conversely in another study also in Quebec,
Chantigny et al. [7] measured lower NH3 volatilization
losses from digested compared to raw swine manure.
Land-applied liquid animal manures generally pro-
motes soil-emitted nitrous oxide [7]. Anaerobic digestion
of manures results in more recalcitrant products which
may reduce the rate of microbial degradation and oxygen
consumption in the soil [15-17], leading to less anoxic
microsites which favor denitrifying activity. However,
the inorganic nitrogen (N) content of digested manures
tends to be higher, which could favour higher nitrifica-
tion rates, and coincident N2O production, and higher
nitrate production—which would increase denitrification
potential. The reported effects of manure treatments on
nitrous oxide emissions are variable. Some authors re-
ported similar N2O emissions from raw compared to an-
aerobically digested manure [18], others have reported
decreased emissions after anaerobic digestion [13,19,20].
Conversely, Chantigny et al. [7] reported increased emis-
sions from digested compared to raw liquid swine ma-
nure, when the manures were injected into the soil.
Many factors, including environmental, soil, and ap-
plication technique could potentially interact with ma-
nure type to influence NH3 volatilization and N2O emis-
sion following land-application of the material. To the
authors’ knowledge, there is very limited research infor-
mation internationally [13] comparing the agronomic and
environmental performance of land-applied raw versus
anaerobically digested swine manure, and no published
results for the Canadian prairie region. The objective of
this study was to compare agronomic performance and
gaseous N loss of land-applied anaerobically digested
swine manure (ADSM) to conventionally treated (raw)
swine manure (CTSM).
2. MATERIALS AND METHODS
A 3-year (2006-2008) field experiment was conducted
at Star City (Typic Haplocryalf) Saskatchewan, Canada.
Precipitation during the growing season (May, June, July
and August) from 2006 to 2008, and long-term (30-year)
average for the same period taken from the nearest En-
vironment Canada Meteorological Station (AAFC Mel-
fort), are presented in Table 1. Precipitation in the grow-
ing season was slightly below average in 2006, slightly
above average in 2007 and much below average (espe-
cially in May during seeding) in 2008. Eleven treatments
(Table 2) were arranged in a randomized complete block
Table 1. Monthly cumulative precipitation during 2006, 2007
and 2008 at Star City, Saskatchewan.
Precipitation (mm)
Year
May June July AugustTotal
2006 63 73 39 46 221
2007 71 119 47 40 277
2008 6 32 117 22 177
30-year mean46 66 76 57 245
Table 2. List of treatments and the corresponding total amount
of N applied during a three-year field study at Star City, Sas-
katchewan.
Time of
application Product appliedApplication rate Total N applied
(3-year cumulative)
aADSM-3x 21,450 L·ha1 214
ADSM-1x 7150 L·ha1 205
CTSM-3x 30,000 L·ha1 403
Autumn
CTSM-1x 10,000 L·ha1 360
ADSM-3x 21,450 L·ha1 257
ADSM-1x 7150 L·ha1 255
CTSM-3x 30,000 L·ha1 343
CTSM-1x 10,000 L·ha1 326
UAN 60 kg·N·ha1 180
Spring
Control 0 0
aADSM = Anaerobically digested swine manure, CTSM = Conventionally
treated swine manure, UAN = Urea ammonium nitrate (liquid).
design with four replicates. Liquid manures were applied
by the Prairie Agricultural Machinery Institute (PAMI)
using a customized applicator which injects the material
to a 10 cm depth. All plots were seeded to barley (Hor -
deum vulgare L.) in each of the three years (AC Rosser
in 2006 and 2007; Newdale in 2008). Seeding dates and
rates, weed control and harvesting operations followed
standard agronomic practice.
Conventionally treated swine manure was obtained
from a commercial 1200 sow farrow-to-finish barn. Ini-
tial batches of the ADSM were obtained from a full-scale
pilot mesophyllic digester situated by the commercial
barn. Later batches (autumn 2007 and spring 2008) were
obtained from a small-scale pilot mesophyllic digester
operated by PAMI. Operating conditions for the small-
scale digester were purposefully maintained to be com-
parable with the full scale version.
Previous research has indicated that application rates
of CTSM, providing between 75 and 150 kg·N·ha1, are
most effective for agronomic performance in this region
Copyright © 2012 SciRes. OPEN ACCESS
R. L. Lemke et al. / Agricultural Sciences 3 (2012) 799-805 801
[21]. Based on analysis of the CTSM to be applied in the
first autumn (2005) of the study, an application rate of
10,000 L·ha1, a typical rate used by producers in Sas-
katchewan, would provide about 100 kg·N·ha1. Simi-
larly, based on analysis of the ADSM supplied for appli-
cation in the fall of 2005, an application rate of 7150
L·ha1 provided a comparable amount of N. Treatments
receiving CTSM and ADSM at 3× this rate were also
applied. The “1×” rate was applied in each of the three
years while the “3×” rate was applied only once at the
beginning of the study. While not recommended, the lat-
ter treatment is a common practice employed by produc-
ers in this region. Rates were held constant on a volume
basis throughout the study. However, the N concentration
contained in both the CTSM and ADSM varied consid-
erably from application period to application period. The
cumulative N applied over the life of the study is pre-
sented in Tab l e 2 . To account for the differences in the
actual N applied, grain yields and NH3 and N2O losses
were normalized by expressing them as a ratio of N ap-
plied prior to statistical analysis. Applied N use effi-
ciency (ANUE) of barley grain yield for the various
treatments was calculated as: [(3-year total grain yield
ha1 for treatment) – (3-year total grain yield ha1 for
check)] ÷ (3-year total N applied to treatment).
Ammonia volatilization was measured using the “dou-
ble-sponge open-chamber” technique [22], with meas-
urements made on a set schedule for 2 - 3 weeks follow-
ing application of the treatments. Briefly, a white poly-
vinyl chloride tube 20 cm long and 15 cm in diameter
was inserted in the soil to a depth of 5 cm. A foam disk
impregnated with an acid solution is inserted inside the
chamber to absorb NH3 evolved from the soil. A second
disc closes the top of the chamber to allow for exchange
of air between the chamber and the surroundings while
scrubbing out atmospheric NH3. The discs were prepared
by washing twice with distilled water, twice with 0.001
M H2SO4 and twice with a glycerol-phosphoric acid so-
lution. The lower disc was placed 5 cm above the soil
surface, and the upper disc was placed 5 cm below the
top of the cylinder. White plastic shields, supported at the
corners by reinforcing bars, were placed 30 cm above the
tops of the cylinders to protect the discs from rainfall but
still allow air movement. Discs are exchanged at 1, 2, 4,
8 and 16 d after manure or fertilizer application, and
rinsed in 0.5 M KCl. The concentration of ammonium in
the extractant was determined with a Technicon Autoana-
lyzer [23]. Cumulative losses for each sampling period
were calculated by interpolating between data points and
integrating over time assuming a constant flux. Cumula-
tive losses were normalized by subtracting the NH3 lost
from the check (no N applied) treatment and dividing
that difference by the total N applied.
Nitrous oxide gas samples were collected using a
non-flow through non-steady state chamber method [24].
Sample collection protocols were similar to those de-
scribed by Rochette et al. [25]. Briefly, plexi-glass
frames (22 cm × 45.5 cm and 10 cm high) were perma-
nently installed in the soil between crop rows but cover-
ing manure or fertilizer injection bands, and lids were
sealed to the frames for the collection period. Gas sam-
ples were drawn from the chamber headspace at three
equally spaced time intervals, over a 60-minute period,
by fully filling disposable 20-mL polypropylene syringes
and transferring to pre-evacuated 13 mL exetainerTM
glass tubes for transport to the laboratory. The concentra-
tion of N2O in the sample containers was determined
using a gas chromatograph equipped with a 63Ni electron
capture detector (ECD). The calculated minimum de-
tectable difference for the system was <10 ppbv. Nitrous
oxide flux rate was calculated as the first derivative of
the second-order polynomial equation that best described
the concentration versus time relationship, with adjust-
ments for non-standard conditions of humidity, tempera-
ture and barometric pressure as described by Rochette
and Hutchinson [26]. Time zero values were estimated
using a method similar to that described by Anthony et al.
[27]. A series of ambient air samples was collected at
each sampling time. The mean of these samples was used
as the time zero concentration. Gas sampling was done at
least weekly, with increased frequency when expected
emission activity was high (after snow melt and applica-
tion of manure or fertilizer) and reduced frequency dur-
ing the latter part of the season when soil-water contents
were low. Seasonal estimates of N2O emissions were
calculated by interpolating between data points and inte-
grating over time assuming a constant flux [28]. The
percentage of applied N lost as N2O-N was calculated by
subtracting the N2O-N lost from the check (no N applied)
treatment and dividing that difference by the total N ap-
plied.
The data on various parameters were subjected to
analysis of variance (ANOVA) using procedures as out-
lined in SAS [29]. Significant (P 0.05) differences be-
tween treatments were determined using least significant
difference (LSD0.05).
3. RESULTS AND DISCUSSION
Rainfall was somewhat lower than the long-term mean
during the July-August period in 2006 and 2007 (Table
1), but above average precipitation during the early part
of the season (May-June) carried the crop through with
good grain yields in 2006 (Table 3), and modest grain
yields in 2007. Extremely low rainfall was received in
May and June, above average rainfall in July, followed
by very dry conditions through August of 2008. This
somewhat erratic rainfall pattern resulted in modest grain
Copyright © 2012 SciRes. OPEN ACCESS
R. L. Lemke et al. / Agricultural Sciences 3 (2012) 799-805
802
Table 3. Barley grain yields from various treatments for three
years at Star City, Saskatchewan.
2006 2007 2008 Mean
Time N source/rate
kg·ha1
aADSM-3x 6268 2213 3325 3935
ADSM-1x 5609 2792 3497 3966
CTSM-3x 5837 3256 3924 4339
Autumn
CTSM-1x 6375 4257 4699 5110
ADSM-3x 6250 2502 3258 4003
ADSM-1x 6202 3050 4504 4585
CTSM-3x 5946 2913 3653 4171
Spring
CTSM-1x 6437 3228 4725 4797
UAN 5387 2119 3725 3744
Control 3487 1241 2629 2452
LSD0.05 322***b 443*** 305*** 194***
aADSM = Anaerobically digested swine manure, CTSM = Conventionally
treated swine manure, UAN = Urea ammonium nitrate (liquid). *** bRefers to
significant at P < 0.001.
yields. Compared to the zero-N control, there was a sig-
nificant increase in grain yield of barley from application
of ADSM, CTSM and N fertilizer in all three years.
Similarly, other researchers have also found swine ma-
nure very effective in increasing crop yields in the years
of application [3,21]. In general, the 1× application rates
of ADSM or CTSM had the highest ANUE, the 3× ap-
plication rates the lowest, and UAN was intermediate
(Table 4). Further, ADSM tended to have similar or
slightly better ANUE compared to CTSM.
Ammonia volatilization losses were generally quite
low. Cumulative losses over all sampling periods ranged
from less than a kilogram to about 3 kg of N·ha1 (Table
5). The exception was the autumn applied CTSM-3x
treatment which lost over 8 kg·N·ha1. When these losses
were compared on a relative basis, (g NH3-N·kg1 ap-
plied NH4-N), the autumn applied CTSM-3x treatment
was significantly higher than all other treatments. In
contrast, Rubaek et al. [13] did not find any difference in
NH3 volatilization loss from undigested versus anaerobi-
cally digested pig slurry on grassland in UK. This dis-
crepancy between the two studies could be due to the
differences in soil-climatic conditions and crop type.
Nitrous oxide emissions responded to the treatments in
a relatively consistent fashion. Emissions were highest
from the CTSM treatments, with particularly high losses
in the first year of the study on the treatment receiving
CTSM at the 3× rate (Table 6). When emissions were
expressed as a percentage of applied N lost as N2O,
Table 4. Applied N use efficiency (ANUE) of barley grain
yield for varying rates and sources of applied N at Star City,
Saskatchewan.
Time N source/rate
bANUE
kg·grain·kg1 applied N·ha1
aADSM-3x 21bc
ADSM-1x 22b
CTSM-3x 14e
Autumn
CTSM-1x 22b
ADSM-3x 18d
ADSM-1x c25a
CTSM-3x 15e
Spring
CTSM-1x 22b
Spring UAN 19cd
aADSM = Anaerobically digested swine manure, CTSM = Conventionally
treated swine manure, UAN = Urea ammonium nitrate (liquid); b[(3-yr total
grain yield ha1 for treatment) – (3-year total grain yield ha1 for control)] ÷
(3-year total N applied ha1 to treatment); cThe values are significantly
different, when not followed by the same letter, based on LSD0.05.
Ta b le 5 . Estimated ammonia-N (NH3-N) loss over three sam-
pling periods from various treatments at Star City, Saskatche-
wan.
TimeN source/rateNet NH3-N loss
g·N·ha1
bNH3-N loss response
g NH3-N·kg1 applied N·ha1
aADSM-3x2600b c13ab
ADSM-1x1200b 6b
CTSM-3x8100a 24a
Autumn
CTSM-1x3000b 10b
ADSM-3x1100b 5b
ADSM-1x1700b 8b
CTSM-3x1700b 6b
Spring
CTSM-1x2500b 10ab
UAN 800b 6b
aADSM = Anaerobically digested swine manure, CTSM = Conventionally
treated swine manure, UAN = Urea ammonium nitrate (liquid); b[(Cumulative
NH3-N lost from treatment) – (Cumulative NH3-N lost from control)] ÷
[Cumulative NH4-N applied]; cThe values are significantly different, when
not followed by the same letter, based on LSD0.05.
losses were significantly higher from the treatments re-
ceiving CTSM at the 1× and 3× rate compared to treat-
ments receiving ADSM at the 1× rate and the UAN
treatment (Table 7). The treatment receiving ADSM at
the 3× rate was intermediate and significantly different
from CTSM at the 3× rate applied in the autumn. Lower
N2O emissions from digested compared to raw swine
manure was also reported by Chantigny et al. [7] and
Copyright © 2012 SciRes. OPEN ACCESS
R. L. Lemke et al. / Agricultural Sciences 3 (2012) 799-805 803
Table 6. Estimated annual and three-year cumulative N2O-N
loss from various treatments at Star City, Saskatchewan.
2006 2007 2008 3-year total
Time N source/rate kg·N·ha1
aADSM-3x 2.9b 1.1b 3.4ab 7.4b
ADSM-1x 1.3b 2.2b 2.0b 5.5b
CTSM-3x 16.3a 1.8b 3.4ab 21.5a
Autumn
CTSM-1x 3.6b 5.9a 7.3a 16.8a
ADSM-1x 1.7b 2.1 2.2b 6.0b
CTSM-1x 3.2b 5.4a 6.7a 15.3a
UAN 1.1b 1.1b 2.3b 4.5b
Spring
Control 0.8b 0.8b 1.6b 3.2b
aADSM = Anaerobically digested swine manure, CTSM = Conventionally
treated swine manure, UAN = Urea ammonium nitrate (liquid); cThe values
in each column separately are significantly different, when not followed by
the same letter, based on LSD0.05.
Table 7. Percentage of applied N lost as N2O-N over three
years at Star City, Saskatchewan.
Time N source/rate
N2O-N loss as a percentage
of applied N
%
ADSM-3x 2.0bc
ADSM-1x 1.1c
aCTSM-3x 4.5a
Autumn
CTSM-1x 3.8ab
ADSM-1x 1.1c
CTSM-1x 3.7ab Spring
UAN 0.7c
aADSM = Anaerobically digested swine manure, CTSM = Conventionally
treated swine manure, UAN = Urea ammonium nitrate (liquid); cThe values
are significantly different, when not followed by the same letter, based on
LSD0.05.
Vallejo et al. [20], and similar results have been reported
for digested cattle manure [13,19,30]. Nyberg et al. [31]
reported that some compounds present in anaerobically
digested manure may have a depressive effect on soil
ammonia oxidizers, thereby reducing the supply of sub-
strate for N2O production through nitrification and deni-
trification. Vallejo et al. [20] argued that because most
easily degradable C present in manure is decomposed
during anaerobic digestion, the C remaining in the di-
gested manure is more stable and, therefore, less likely to
stimulate denitrification and N2O production as com-
pared with the undigested manure.
4. CONCLUSION
There was a significant grain yield response of barley
to applied N in all three years. The ANUE of barley for
single applications of ADSM or CTSM at the 3× rate was
lower than three annual applications at the 1× rate, while
UAN was intermediate. The ANUE of ADSM and
CTSM applied in autumn was equal to spring when ap-
plied at 1× rate and, in general, agronomic performance
of ADSM was similar or better than CTSM. The APNU
of N fertilizer was greater than the 3× rate but lower than
the 1× rate of ADSM or CTSM. Ammonia losses for all
treatments were low (<1 kg·N·yr1) except for CTSM at
the 3× rate applied in the autumn (>81 kg·N·yr1). In
general, NH3 loss from ADSM was similar to CTSM,
except for CTSM at the 3× rate applied in the autumn.
The percentage of applied N lost as N2O was generally
higher for treatments receiving CTSM compared to
ADSM or UAN, while N2O losses from ADSM and
UAN were similar. In summary, the findings suggest that
ADSM is equal or better than CTSM in terms of agro-
nomic performance, and has a lower environmental im-
pact with regard to gaseous N loss.
5. ACKNOWLEDGEMENTS
We are grateful for the funding provided by the Environmental
Technologies Assessment for Agriculture (ETAA) program, the excel-
lent collaboration from the Prairie Agricultural Machinery Institute
(PAMI), for access to raw and digested material provided by Cudworth
Pork Investors Group Ltd. and Clear-Green Environmental Inc.
REFERENCES
[1] Koroluk, R., Culver, D., Lefebvre A. and McRae, T.
(2000) Management of farm nutrient and pesticides in-
puts. In: McRae, T., Smith, C.A.S. and Gregorich, L.J.,
Eds., Environmental Sustainability of Canadian Agricul-
ture: Report of the Agri-Environmental Indicator Project.
Agriculture and Agri-Food Canada, Ottawa.
[2] Laguë, C., Gaudet, É., Agnew J. and Fonstad, T.A. (2005)
Greenhouse gas emissions from liquid swine manure
storage facilities in Saskatchewan. Transactions of the
American Society of Agricultural Engineering, 48, 2289-
2296.
[3] Mooleki, S.P., Schoenau, J.J., Hultgreen, G., Wen, G. and
Charles, J.L. (2002) Effect of rate, frequency and method
of liquid swine manure application on soil nitrogen avai-
lability, crop performance and N use efficiency in east-
central Saskatchewan. Canadian Journal of Soil Science,
82, 457-467. doi:10.4141/S01-057
[4] Pain, B.F., Phillips, V.R., Clarkson, C.R. and Klarenbeek,
J.V. (1989) Loss of nitrogen through volatilization during
and following the application of pig or cattle slurry to
grassland. Journal of Science, Food and Agriculture, 47,
1-12. doi:10.1002/jsfa.2740470102
[5] Gordon, R., Jamieson, R., Rodd, V., Patterson, G. and
Harz, T. (2001) Effects of surface manure application
timing on ammonia volatilization. Canadian Journal of
Soil Science, 81, 525-533. doi:10.4141/S00-092
Copyright © 2012 SciRes. OPEN ACCESS
R. L. Lemke et al. / Agricultural Sciences 3 (2012) 799-805
804
[6] Rochette, P., Chantigny, M.H., Angers, D.A., Bertrand, N.
and Cote, D. (2001) Ammonia volatilization and soil ni-
trogen dynamics following fall application of pig slurry
on canola crop residues. Canadian Journal of Soil Sci-
ence, 81, 515-523. doi:10.4141/S00-044
[7] Chantigny, M.H., Angers, D.A., Rochette, P., Belanger, G.
and Masse, D. (2007) Gaseous nitrogen emissions and
forage nitrogen uptake on soils fertilized with raw and
treated swine manure. Journal of Environmental Quality,
36, 1864-1872. doi:10.2134/jeq2007.0083
[8] Kirchmann, H. and Lundvall. A. (1993) Relationship
between N immobilization and volatile fatty acids in soil
after application of pig and cattle slurry. Biology and Fer-
tility of Soils, 15, 161-164. doi:10.1007/BF00361605
[9] Sommer, S.G. and Husted, S. (1995) The chemical buffer
system in raw and digested animal slurry. Journal of Ag-
ricultural Science, 124, 45-53.
doi:10.1017/S0021859600071239
[10] Sommer, S.G. and Olesen. J.E. (1991) Effects of drymatter
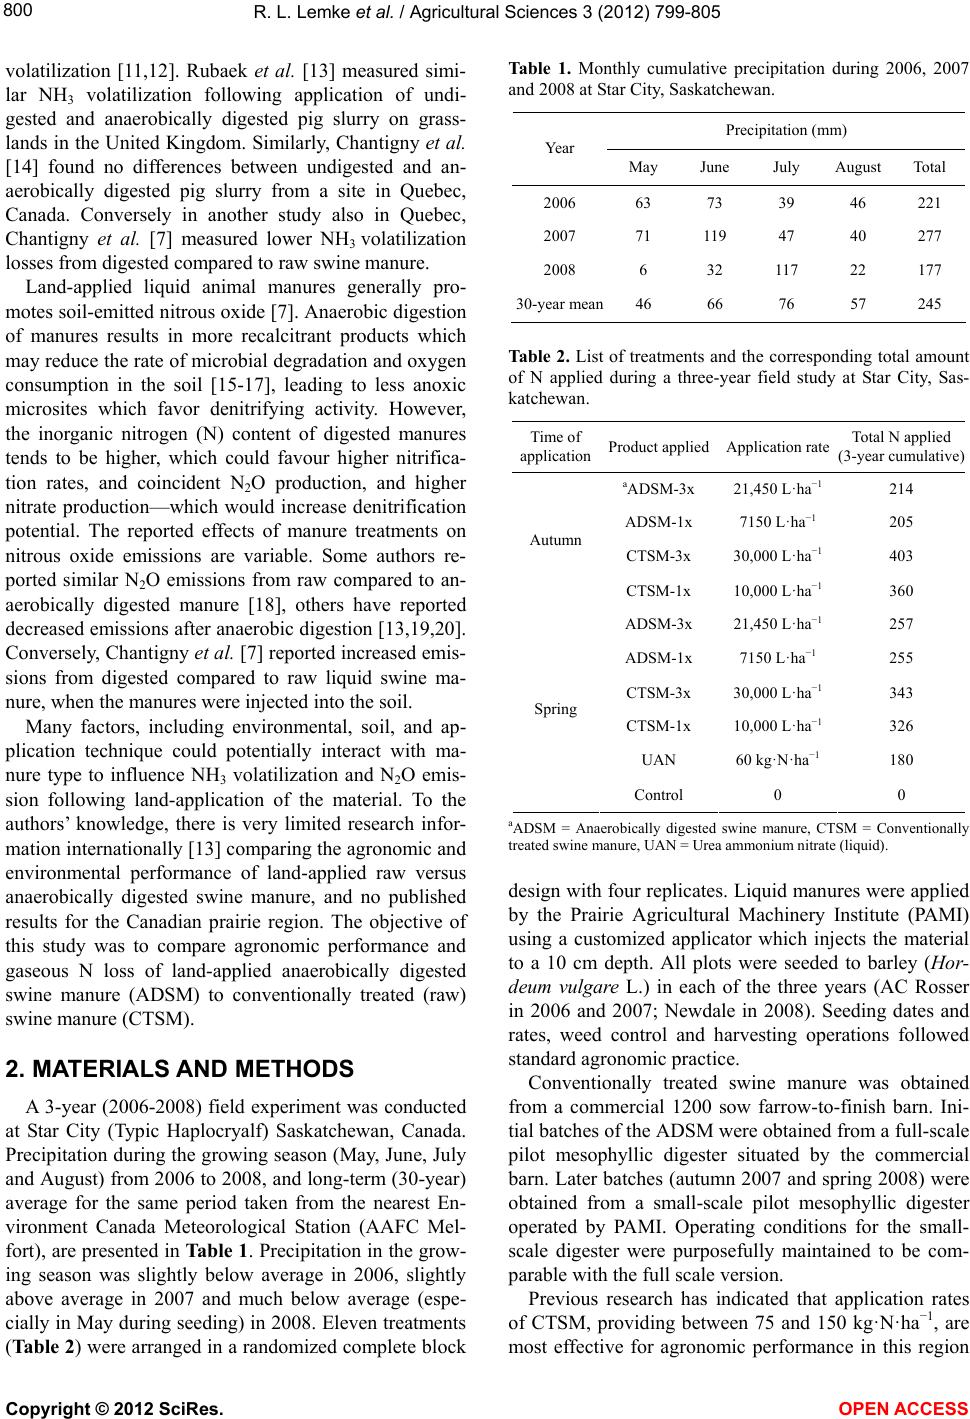
content and temperature on ammonia loss from surface-
applied cattle slurry. Journal of Environmental Quality,
20, 679-683.
doi:10.2134/jeq1991.00472425002000030029x
[11] Sommer, S.G. and Sherlock, R.R. (1996) pH and buffer
component dynamics in the surface layers of animal slur-
ries. Journal of Agricultural Science, 127, 109-116.
doi:10.1017/S002185960007742X
[12] Sommer, S.G. and Hutchings. N.J. (2001) Ammonia
emission from field applied manure and its reduction.
European Journal of Agronomy, 15, 1-15.
doi:10.1016/S1161-0301(01)00112-5
[13] Rubaek, G.H., Henriksen, K., Petersen, J., Rasmussen B.
and Sommer, S.G. (1996) Effects of application technique
and anaerobic digestion on gaseous nitrogen loss from
animal slurry applied to ryegrass (Lolium perenne). Jour-
nal of Agricultural Science, 126, 481-492.
doi:10.1017/S0021859600075572
[14] Chantigny, M.H., Rochette, P., Angers, D.A., Masse, D.
and Cote, D. (2004) Ammonia volatilization and selected
soil characteristics following application of anaerobically
digested pig slurry. Soil Science Society of America Jour-
nal, 68, 306-312.
[15] Kirchmann, H. and Bernal, M.P. (1997) Organic waste
treatment and C stabilization efficiency. Soil Biology and
Biochemistry, 29, 1747-1753.
doi:10.1016/S0038-0717(97)00065-5
[16] Clemens, J. and Huschka, A. (2001) The effect of biologi-
cal oxygen demand of cattle slurry and soil moisture on
nitrous oxide emissions. Nutrient Cycling in Agroecosys-
tems, 59, 193-198. doi:10.1023/A:1017562603343
[17] Oenema, O., Wrage, N., Velthof, G.L., Groenigen, J.W.,
Dolfing, J. and Kuikman, P.J. (2005) Trends in global ni-
trous oxide emissions from animal production systems.
Nutrient Cycling in Agroecosystems, 72, 51-65.
doi:10.1007/s10705-004-7354-2
[18] Wulf, S., Maeting, M. and Clemens, J. (2002) Application
technique and slurry co-fermentation effects on ammonia,
nitrous oxide, and methane emissions after spreading: II.
Greenhouse gas emissions. Journal of Environmental
Quality, 31, 1795-1801. doi:10.2134/jeq2002.1795
[19] Petersen, S.O. (1999) Nitrous oxide emissions from ma-
nure and inorganic fertilizers applied to spring barley.
Journal of Environmental Quality, 28, 1610-1618.
doi:10.2134/jeq1999.00472425002800050027x
[20] Vallejo, A., Skiba, U.M., Garcia-Torres, L., Arce, A.,
Lopez-Fernandez, S. and Sanchez-Martin, L. (2006) Ni-
trogen oxides emission from soils bearing a potato crop
as influenced by fertilization with treated pig slurries and
composts. Soil Biology and Biochemistry, 38, 2782-2793.
doi:10.1016/j.soilbio.2006.04.040
[21] Schoenau, J.J., Mooleki, P. and Qian, P. (2001) Maxi-
mizing the economic and environmental Benefit of Land
Application of Animal Manure. Report # 96000131, Sas-
katchewan Agriculture, Food and Rural Revitalization.
www.agriculture.gov.sk.ca/19960131.pdf
[22] Grant, C.A., Jia, S., Brown, K.R. and Bailey, L.D. (1996)
Volatile losses of NH3 from surface-applied urea and
urea-ammonium nitrate with and without the urease in-
hibitors NBPT or ammonium thiosulphate. Canadian
Journal of Soil Science, 76, 417-419.
doi:10.4141/cjss96-050
[23] Technicon Industrial Systems. (1977) Industrial/simulta-
neous determination of nitrogen and/or phosphorus in BD
acid digests. Industrial method No. 334-74W/Bt, Tarry-
town.
[24] Livingston, G.P. and Hutchinson, G.L. (1995) Enclosure-
based measurement of trace gas exchange: Applications
and sources of error. In: Matson, P.A. and Harris, R.C.,
Eds., Biogenic Trace Gases: Measuring Emissions from
Soil and Water, Blackwell Science Ltd., Oxford, 14-51.
[25] Rochette, P., Angers, D.A., Belanger, G., Chantigny, M.H.,
Prevost, D. and Levesque, G. (2004) Emissions of N2O
from alfalfa and soybean crops in eastern Canada. Soil
Science Society of America Journal, 68, 93-506.
doi:10.2136/sssaj2004.0493
[26] Rochette, P. and Hutchinson, G.L. (2005) Measuring soil
respiration using chamber techniques. In: Hatfield, J. and
Baker, J.M., Eds., Micrometeorological Studies of the Soil
Plant-Atmosphere Continuum, American Society of Agro-
nomy, Madison, 227-266.
[27] Anthony, W.H., Hutchinson, G.L. and Livingston, G.P.
(1995) Chamber measurement of soil-atmosphere gas ex-
change: Linear vs diffusion-based flux models. Soil Sci-
ence Society of America Journal, 59, 1308-1310.
doi:10.2136/sssaj1995.03615995005900050015x
[28] Lemke, R.L., Izaurralde, R.C., Nyborg, M. and Solberg,
E.D. (1999) Tillage and N-source influence soil-emitted
nitrous oxide in the Alberta Parkland region. Canadian
Journal of Soil Science, 79, 15-24.
doi:10.4141/S98-013
[29] SAS Institute, Inc. (2004) SAS product documentation.
Version 8. SAS Institute, Inc., Cary.
http://support.sas.com/documentation/onlinedoc/index.ht
ml
[30] Amon, B., Kryvoruchko, V., Amon, T. and Zechmeister-
Boltenstern, S. (2006) Methane, nitrous oxide and am-
Copyright © 2012 SciRes. OPEN ACCESS
R. L. Lemke et al. / Agricultural Sciences 3 (2012) 799-805
Copyright © 2012 SciRes. OPEN ACCESS
805
monia emissions during storage and after application of
dairy cattle slurry and infl uence of slurry treatment. Ag-
riculture, Ecosystem and Environment, 112, 153-162.
doi:10.1016/j.agee.2005.08.030
[31] Nyberg, K., Sundh, I., Johansson, M. and Schnürer, A.
(2004) Presence of potential ammonia oxidation (PAO)
inhibiting substances in anaerobic digestion residues. Ap-
plied Soil Ecology, 26, 107-112.
doi:10.1016/j.apsoil.2003.12.002