 Modern Economy, 2012, 3, 590-596 http://dx.doi.org/10.4236/me.2012.35078 Published Online September 2012 (http://www.SciRP.org/journal/me) Carbon Emission Allocation and Efficiency of EU Countries* Ming-Chung Chang Department of Banking and Finance, Kainan University, Taiwan, China Email: changmc@mail.knu.edu.tw Received June 2, 2012; revised July 1, 2012; accepted July 10, 2012 ABSTRACT Reduction of CO2 emissions is increasingly important among countries that want to protect the environment against global warming and climate change. This study examines two methods of CO2 emission reduction—CO2 emission allow- ance and an internationa l agree ment—by applying th e Zero Sum Gains Model an d th e Coop eration an d Alliance Model. We conclude that all DMUs reach 100% efficiency after trading on the CO2 emission allowance. The international agreement also improves the average efficiency of all DMUs, but its effect is inferior to the trad ing of the CO2 emission allowance. Keywords: CO2 Emission Allowance; International Agreement 1. Introduction An excess of greenhouse gas (GHG) emissions has caus ed the global climate change that is now threatening global ecosystems and impacting human existence. For the sus- tainability of earth and human life, restoring and safeg u a r d - ing the environment has received much attention recently. Carbon dioxide (CO2) is one GHG and controlling its emissions has been ardently regulated by the mechanisms of Clean Development Mechanism (CDM), Joint Imple- mentation (JI), and Emission Trading (ET) in the Kyoto Protocol. The European Union has established the European Union Emission Trading Sche me (EU ETS) by Directive 2003/87/EC for GHG emission allowanc e trading. The f i r s t phase of the scheme was from 1 January 2005 to 31 De- cember 2007 and set up CO2 emission regulation in the EU’s 25 member states. Under the scheme, energy-incen- tive industries and industries with a thermal capacity of 20 MW or more must hold a GHG emission permit to legally emit GHG. Each member state’s National Alloca- tion Plan (NPA) draws up an emission amount of GHG and submits the draft to the European Commission for approval. The feature of the EU ETS allowanc e in the first phase includes a grandfathering principle, a benchmarking prin- ciple, and an auctioning principle. In the grandfathering principle, the member states obtain an emission allow- ance based on a post emission record. In the benchmark- ing principle, the EU ETS allocation rules consider the member states’ production technology and specific pro- duction inputs and outputs. The auctioning principle is for member states to bid on a CO2 emission allowance. Sijm et al. analyze and compare the advantages and dis- advantages among the three regulations for carbon credit allocation and conclude that the auctioning regulation is the best rule to fit economic efficiency [1]. The main objective of our paper is to propose two al- ternative CO2 emission allowance allocation models. We introduce the Zero Sum Gains Data Envelopment Analy- sis (ZSG-DEA) model and the Cooperation and Alliance (CA) model to reallocate the CO2 emission allowance. Both models are applied in our paper to estimate the performances of decision making units (DMUs) given the total amount of CO2 emission required by the European Commission. Based on the data provided by the Commu- nity Independent Transaction Log (CITL), the approved CO2 emission allowances are about 200 million tons from 2005 to 2007. The most seminal DEA model, popularly known as DEA CCR, is proposed by Charn es et al. [2]. It applies a non-parametric analysis method for evaluating the rela- tive efficiency of DMUs based on the proportion of in- puts and outputs. The DEA method has been applied in many various fields such as education, health care, and banking for improving and monitoring DMUs’ perform- ance. It is widely-known that an efficiency estimation is usually based on the assumptions that 1) Inputs need to *The author appreciates the part of financial support from National Science Council (NSC 100-2410- H -424-019-). C opyright © 2012 SciRes. ME  M.-C. CHANG 591 be minimized and outputs need to be maximized; and 2) Inputs and outputs are isotonic variables; which means that inputs and outputs are “good” or called desirable variables [3]. However, both desirable (good) and unde- sirable (bad) variables may be simultaneously present. The concept of an undesirable output has been already mentioned in the seminal work of Koopmans in that pol- lutants (bad) may be generated in an inefficient produc- tion process when the final products (good) are manu- factured [4]. The output of pollutants is undesirable and it is an anti-isotonic variab le. An undesirable output, which is an inefficient produc- tive result, should be minimized to improve performance. Scheel uses DEA models that include undesirable outputs to discuss issues surrounding environmental performance [5]. There are three approaches to treat the undesirable output variables in a DEA context: 1) Let the reciprocal of the undesirable output be the DEA output [5-7]; 2) Transform the undesirable output to be the negative num- bers and then use th em as the DEA input; [5,8]; 3 ) View the undesirable output as the input variable [9-11]. How- ever, w e must str ess th at the th ird appro ach is not app r o v e d by Seiford and Zhu since “if one treats the undesirable outputs as inputs, the resulting DEA model does not re- flect the true production process (S eiford and Zhu, 2002, p. 17)” [12]. Similarly, Färe and Grosskopf also point out some drawbacks when treating undesirable outputs as inputs [13]. Although the CO2 emission is an undesirable output, the CO2 emission allowance, which is the key role in our study, is an indispensible input factor in the regime of EU ETS whereby the amount of CO2 emission allowance is also limited by the European Commission. In this paper we propose the ZSG-DEA model to analyze the issue of CO2 emission allowance. Marcos et al. provide a theoretical framework of the ZSG-DEA model to analyze the performance of partici- pant countries in the Olympics in accordance with the number of medals they have won [14]. The ZSG-DEA model requires that the total number of medals to be won is constant. The ZSG-DEA model is also applied in the field of environmental economics. Sachs uses the ZSG- DEA model in an ecological economy that provides a limitation on pollutants’ emission [15]. Gomes and Lins use the ZSG-DEA model to consider CO2 emission trade in which CO2 emissions are viewed as an undesirable output [10]. In our paper we also apply the ZSG-DEA model and view the CO2 emission allowance as a desir- able input. Moreover, we propose examining the alloca- tion of CO2 emission allowance for the 25 member states in the EU. 2. Model Set-Up To formally present our calculation process, we consider a set with r DMUs. Each DMU uses t inputs to manufac- ture s outputs. We define k i as the amount of input k and i y 1, ,,1, ,,and1, ,,.kt jsigr as the amount of input j for DMU i, where 2.1. DEA CCR Model According to the classical DEA CCR model, a measure of the relative efficiency of DMU g is defined as the ratio of a weighted sum of its outputs to a weighted sum of its inputs. The optimal efficient value is obtained by treating weights as variables and by maximizing the efficiency ratio of DMU g subject to th e constraint that other D MUs’ efficiency ratio is larger than 1 given the same set of weights. The following model is the relative efficiency value of DMU g under input orientation: 11 11 max. .1,1,, ,0for,, ss gg jj jj jj g tt gg kk kk kk jk uy uy estir vx vx uv jk (1) where uj and vk are the weights of output and input, re- spectively. 2.2. ZSG-DEA Model In the regime of EU ETS, the CO2 emission allowance is viewed as “good” and as a limited input factor. We de- fine zi as the amount of CO2 emission allowance for DMU i, and 1i. Based on the framework of the DEA CCR model, the relative efficiency of DMU g un- der the input orientation is obtained from the ZSG-DEA model as follows: ri zz 11 11 max. .1,1,, 0for . ss gg jj jj jj g rr ii ii ig ig j uy uy estir zz zz uj (2a) The fractional model in Equation (2a) can be rewritten as a linear programming model by scaling the denomina- tor in the objective function to be 1. The linear program- ming model in the inpu t orientation is: 11 11 max. .=1 0,1,, 0for . sr gg i jj ji ig sr ii jj ji ig j euystzz uy zzir uj (2b) Copyright © 2012 SciRes. ME  M.-C. CHANG Copyright © 2012 SciRes. ME 592 =1,, 25;=1:ij3. A Reallocation of CO2 Emission Allowance in the EU for 25 member states in the EU is given 3.1. Data Description In the previous literature, Gomes and Lins use CO2 emis- sions as the input, while popu lation , energy con sumption , and gross domestic product (GDP) are used as outputs [10]. In order to follow the isotonicity in classical DEA models, we consider here the CO2 emission allowance as the input and the GDP as the output to reallocate the CO2 emission allowance for 25 member states in the EU. We refer to the 2007 data published by the CITL for the CO2 emission allowance (in ton3 of equivalent carbon) and the World Bank Database for GDP (in USD). 3.2. CO2 Emission Allowance Model: ZSG-DEA Model The reason for proposing the use of the ZSG-DEA model is to have an efficient allocation on the CO2 emission allowance while having all countries be on the efficiency frontier. By refining Equation (2b), the ZSG-DEA model 25 25 11 max ..=10,0. gg ii i ii ig ig ey sthz zyhzzh (3) From Equation (3), we obtain a DEA frontier that represents a fair allocation of the CO 2 emission allowa nc e in which all countries lie uniformly on the DEA frontier. In Table 1 there is only one efficient DMU in the D EA CCR model: Sweden allocates 1.099% to the total CO2 emission allowance. The average efficiency value for all DMUs is 36.3%. Consider the cas e between Denmark a nd Greece in that they have almost the same GDP, but the CO2 emission allowance of Denmark is less, which cre- ates a higher efficiency value relative to Greece. Simila rly, Poland and Sweden both have almost the same GDP, but the CO2 emission allowance of Sweden is far less than that of Poland, which causes a higher efficiency value relative to Sweden. Table 1. Data, DEA CCR efficiency, and optimal allocation by the ZSG-DEA model. Country Country Code GDP CO2 Emission Allowance DEA CCR Efficiency Optimal Reallocation on CO2 Emission Allowance ZSG-DEA Efficiency Trading and Adjustment Austria AUT 372,291,309,787 32,729,289 0.562 46,896,844 1.000 14,167,555 Belgium BEL 458,619,726,869 60,428,821 0.375 57,771,474 1.000 –2,657,347 Cyprus CYP 21,835,946,095 5,899,493 0.183 2,750,634 1.000 –3,148,859 Czech Republic CZE 174,214,9 43,907 96,919,971 0.089 21,945,533 1.000 –74,974,438 Denmark DNK 310,721,016,955 27,902,895 0.550 39,140,949 1.000 11,238,054 Estonia EST 21,383,914,641 21,343,525 0.049 2,693,692 1.000 –18,649,833 Finland FIN 245,952,167,831 44,620,371 0.272 30,982,137 1.000 –13,638,234 France† FRA 2,594,012,356,324 149,775,970 0.856 326,762,914 1.000 176,986,944 Germany† DEU 3,329,145,212,814 497,302,479 0.331 419,366,233 1.000 –77,936,246 Greece GRC 309,916,787,520 71,162,432 0.215 39,039,642 1.000 –32,122,790 Hungary HUN 138,757,191,935 30,236,166 0.227 17,478,985 1.000 –12,757,181 Iceland ISL 20,428,032,019 19,240,229 0.052 2,573,281 1.000 –16,666,948 Italy† ITA 2,116,201,719,593 203,255,077 0.514 266,573,996 1.000 63,318,919 Latvia LVA 28,765,687,042 4,035,018 0.352 3,623,560 1.000 –411,458 Lithuania LTU 39,103,973,051 10,318,307 0.187 4,925,855 1.000 –5,392,452 Luxembourg LUX 51,278,197,958 3,229,321 0.784 6,459,419 1.000 3,230,098 Malta MLT 7,547,856,389 3,048,394 0.122 950,789 1.000 –2097605 Netherlands NLD 778,311,557,844 86,476,714 0.445 98,042,460 1.000 11,565,746 Poland POL 425,321,393,718 237,542,720 0.088 53,576,945 1.000 –183,965,775 Portugal PRT 230,944,735,970 36,908,808 0.309 29,091,679 1.000 –7,817,129 Slovak Republic SVK 84,241,814,947 30,486,829 0.136 10,611,785 1.000 –19,875,044 Slovenia SVN 47,314,863,050 8,245,914 0.283 5,960,165 1.000 –2,285,749 Spain ESP 1,440,836,638,664 159,739,872 0.446 181,499,513 1.000 21,759,641 Sweden SWE 462,512,853,670 22,846,480 1.000 58,261,884 1.000 35,415,404 United Kingdom† GBR 2,799,040,362,405 215,875,184 0.640 352,589,910 1.000 136,714,726 Total 2,079,570,279 2,079,570,279 0 †EU state is in the G8. 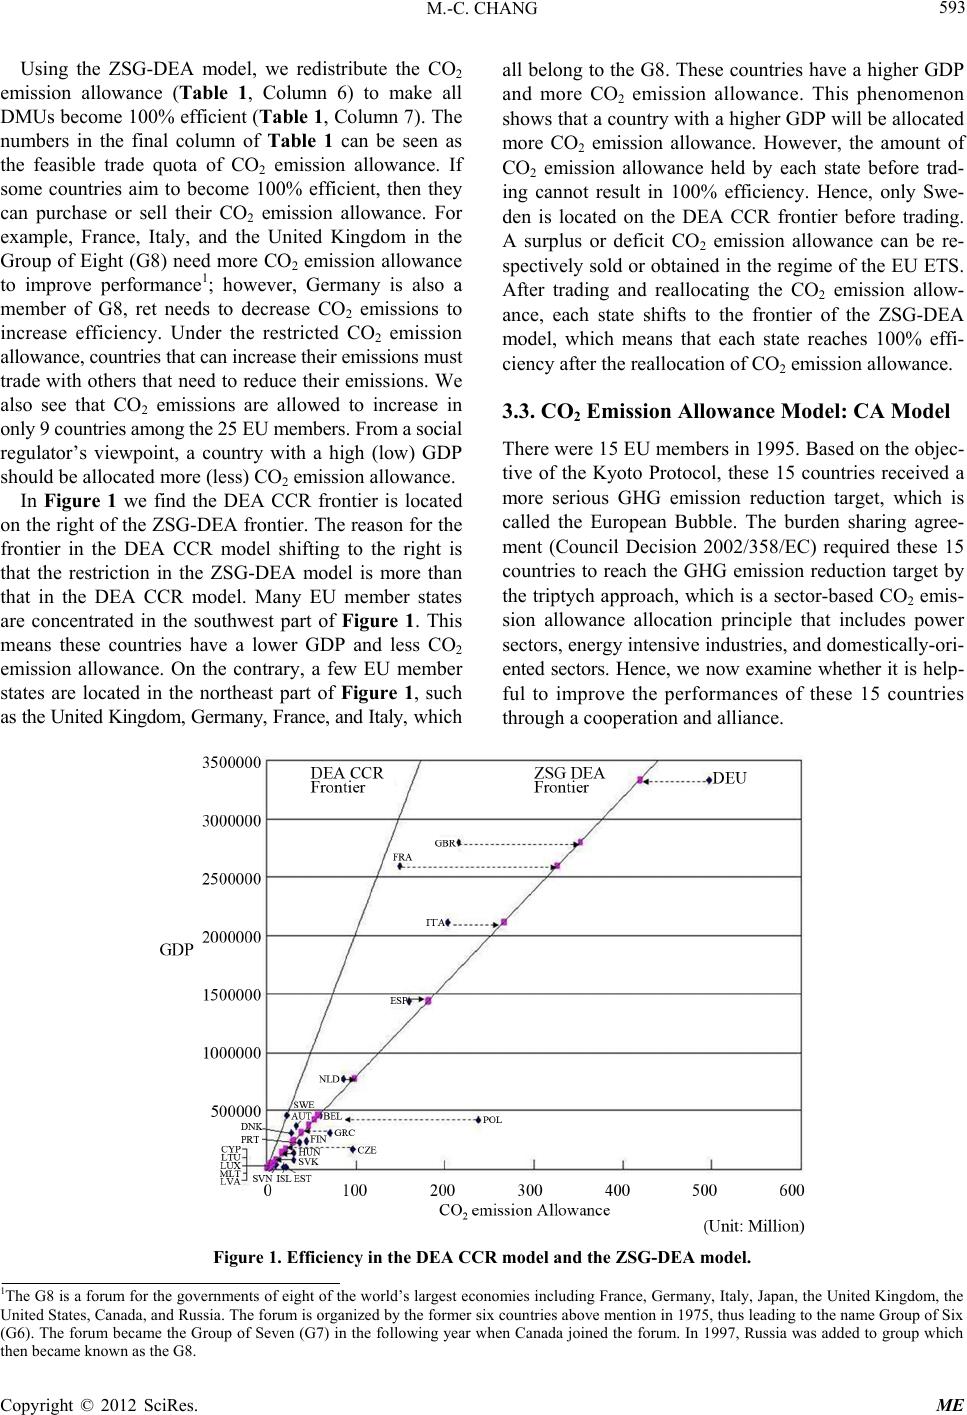 M.-C. CHANG 593 Using the ZSG-DEA model, we redistribute the CO2 emission allowance (Table 1, Column 6) to make all DMUs become 100% efficient (Table 1, Column 7). The numbers in the final column of Table 1 can be seen as the feasible trade quota of CO2 emission allowance. If some countries aim to become 100% efficient, then they can purchase or sell their CO2 emission allowance. For example, France, Italy, and the United Kingdom in the Group of Eight (G8) need more CO2 emission allowance to improve performance1; however, Germany is also a member of G8, ret needs to decrease CO2 emissions to increase efficiency. Under the restricted CO2 emission allowance, countries that can increase thei r emissions must trade with others that need to reduce their emissions. We also see that CO2 emissions are allowed to increase in only 9 countries among t he 25 EU members. From a social regulator’s viewpoint, a country with a high (low) GDP should be allocated more (less) CO2 emission allowance. In Figure 1 we find the DEA CCR frontier is located on the right of the ZSG-DEA frontier. The reason for the frontier in the DEA CCR model shifting to the right is that the restriction in the ZSG-DEA model is more than that in the DEA CCR model. Many EU member states are concentrated in the southwest part of Figure 1. This means these countries have a lower GDP and less CO2 emission allowance. On the contrary, a few EU member states are located in the northeast part of Figure 1, such as the United Kingdom, Germany, Fr ance, and Italy, w h i c h all belong to the G8. These countries have a higher GDP and more CO2 emission allowance. This phenomenon shows that a country with a higher GDP will be allocated more CO2 emission allowance. However, the amount of CO2 emission allowance held by each state before trad- ing cannot result in 100% efficiency. Hence, only Swe- den is located on the DEA CCR frontier before trading. A surplus or deficit CO2 emission allowance can be re- spectively sold or obtained in the reg ime of the EU ETS. After trading and reallocating the CO2 emission allow- ance, each state shifts to the frontier of the ZSG-DEA model, which means that each state reaches 100% effi- ciency after the reallocation of CO2 emission allowance. 3.3. CO2 Emission Allowance Model: CA Model There were 15 EU members in 1995. Based on the objec- tive of the Kyoto Protocol, these 15 countries received a more serious GHG emission reduction target, which is called the European Bubble. The burden sharing agree- ment (Council Decision 2002/358/EC) required these 15 countries to reach the GHG emission reduction target by the triptych approach , which is a sector-based CO2 emis- sion allowance allocation principle that includes power sectors, energy intensiv e ind ustries, and domestically-o ri- ented sectors. Hence, we now examine whether it is help- ful to improve the performances of these 15 countries through a cooperation and alliance. Figure 1. Efficiency in the DEA CCR model and the ZSG-DEA model. 1The G8 is a forum for the governments of eight of the world’s largest economies including France, Germany, Italy, Japan, the United Kingdom, the United States, Canada, and Russia. The forum is organized by the former six countries above mention in1975, thus leading to the name Group of Six (G6). The forum became the Group of Seven (G7) in the following year when Canada joined the forum. In 1997, Russia was added to group which then became known as the G8. Copyright © 2012 SciRes. ME 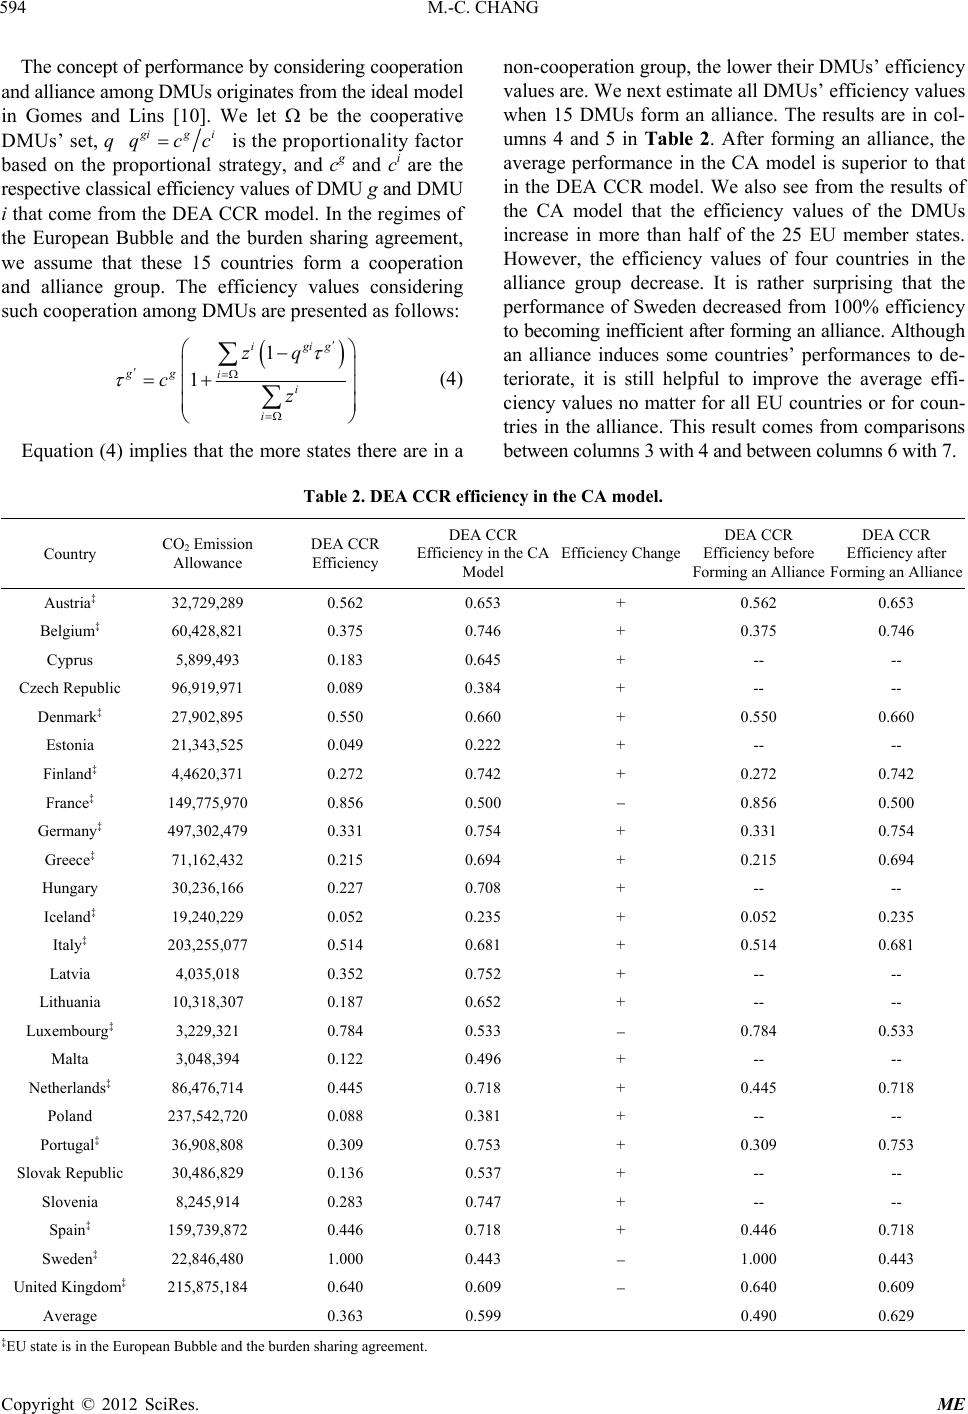 M.-C. CHANG 594 The concept of performance by considering cooperation and alliance among DMUs origi nates from the ideal model in Gomes and Lins [10]. We let be the cooperative DMUs’ set, q igi qcc is the proportionality factor based on the proportional strategy, and cg and ci are the respective classical efficiency values of DMU g and DMU i tha t come f rom th e DE A CCR mod el. In the regime s of the European Bubble and the burden sharing agreement, we assume that these 15 countries form a cooperation and alliance group. The efficiency values considering such cooperation among DMUs are presented as follows: 1 igig i i zq z 1 gg i c (4) Equation (4) implies that the more states there are in a non-cooperation group, the lower their DMUs’ efficiency values are. We next estimate all DMUs’ efficiency values when 15 DMUs form an alliance. The results are in col- umns 4 and 5 in Table 2. After forming an alliance, the average performance in the CA model is superior to that in the DEA CCR model. We also see from the results of the CA model that the efficiency values of the DMUs increase in more than half of the 25 EU member states. However, the efficiency values of four countries in the alliance group decrease. It is rather surprising that the performance of Sweden decreased from 100% efficiency to becoming inefficient after forming an alliance. Altho ugh an alliance induces some countries’ performances to de- teriorate, it is still helpful to improve the average effi- ciency values no matter for all EU countries or for coun- tries in the alliance. This result comes from comparisons between columns 3 with 4 and between columns 6 with 7. Table 2. DEA CCR efficiency in the CA model. Country CO2 Emission Allowance DEA CCR Efficiency DEA CCR Efficiency in the CA Model Efficiency ChangeDEA CCR Efficiency before Forming an Alliance DEA CCR Efficiency after Forming an Alliance Austria‡ 32,729,289 0.562 0.653 + 0.562 0.653 Belgium‡ 60,428,821 0.375 0.746 + 0.375 0.746 Cyprus 5,899,493 0.183 0.645 + -- -- Czech Republic 96,919,971 0.089 0.384 + -- -- Denmark‡ 27,902,895 0.550 0.660 + 0.550 0.660 Estonia 21,343,525 0.049 0.222 + -- -- Finland‡ 4,4620,371 0.272 0.742 + 0.272 0.742 France‡ 149,775,970 0.856 0.500 0.856 0.500 Germany‡ 497,302,479 0.331 0.754 + 0.331 0.754 Greece‡ 71,162,432 0.215 0.694 + 0.215 0.694 Hungary 30,236,166 0.227 0.708 + -- -- Iceland‡ 19,240,229 0.052 0.235 + 0.052 0.235 Italy‡ 203,255,077 0.514 0.681 + 0.514 0.681 Latvia 4,035,018 0.352 0.752 + -- -- Lithuania 10,318,307 0.187 0.652 + -- -- Luxembourg‡ 3,229,321 0.784 0.533 0.784 0.533 Malta 3,048,394 0.122 0.496 + -- -- Netherlands‡ 86,476,714 0.445 0.718 + 0.445 0.718 Poland 237,542,720 0.088 0.381 + -- -- Portugal‡ 36,908,808 0.309 0.753 + 0.309 0.753 Slovak Republic 30,486,829 0.136 0.537 + - - -- Slovenia 8,245,914 0.283 0.747 + -- -- Spain‡ 159,739,872 0.446 0.718 + 0.446 0.718 Sweden‡ 22,846,480 1.000 0.443 1.000 0.443 United Kingdom‡ 215,875,184 0.640 0.609 0.640 0.609 Average 0.363 0.599 0.490 0.629 ‡EU state is in the European Bubble and the burden sharing agreement. Copyright © 2012 SciRes. ME  M.-C. CHANG 595 3.4. Market-Based Tool and Command-and-Control Regulation In previous subsection, we introduce the concept of CO2 emission allowance reallocation. Surplus or deficit allow- ances can be respectively sold or purchased based on the rule of the EU ETS, which requires a cap-and-trade pro- gram. The EU ETS regime makes CO2 emission allow- ance a tradable commodity. Thus, CO2 emission allow- ance is viewed as a market-based tool for reducing CO2 emissions. The previous subsection introduces coopera- tion and alliance among countries based on some interna- tional agreements in which the member states have to strictly comply to emission standards or implement par- ticular technologies. Thus, cooperation and alliance is viewed as a command-and-control type regulation. We now examine the effect of an environmental policy between the tradable allowance and the alliance among countries. By Figure 1, we have represented that the ef- ficiencies of all DMUs can reach 100% through trading of CO2 emission allowance. Although cooperation and alliance also improves the average efficiency values of all DMUs and the DMUs in the alliance, from Table 2 it cannot make the efficiency of all D MUs reach 100%. Thus, we conclude that the environmental effect of a market- based tool is superior to that of command-and-control regulation. 4. Conclusions Environmental issues are not only becoming more and more important, but should also not be neglected, becaus e many countries are conscious about global warming re- sulting from an increase in CO2 emissions. Both environ- mental researchers and social regulators have been using DEA to understand and solve the problem of global wa rm- ing and climate change. The EU has adopted both the CO2 mission allowance and an international agreement as two methods of CO2 emissions’ reduction. In the EU ETS regime that requires a cap-and-trade program, surplus or deficit CO2 emission allowances can be respectively sold or purchased in a carbon market. Under the international agreement, some EU member states have formed a cooperation and alli- ance group, such as the European Bubble, to decrease CO2 emissions. Both of their aims are to reduce CO2 emissions and to prevent the global warming and climate change. We employ the ZSG-DEA model and the CA model to estimate the environmental effects of CO 2 emis- sion allowance and the international agreement, respec- tively. The result of this paper shows that the efficiencies of all DMUs can reach 100% after CO2 emission allow- ance reallocation by trading. Conversely, the internation al agreement only improves the average efficiency of all DMUs, but cannot make the efficiencies of all DMUs reach 100%. Thus, the environmental effect of CO2 emis- sion allowance is superior to that of the international agreement. We lastly suggest a future improvement that con siders a restricted undesirable output, such as the amount of CO2 emissions regulated by the social planner. One should note that how to model an undesirable output in a DEA contex t is presented in Dyckhoff and Allen as a reference [3]. REFERENCES [1] J. P. M. Sijm, M. M. Beck, M. G. J. de n Elzen and R. A. van den Wijnggarrt, “Options for Post-2012 EU Burden Sharing and EU ETS Allocation,” Netherlands Environ- mental Assessment Agency, Bilthoven, 2007. [2] A. Charnes, W. W. Cooper and E. Rhodes, “Measuring the Efficiency of Decision-Making Units,” European Jou r- nal of Operational Research Vol. 2, No. 6, 1978, pp. 429- 444. doi:10.1016/0377-2217(78)90138-8 [3] H. Dyckhoff and K. Allen, “Measuring Ecological Effi- ciency with Data Envelopment Analysis (DEA),” Euro- pean Journal of Operational Research, Vol. 132, No. 2, 2001, pp. 312-325. doi:10.1016/S0377-2217(00)00154-5 [4] T. C. Koopmans, “An Analysis of Production as an Effi- cient Combination of Activities,” In: T. C. Koopmans, Ed., Activity Analysis of Production and Allocation, Cowles Commission for Research in Economics, Wiley, New York, Monograph No. 13, 1951. [5] H. Scheel, “Undesirable Outputs in Efficiency Evalua- tions,” Journal of Operational Research, Vol. 132, No. 2, 2001, pp. 400-410. doi:10.1016/S0377-2217(00)00160-0 [6] B. Golany and Y. Roll, “An Application Procedure for DEA,” Omega the International Journal of Management Science, Vol. 17, No. 3, 1989, pp. 237-250. doi:10.1016/0305-0483(89)90029-7 [7] C. A. K. Lovell, J. T. Pastor and J. A. Turner, “Measuring Macroeconomic Performance in the OECD: A Compari- son of European and Non-European Countries,” Euro- pean Journal of Operational Research, Vol. 87, No. 3, 1995, pp. 507-518. doi:10.1016/0377-2217(95)00226-X [8] S. Rheinhard, C. A. K. Lovell and G. Thijssen, “Econo- metric Estimation of Technical and Environmental Effi- ciency: An Application to Dutch Dairy Farms,” American Journal of Agricultural Economics, Vol. 81, No. 1, 1999, pp. 44-60. doi:10.2307/1244449 [9] J. Sarkis and J. J. Cordeiro, “An Empirical Evaluation of Environmental Efficiencies and Firm Performance: Pollu- tion Prevention versus End-of-pipe Practice,” European Journal of Operational Research, Vol. 135, No. 1, 2001, pp. 102-113. doi:10.1016/S0377-2217(00)00306-4 [10] E. G. Gomes and M. E. P. Lins, “Modelling Undesirable Outputs with Zero Sum Gains Data Envelopment Analy- sis Models,” Journal of the Operational Research Society, Vol. 59, No. 5, 2008, pp. 616-623. doi:10.1057/palgrave.jors.2602384 [11] M. Coli, E. Nissi and A. Rapposelli, “Monitoring Envi- ronmental Efficiency: An Application to Italian Provin- Copyright © 2012 SciRes. ME  M.-C. CHANG 596 ces,” Environmental Modelling & Software, Vol. 26, No. 1, 2011, pp. 38-43. doi:10.1016/j.envsoft.2010.07.004 [12] L. M. Seiford and J. Zhu, “Modeling Undesirable Factors in Efficiency Evaluation,” European Journal of Opera- tional Research, Vol. 142, No. 1, 2002, pp. 16-20. doi:10.1016/S0377-2217(01)00293-4 [13] R. Färe and S. Grosskopf, “Nonparametric Productivity Analysis with Undesirable Outputs: Comment,” Ameri- can Journal of Agricultural Economics, Vol. 85, No. 4, 2003, pp. 1070-1074. doi:10.1111/1467-8276.00510 [14] P. Marcos, E. Lins, E. G. Gomes, J. C. C. B. Soares de Mello and A. J. R. Soares de Mello, “Olympic Ranking Based on A Zero Sum Gains DEA Model,” European Journal of Operational Research, Vol. 148, No. 2, 2003, pp. 312-322. doi:10.1016/S0377-2217(02)00687-2 [15] I. Sachs, “Understanding Development: People, Markets & the State in Mixed Economies,” Oxford University Press, Oxford, 2000. Copyright © 2012 SciRes. ME
|