Modern Economy, 2012, 3, 553-556
http://dx.doi.org/10.4236/me.2012.35072 Published Online September 2012 (http://www.SciRP.org/journal/me)
Export Comparative Advantage Analysis of Iranian Hen
Egg by RCA & RSCA and RC Criteria
Farhad Mirzaei1*, Syed Mostafa Mostafavi2, Saeed Yazdani3
1Department of Animal Production and Management, Animal Sciences Research Institute of Iran, Karaj, Iran
2Iran Branch, World’s Poultry Science Association, Tehran, Iran
3Department of Agricultural Economics, Faculty of Agriculture, University of Tehran, Karaj, Iran
Email: *farmir2003203@yahoo.com
Received May 8, 2012; revised June 10, 2012; accepted June 18, 2012
ABSTRACT
The potential impact of a liberalization of global trade on developing nations is a controversial subject. The liberaliza-
tion of global agricultural trade, in particular, has been the focus of the debate for many years now and is part of the
current WTO negotiations. Trade policies are believed to have influenced a country’s comparative advantage. Com-
parative advantage as a concept for evaluating the patterns of trade, is widely accepted and often used in theoretical and
policy discussions. Livestock and livestock products, in the global trade, account for about one sixth, by value, of all
agricultural trade. Iran is the one of main producers of hen egg in the world (FAO, 2004). Higher-than-global cost
prices are the main disadvantage of the Iranian hen egg industry. The industry comprises of 700 million broiler day-old
chicks, 10 million b roiler br eeders and 50 million layer day-old chicks. He n egg is one of the Livestock products which
are part of the non-oil export in Iran and its export consistently faces with fluctuation during last years. This paper looks
at the performance of hen egg export and examines the comparative advantages indices like: revealed comparative ad-
vantage (RCA), revealed symmetric comparative ad vantage (RSCA) and (revealed competitiv e advantage (RC) for Iran
and world main producers over the period 1990-2005. The source of data from 1990-2005 are supplied by FAO (2006).
The changes in Iran’s export structure were compared with main producers ones. The results of the research showed,
the trade and production policies and economic behavior of producers and exporters have been in such a way that they
could not show a appropriate and timely response of world, also the revealed instabilities in the trends of RCA, RSCA
and RC indices during the study period led to th e conclusion that there is no well defined strategy and plan for utiliza-
tion of low price production factors, effectiveness human power, knowledge of bargaining power and target markets.
The objective of this paper is to try to identify: 1) The export comparative advantage of Iranian hen egg; 2) Its changing
during the time; 3) The comparative adv antage of Iranian hen eg g in competition with other coun tries which are famous
in trade and production of hen egg.
Keywords: Revealed Comparative Advantage; Hen Egg; Export; Trade; Iran
1. Introduction
Even agriculture in 21st century has been currently at the
forefront of the debate over the globalization, it is more
competitive than in the past. The agreement under the au s-
pices of World Trade Organization (WTO) would allow
all nations to focus on the benefits from realizing com-
parative and competitive advantage in the international
economy and increasing competition would force res o u rc e s
to be allocated more efficiently. The potential impact of
liberalization of global trade on developing nations is a
controversial subject. The liberalization of global agricul-
tural trade, in particular, has been the focus of the d ebate
for many years now and is part of the current WTO ne-
gotiations. Trade policies are believed to have influenced
a country’s comparative advantage, so as a concept for
evaluating the patterns of trade, is widely accepted and
often used in theoretical and policy discussions. Li ve sto ck
and livestock products, in the global trade, account for
about one sixth, by value, of all agricultural trade. There
is 5500 millions laying hen in the world and 56 millions
in Iran (7th in the world). Also, Iran is 1st Hen egg pro-
ducer in the Middle East, 6th in the Asia and 16th in the
world, so Ir an is the on e of main p roducer s of Hen eg g in
the world [1]. Higher global cost prices are the main dis-
advantage of the Iranian egg industry. Th e industry com-
prises of 700 million broiler day-old chicks, 10 million
broiler breeders and 50 million layer day-old chicks. Hen
egg is one of the Livestock products which are part of the
non-oil export in Iran and its export consistently faces
with fluctuation during last years [2]. The objective of
*Corresponding a uthor.
C
opyright © 2012 SciRes. ME
F. MIRZAEI ET AL.
554
this paper is to try to iden tify: 1) The export comparative
advantage of Iranian hen egg; 2) Its changing during the
time; 3) The comparative advantage of Iranian hen egg in
competition with other countries which are famous in
trade and production of hen egg.
2. Material and Methods
This paper looks at the performance of hen egg export
and examines the comparative advantages indices like:
RCA, RSCA and RC for Iran and world main producers
over the period 1990-2005. The source of data from 19 90-
2005 are supplied by FAO in 2006. We used from RCA
method as follows:
2.1.

RCA =XijXtjXinXtn
 
The concept of revealed comparative advantage (RCA) is
grounded on conventional trade theory. The original RCA
index is formulated by Balassa [3], can be written as:
Where X represen ts exports value (1000$), i is a countr y
(Iran), j is a commodity (hen eggs), t is a set of com-
modities (agricultural produ cts) and n is a set of countries
(world), RCA is based on observed trade patterns, it
measures a country’s export of a commodity in relation
to its total exports and to the corresponding export per-
formance of a set of countries. If RCA >1, then a com-
parative advantage is revealed. Many researchers have
attempted to refin e revealed comparative advantage [4-7].
A problem with the Balassa index is that its value is
asymmetric; it varies from one to infinity for products in
which a country has a revealed comparative advantage,
but only from zero to one for commodities with a com-
parative disadvantage. Dalum et al. [8] proposed a revealed
symmetric comparative advantage (RSCA) index to alle-
viate the skewness problem as follows:
2.2.

RSCA=RCA-1RCA+1
The RSCA ranges is from minus one to plus one and
avoids the problem of zero val ues. we focused on hen eggs
and agricultural sectors and investig ate th e stability in th e
pattern of the RCA indices for Iran. Also, using market
share as a measure of competitiveness, indicators of com-
petitiveness can be developed. These indicators are ex post
measures based on past performances. Vollrath [7] devel-
oped a comprehensive index called revealed competitive
advantage (RC). This index includes imports (M) as well
as exports (X). Avoids the problem of double counting
and permits intra-industry trade. The revealed compete-
tive advantage ind ex is written as:



in Xtn
Min Mtn
2.3.RC =XijXtjX
-Mij Mtj
The revealed competitive advantage index as a measure
of competitiveness shows how well a country’s particular
economic sector competes abroad and at home. A posi-
tive RC measure demonstrates that country i has a com-
petitive edge in producing and trading commodity j.
3. Results and Discussion
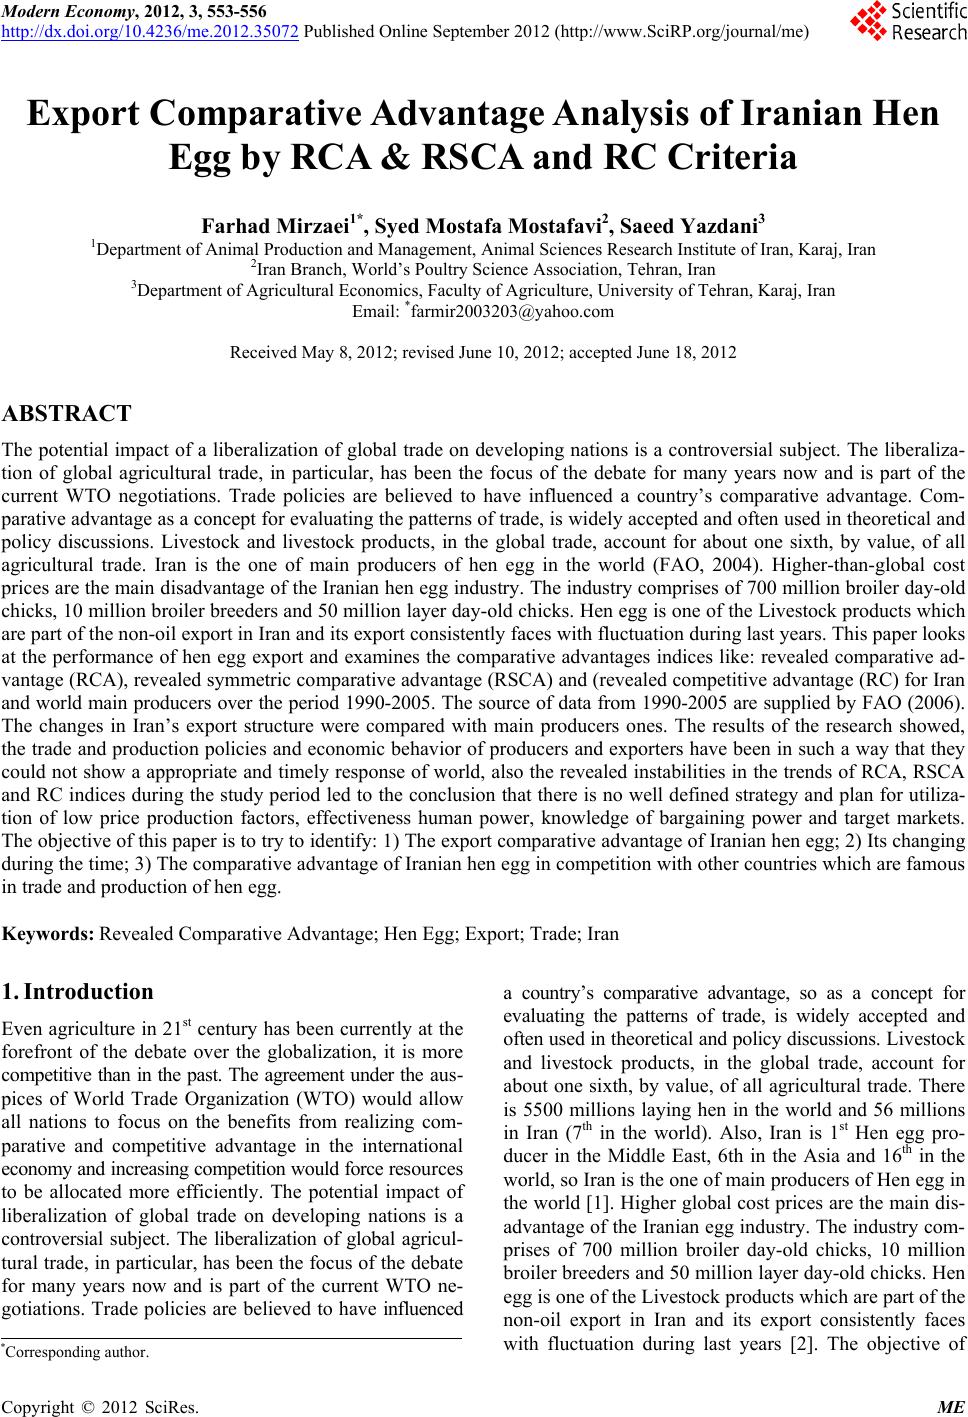
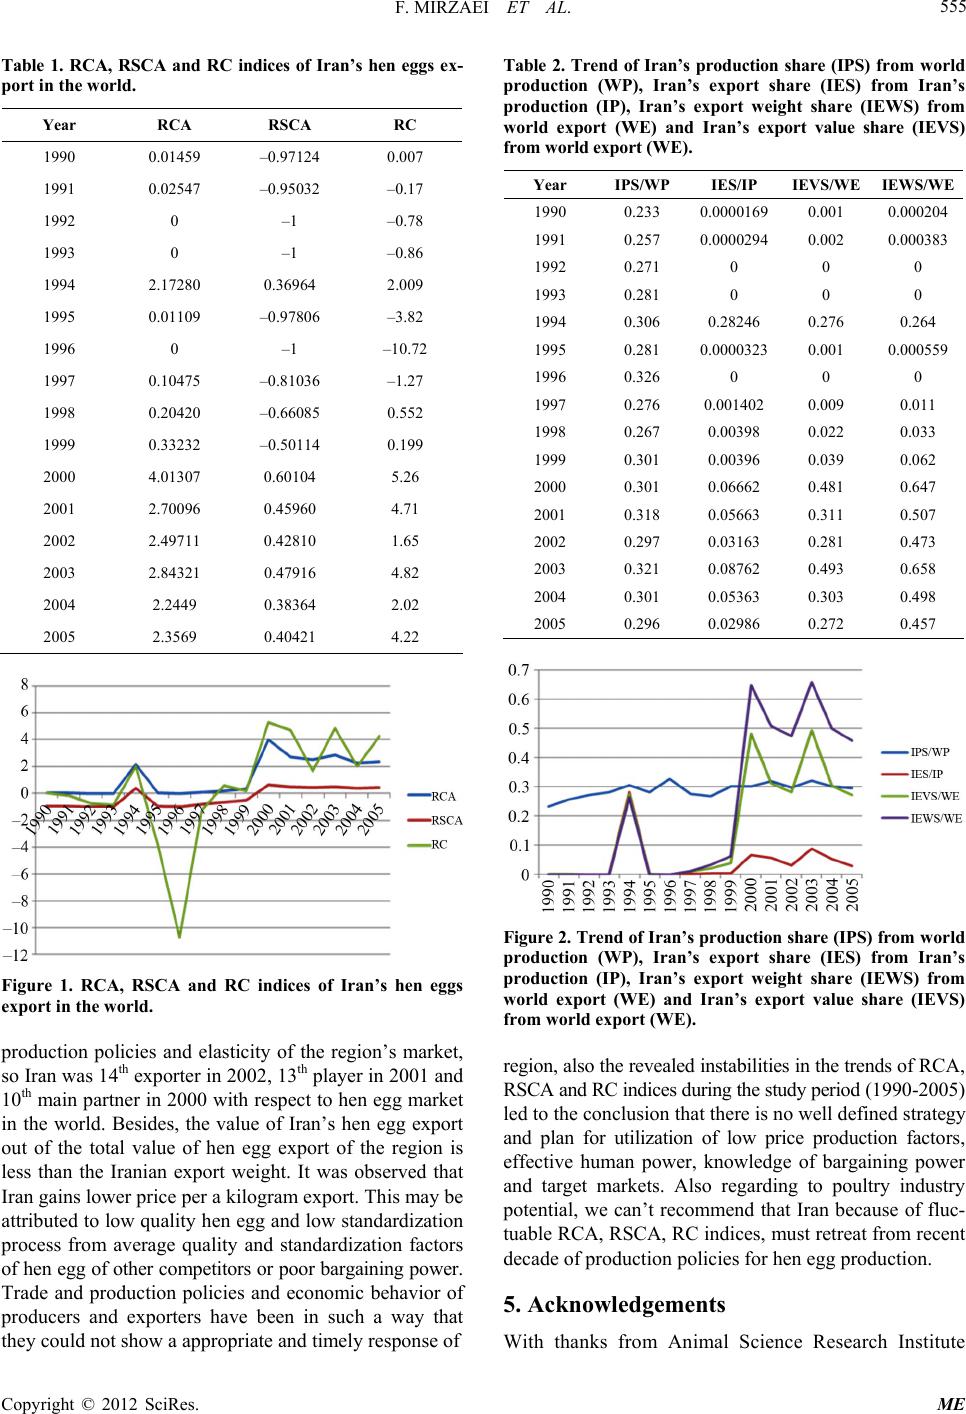
The distribution of the RCA indices in the start and end
years of the period is indicated non unifo rmity, so RSCA
and RC indices confirm the results gained from RCA
indices (Table 1, Figure 1). Also this research has been
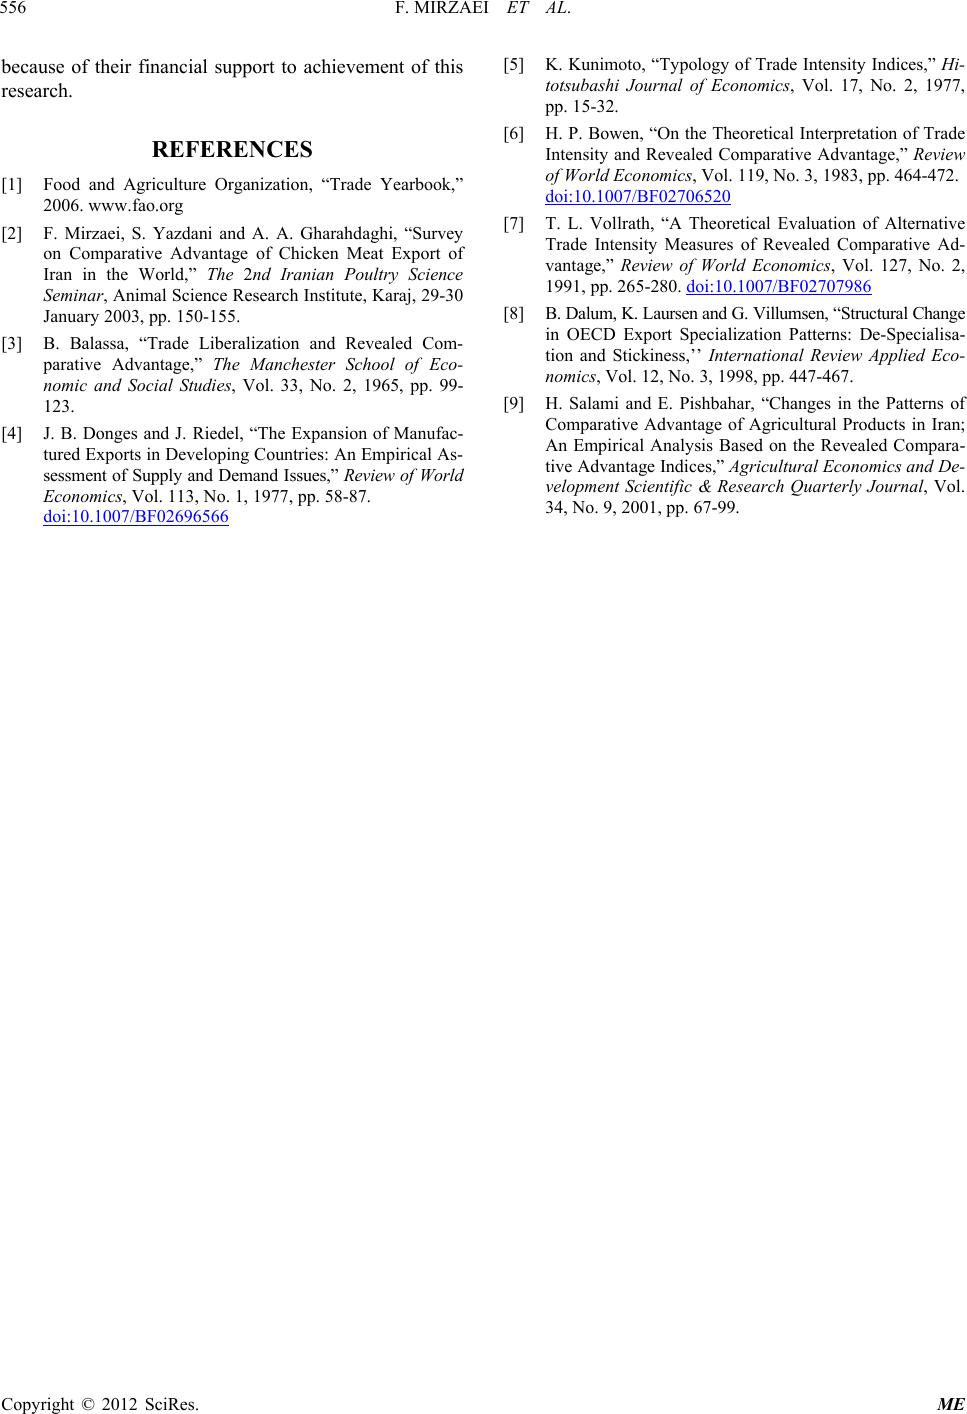
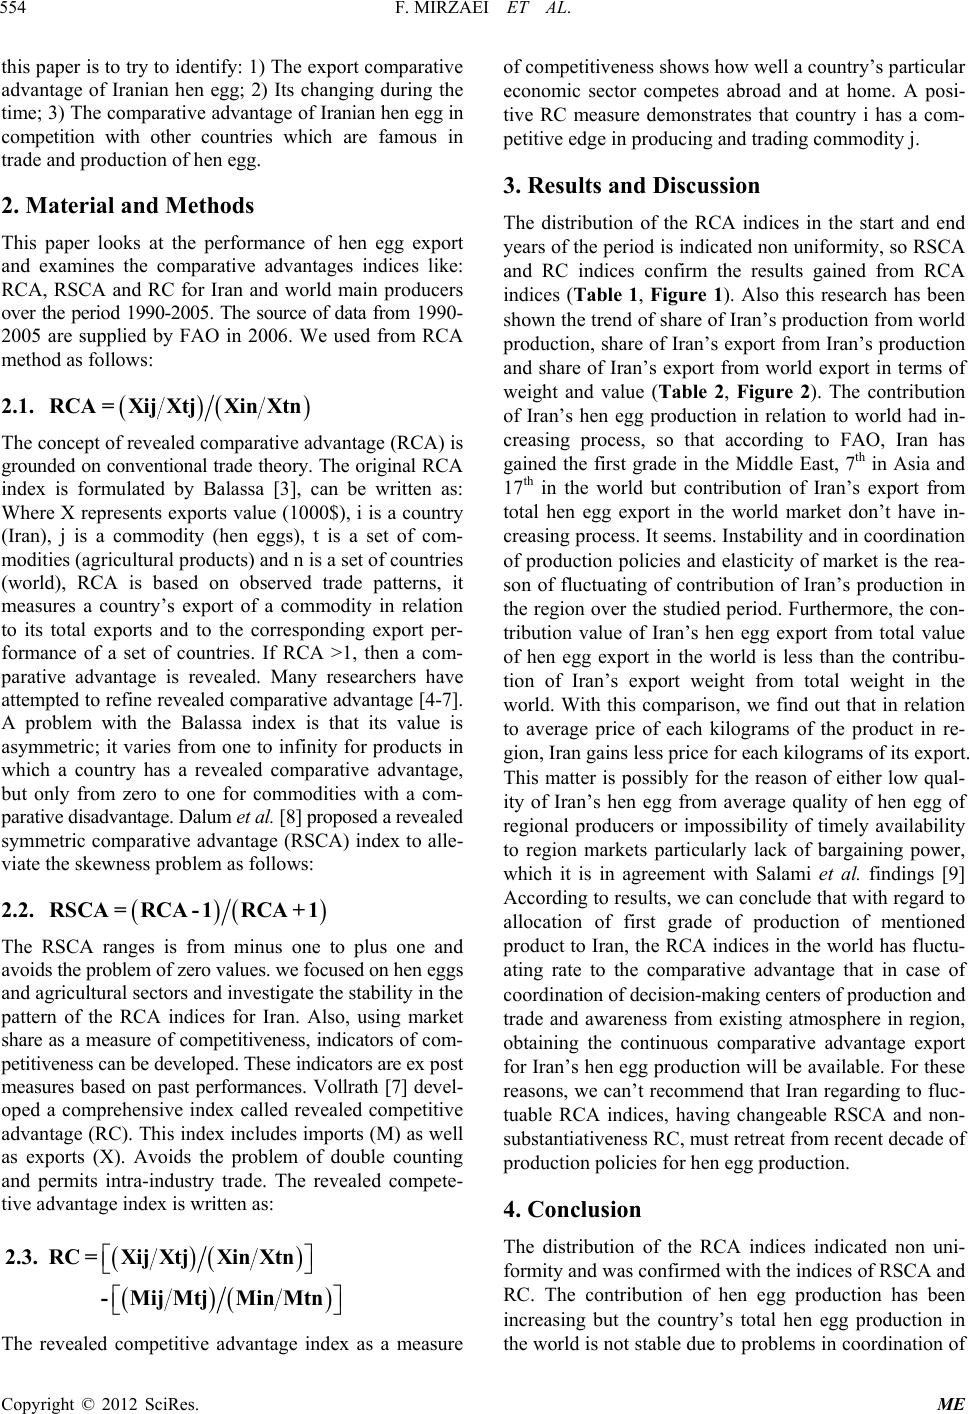
shown the trend of share of Iran’s production from world
production, share of Iran’s export from Iran’s production
and share of Iran’s export from world export in terms of
weight and value (Table 2, Figure 2). The contribution
of Iran’s hen egg production in relation to world had in-
creasing process, so that according to FAO, Iran has
gained the first grade in the Middle East, 7th in Asia and
17th in the world but contribution of Iran’s export from
total hen egg export in the world market don’t have in-
creasing process. It seems. Instability and in coordination
of production policies and elasticity of market is the rea-
son of fluctuating of contribution of Iran’s production in
the region over th e studied period. Furthermore, the con-
tribution value of Iran’s hen egg export from total value
of hen egg export in the world is less than the contribu-
tion of Iran’s export weight from total weight in the
world. With this comparison, we find out that in relation
to average price of each kilograms of the product in re-
gion, Iran gains less price for each kilograms of its export.
This matter is possibly for the reason of either low qual-
ity of Iran’s hen egg from average quality of hen egg of
regional producers or impossibility of timely availability
to region markets particularly lack of bargaining power,
which it is in agreement with Salami et al. findings [9]
According to results, we can conclude that with regard to
allocation of first grade of production of mentioned
product to Iran, the RCA indices in the world has fluctu-
ating rate to the comparative advantage that in case of
coo r dination of decision-making centers of production and
trade and awareness from existing atmosphere in region,
obtaining the continuous comparative advantage export
for Iran’s hen egg production will be av ailable. For these
reasons, we can’t recommend that Iran regarding to fluc-
tuable RCA indices, having changeable RSCA and non-
substantiativeness RC, must retreat from recent decade of
productio n p ol i c i es for hen egg product i o n.
4. Conclusion
The distribution of the RCA indices indicated non uni-
formity and was confirmed with the indices of RSCA and
RC. The contribution of hen egg production has been
increasing but the country’s total hen egg production in
the world is not stable due to problems in coordination of
Copyright © 2012 SciRes. ME
F. MIRZAEI ET AL. 555
Table 1. RCA, RSCA and RC indices of Iran’s hen eggs ex-
port in the world.
Year RCA RSCA RC
1990 0.01459 –0.97124 0.007
1991 0.02547 –0.95032 –0.17
1992 0 –1 –0.78
1993 0 –1 –0.86
1994 2.17280 0.36964 2.009
1995 0.01109 –0.97806 –3.82
1996 0 –1 –10.72
1997 0.10475 –0.81036 –1.27
1998 0.20420 –0.66085 0.552
1999 0.33232 –0.50114 0.199
2000 4.01307 0.60104 5.26
2001 2.70096 0.45960 4.71
2002 2.49711 0.42810 1.65
2003 2.84321 0.47916 4.82
2004 2.2449 0.38364 2.02
2005 2.3569 0.40421 4.22
Figure 1. RCA, RSCA and RC indices of Iran’s hen eggs
export in the world.
production policies and elasticity of the region’s market,
so Iran was 14th exporter in 2002, 13th player in 20 01 and
10th main partner in 2000 with respect to hen egg market
in the world. Besides, the value of Iran’s hen egg export
out of the total value of hen egg export of the region is
less than the Iranian export weight. It was observed that
Iran gains lower price per a kilogram export. This may be
attributed to low quality hen egg and low standardization
process from average quality and standardization factors
of hen egg of other competitors or poor bargaining power.
Trade and production policies and economic behavior of
producers and exporters have been in such a way that
they could not show a appropriate and timely respon se of
Table 2. Trend of Iran’s production share (IPS) from world
production (WP), Iran’s export share (IES) from Iran’s
production (IP), Iran’s export weight share (IEWS) from
world export (WE) and Iran’s export value share (IEVS)
from world export (WE).
Year IPS/WP IES/IP IEVS/WE IEWS/WE
1990 0.233 0.0000169 0.001 0.000204
1991 0.257 0.0000294 0.002 0.000383
1992 0.271 0 0 0
1993 0.281 0 0 0
1994 0.306 0.28246 0.276 0.264
1995 0.281 0.0000323 0.001 0.000559
1996 0.326 0 0 0
1997 0.276 0.001402 0.009 0.011
1998 0.267 0.00398 0.022 0.033
1999 0.301 0.00396 0.039 0.062
2000 0.301 0.06662 0.481 0.647
2001 0.318 0.05663 0.311 0.507
2002 0.297 0.03163 0.281 0.473
2003 0.321 0.08762 0.493 0.658
2004 0.301 0.05363 0.303 0.498
2005 0.296 0.02986 0.272 0.457
Figure 2. Trend of Iran’s production share (IP S) from w orl d
production (WP), Iran’s export share (IES) from Iran’s
production (IP), Iran’s export weight share (IEWS) from
world export (WE) and Iran’s export value share (IEVS)
from world export (WE).
region, also th e reve aled insta b ilit ies in th e tr en ds o f RC A,
RSCA and RC indices during the study period (1 990 -20 05)
led to the conclusion that there is no well defined strategy
and plan for utilization of low price production factors,
effective human power, knowledge of bargaining power
and target markets. Also regarding to poultry industry
potential, we can’t recommend that Iran because of fluc-
tuable RCA, RSCA, RC indices, must retreat from recent
decade of production policies for hen egg production.
5. Acknowledgements
With thanks from Animal Science Research Institute
Copyright © 2012 SciRes. ME
F. MIRZAEI ET AL.
Copyright © 2012 SciRes. ME
556
because of their financial support to achievement of this
research.
REFERENCES
[1] Food and Agriculture Organization, “Trade Yearbook,”
2006. www.fao.org
[2] F. Mirzaei, S. Yazdani and A. A. Gharahdaghi, “Survey
on Comparative Advantage of Chicken Meat Export of
Iran in the World,” The 2nd Iranian Poultry Science
Seminar, Animal Science Research Institute, Karaj, 29-30
January 2003, pp. 150-155.
[3] B. Balassa, “Trade Liberalization and Revealed Com-
parative Advantage,” The Manchester School of Eco-
nomic and Social Studies, Vol. 33, No. 2, 1965, pp. 99-
123.
[4] J. B. Donges and J. Riedel, “The Expansion of Manufac-
tured Exports in Developing Countries: An Empirical As-
sessment of Supply and Demand Issues,” Review of World
Economics, Vol. 113, No. 1, 1977, pp. 58-87.
doi:10.1007/BF02696566
[5] K. Kunimoto, “Typology of Trade Intensity Indices,” Hi-
totsubashi Journal of Economics, Vol. 17, No. 2, 1977,
pp. 15-32.
[6] H. P. Bowen, “On the Theoretical Interpretation of Trade
Intensity and Revealed Comparative Advantage,” Review
of World Economics, Vol. 119, No. 3, 1983, pp. 464-472.
doi:10.1007/BF02706520
[7] T. L. Vollrath, “A Theoretical Evaluation of Alternative
Trade Intensity Measures of Revealed Comparative Ad-
vantage,” Review of World Economics, Vol. 127, No. 2,
1991, pp. 265-280. doi:10.1007/BF02707986
[8] B. Dalum, K. Laursen and G. Villumsen, “Str uctu ra l Change
in OECD Export Specialization Patterns: De-Specialisa-
tion and Stickiness,’’ International Review Applied Eco-
nomics, Vol. 12, No. 3, 1998, pp. 447-467.
[9] H. Salami and E. Pishbahar, “Changes in the Patterns of
Comparative Advantage of Agricultural Products in Iran;
An Empirical Analysis Based on the Revealed Compara-
tive Advantage Indices,” Agricultural Economics and De-
velopment Scientific & Research Quarterly Journal, Vol.
34, No. 9, 2001, pp. 67-99.