 Modern Economy, 2012, 3, 508-517 http://dx.doi.org/10.4236/me.2012.35066 Published Online September 2012 (http://www.SciRP.org/journal/me) Equity Financing Regulation and the Optimal Capital Structure: Evidence from China* Zhengwei Wang1,2, Wuxiang Zhu1 1Tsinghua University, Beijing, China 2Beijing Normal University, Beijing, China Email: wangzhw@bnu.edu.cn Received October 30, 2011; revised November 20, 2011; accepted November 29, 2011 ABSTRACT The “Supply-side effect” on financial management caused by market imperfection has increasingly been concerned. During the transition period, there is strict securities regulation in China’s capital market, which brings the supply-side constraints to corporate financing. Using the data of listed companies those take secondary equity offerings between 1993-2007 in China’s A-share market, the paper examines how the change of regulation policies on SEOs affects cor- porate financing decisions. Our result shows that regulation policy is a significant factor to the amount of refinancing and the optimal capital structure. This result provides important evidence on how the equity regulation environment affects corporate financial management. Keywords: Equity Financing Regulation; Supply-Side Effect; Capital Structure 1. Introduction Since the pioneering work by Modigliani and Miller [1], the study on capital structure has continued for more than half a century. However, there hasn’t been a consistent theory for capital structure. All existing theories have their own assumptions of environmental conditions and concentrate on some factors that influence the financing decision and capital structure of the firm. These factors are very important for some firms under corresponding circumstances, which, however, are not necessarily the case under other circumstances. The inference that capital structure has nothing to do with the enterprise value of MM is built on the perfect assumption of capital market while considering the op- eration decision making as exogenesis. Nonetheless the condition of MM theory is considered to be too harsh and then the conclusion is unclear. Later on, financial schol- ars made much deeper research which is closer to reality of firm’s capital structure by broadening the assumptions of MM Theory. For example, with the understanding of the tax [2] and bankruptcy costs [3,4], the trade-off the- ory was then derived. The rapid development of the In- formation Asymmetry Theory in the 1970s led to the “Pecking order” theory with a broadened assumption on Information symmetry of MM [5,6]. The arguments of Jensen & Meckling [7] and Myers [8] developed the agent issues of MM, and the Agency theory on capital structure then formed. On the contrary, the capital structure research has not accounted for the impact of “market conditions”1 [9] until 1990s. In fact, the financing condition change in capital market obviously influences the enterprise’s financing choices. With the questioning and demonstration on the Efficient Markets Hypothesis (EMH), Behavioral Finance came out and its development pushed the rise of Behav- ioral Corporate Finance. Behavioral Corporate Finance started to pay attention to the impact on enterprise’s in- vestment and financing decisions and capital structure of market’s Non-efficiency while giving up Semi-strong effi- cient market assumption. Stein [10] presents a model on firm investment and financing decisions when market is inefficient and managers are rational. His model shows, in a non-efficient market, the manager can make best use of the inefficiency of the market to create value by rea- sonably making the financing decisions. This conclusion derives the market timing theory of financing, which is: with the price changes in stock market, the enterprise has the best financing opportunities or Window of Opportu- nity, firms can select stock offering after it goes up. The market timing hypothesis has been supported by many empirical results. In the Graham and Harvey’s anonymous survey of CFOs of public corporations, two- thirds state that “the amount by which our stock is undervalued or overvalued was an important or very *This paper is sponsored by National Natural Science Fund (71002074). 1Titman argues that “market conditions”, which are determined by the references of individuals and institutions that supply capital, can have an im ortant effect on how firms raise ca ital. C opyright © 2012 SciRes. ME  Z. W. WANG, W. X. ZHU 509 important consideration” in equity issuance [11]. The sur- vey made by Brau and Fawcett also shows that the over- all circumstance on in stock market is the most important factor (82.94% of CFO selected this factor) when made IPO decisions [12]. Similarly many other researches also find that the amount of equity issued in IPO and in SEO is typically correlated with the prior stock price [13,14]. The market timing effect is also reflected in capital struc- ture choice. This market timing theory of capital struc- ture is developed and tested in Baker and Wurgler [15]. In an effort to capture the historical coincidence of mar- ket valuations and the demand for external finance in a single variable, they construct an “external finance wei- ghted average” of a firm’s past market-to-book ratios. For example, a high value implies that the firm raises the bulk of its external finance, equity or debt, when its mar- ket-to-book was high. If market timing has a persistent impact on capital structure, Baker and Wurgler argue that, this variable will have a negative cross-sectional rela- tionship to the debt-to-assets ratio, even in regressions that control for the current market-to-book ratio. In a broad Compustat sample from 1968 to 1999, a strong negative relationship is apparent. Although the market timing theory has paid attention to the impact on the capital structure of the capital mar- ket condition, the capital market condition is not limited to the market timing obviously but it includes many other aspects, for example: the breadth and depth of the capital market development. Up to now, each existing capital structure theory has a common implicit assumption, that is, the capital market can provide so many financial prod- ucts that firms can choose means of financing freely. In fact, the impact on capital structure of development in capital market cannot be neglected. Even in US capital market, the firm can not entirely freely choose the chan- nel of financing. It is even more pronounced that the fi- nancing decisions of China’s listed firms are constrained by Chinese capital market condition. For example, there are various threshold limits to equity financing (including IPO, SEO, and convertible bond issuance…) of listed firms over time and the equity financing channel could even be shut down in special time periods (for example, in the period of reform of non-tradable shares in 2006, any kind of public equity issuing is prohibited). As a re- sult, we usually regard China’s capital market as a mar- ket with considerable immaturity and imperfection. These immaturity and imperfection make firms hard to freely choose their means of financing. Maybe it is the case that a firm wants to raise funds for its investment, combined with its own capital structure needs, equity financing is a dominant choice. In contrast, the firm may be forced to float a loan, merely because of equity financing constrains due to market conditions. The immaturity and imperfection of China’s capital market bring financing frictions to listed firms in stock market (When talking about market friction, the previous literature mainly refers to the tax, transaction cost, in- formation cost, agent cost, and so on. However, we refer to market frictions in this paper with a broader definition, that is, any restriction in financing caused by certain rea- sons. They not only include all kinds of costs mentioned above but also include financing restrictions brought by any financing policies and regulations). Is this kind of friction an important factor that influences the firm’s capital structure? We think it is necessary to study the impact on the optimal capital structure of the financing frictions in China’s stock market. This paper will focus on the relationship between optimal capital structure and the changes of financing policies and regulations envi- ronment, which proxies the changes of financing fric- tions in China’s A-share market. Besides, for the impor- tance of the market timing theory in recent years, this paper will examine the applicability of the market timing theory in China’s market at the same time. 2. Sample and Variables 2.1. Sample Now that we want to check the impact on the optimal capital structure caused by the change of financing fric- tions in China A-share market, we must firstly identify the explanatory variables on firm’s optimal capital struc- ture. However, as mentioned above, firms cannot finance freely. Thus we cannot ensure that firms can timely ad- just their capital structure to the optimal level, especially when it is higher than their optimal capital structure. Consequently, in a dynamic economy with frictions the leverage of most firms, most of the time, is likely to de- viate from the “optimal leverage” [16]. A direct consequence of the deviation from the “opti- mal leverage” is the non-observability of the optimal capital structure. Much of the existing empirical litera- ture that tests capital structure usually views observed debt ratios as “optimal”, and this may cause serious bias [17] because of the large gap between observed debt ratio and the “optimal”. To observe the optimal capital structure, a useful method is to identify the time when the firm can freely choose its financing policies An example is that if the equity fi- nancing constrain, the most important financing constrain that the firm faces in China, is released, or the firm can choose its financing policies freely, then, it can be con- sidered that the firm’s capital structure is in the “optimal state” after its free financing policies. For the above reasons, this paper restricts the sample to those firms that made Seasonal Equity Offering (SEO) between 1993 and 2007 in China A-share market. During the sample period there are 1.078 SEOs including 946 Copyright © 2012 SciRes. ME  Z. W. WANG, W. X. ZHU Copyright © 2012 SciRes. ME 510 China’s stock market are different from those in markets of western countries and other emerging markets, with particular emphasis on high degrees of unity of the stock market norms, development and market capacity. The stock issuing regulatory policy (including IPO and SEO) is a most typical aspect. From issuing condition, applica- tion auditing and final issuing, a series of requirements are set (i.e. financing amount, financing channel, issuing and auditing, issuing P/E ratio and issuing timing, etc). The following figures summarized the changes of regu- latory policies of two re-financing methods of rights of- fering and additional share offering. rights offerings and 343 additional share offerings (in- cluding directional add-issuance). We further exclude fina- ncial firms and firms with data missing according to the variable we need. The data end with 1.024 SEOs, includ- ing 890 rights offerings and 314 additional share offer- ings. Most data of this paper is from the Wind Database. 2.2. Background of SEO in China Because our research focuses on Secondary Equity Of- fering firms in A-share market, we first briefly introduce the evolution of SEO in China. Since the establishment of Shanghai Securities Exchange on December 1990, China’s stock market has achieved rapid development. Nonetheless China’s stock market has a different regulation environment compared with other countries. In fact, the stock market in China is not a Market-oriented mechanism. In contrast, it is established by government and regulated by a complex regulatory system comprising of the State Council, China’s Securi- ties Regulatory Commission, ministries and commissions and local government with the related rights. In history, the issuing and reviewing was not in the charge of Secu- rities Regulatory Commission. At the very beginning of the establishment of the securities market, the right was exercised by the local governments and exchanges. Learn- ing from the lesson of “8.10” event in 1992, the state decided to grant the authority of the issuing and auditing rights to Securities Regulatory Commission. Hence the issuing and auditing system at present is built at the base of the past experience. Figures 1 and 2 show that both the rights offering policy and the additional share offering policy are vary- ing over time, which leads the change of financing thres- hold. In addition, the comparison of Figure 1 and Figure 2 shows that the time segment of rights offering policy is not the same as additional share offering policy. 2.3. Proxies for Variables Capital structure: as we are interested in the influencing factors of optimal capital structure, the main variable of interest is capital structure in our paper. There are two kinds of measuring methods: one is in book value and the other is in market value. As the data window in the paper includes the reform of non-tradable shares period in China, the market value measuring method of the firm has experienced major changes. For sake of stability of the data, this paper selects the book debt ratio (BDR) to be the object of study defined as book debt divided by total assets, where the book debt is the interest-bearing debt defined as the sum of short-term debt, long-term liabilities due within one year and long-term liabilities. Under this system, except the basic regulatory system (i.e. limits on information disclose, insider dealing, etc.), the regulatory philosophy, policy and developing route of Figure 1. The main policy thresholds evolvement of the rights offering in China.  Z. W. WANG, W. X. ZHU 511 Figure 2. The main policy thresholds evolvement of the additional share offering in China. Financing proceeds: the market timing argues that proceeds of equity issuing are influenced by the stock market valuation [15,18]. The above discussion implies that the financing friction in the stock market may be an important factor influencing the financing. To compare the applicability of market timing and financing friction, this paper considers financing proceeds as one of the objects of study, Proceeds/A definition as the amount of proceeds divided by total assets at the end of the year, where the amount of proceeds is defined as (right offer- ing price) × (share issuing) for rights offering, or (addi- tional share offering price) × (share issuing) for addi- tional share offering. Equity financing friction: as described above, the eq- uity financing friction, especially how difficult to access capan important factor influencing the financing of a firm. However, it is hardly to be observed, and thus we need to find a proxy. Refer back to the refinancing regu- latory policies in Figures 1 and 2, with the changes of the equity financing policies, the thresholds to enter the stock market are also varying, which means that the difficulty level is varying. As a result, dummy variables can be set in the different policy periods to proxy changes of financ- ing friction. According to the changes of the refinancing policy in the above text, we can set policy dummy vari- ables as Table 1 below. If the results of our empirical study support our analy- sis, we expect these dummies have significant explana- tory power to firm’s financing policies. Growth opportunities: Theoretical studies generally sug- gest that growth opportunities are negatively related with leverage, which is also supported by many empirical studies [19-23]. There are also different proxies for growth Table 1. Policy dummies. DummyDefinition P1 For time between 1993.12 and 1994.9, P1 = 1, otherwise, P1 = 0 P2 For time between 1994.10 and 1996.1, P2 = 1, otherwise, P2 = 0 P3 For time between 1996.2 and 1998.5, P3 = 1, otherwise, P3 = 0 P4 For time between 1998.6 and 1999.3, P4 = 1, otherwise, P4 = 0 P5 For time between 1999.4 and 2000.5, P5 = 1, otherwise, P5 = 0 P6 For time between 2000.6 and 2001.3, P6 = 1, otherwise, P6 = 0 P7 For time between 2001.4 and 2002.7, P7 = 1, otherwise, P7 = 0 P8 For time between 2002.8 and 2006.5, P8 = 1, otherwise, P8 = 0 P9 For time after 2006.5, P9 = 1, otherwise, P9 = 0 opportunities. Wald [21] uses a 5-year average of sales growth. Rajan and Zingales [21] use Tobin’s Q and Booth et al. [19] use market-to-book ratio of equity to measure growth opportunities. We argue that sales growth rate is the past growth experience, while mar- ket-to-book ratio better proxies future growth opportuni- ties; therefore, market-to-book ratio of total assets is em- ployed to measure growth opportunities in our study. It is worth mentioning that in the study of Baker and Wurgler [15], market-to-book ratio is mainly used to build the factor measuring the market timing. It is suspected, however, that the control used by Baker and Wurgler is likely to be very noisy [18,24]. In addition to growth prospects, the market-to-book ratio is affected by a num- ber of other factors, such as the current state of the economy or the capital intensiveness of the firm’s tech- nology. As a result, two firms with identical market- to-book ratios may differ substantially in their growth potential. If one of these firms has a repeated history of Copyright © 2012 SciRes. ME  Z. W. WANG, W. X. ZHU 512 raising capital at high market-to-book ratios, it is more likely to be a growth firm, as the past financing activity is consistent with a growth trend. Even if the firm’s cur- rent investment prospects are dim, such a firm may keep its leverage ratio low in order to maintain financial flexi- bility for the future. Kayhan and Titman [25] documents that the persistence result of Baker and Wurgler is mainly driven by the persistence of the average market-to-book ratio rather than the covariance between the market-to- book ratio and the financing deficit. For these criticism, this paper uses market-to-book ratio to proxy growth opportunities but not market timing, and the market-to- book ratio (M/B) is defined as total market value divided by total book assets, where the market value is defined as market value of tradable shares plus non-tradable shares times net assets per share plus book value of debt. Earnings Volatility: a series of studies have shown that the optimal capital structure is decreasing in earnings vola- tility [4,19,23,26,27]. Among a number of proxies, we adopt the measure introduced by Booth et al. [19], namely Volatility = STD (profit of EBIT/total capital), where STD is the standard deviation for the recent three years. Market Timing: the market timing theory suggests that valuation in the capital market has an impact on the firm’s capital structure. As a response to the skeptic of Baker and Wurgler, Alti [18] measures market timing by the number of IPOs. His results are consistent with the no- tion that more IPOs are taking place during hot market than during cold market and thereby leverages are re- duced. Wang et al. [28] use this measure to investigate the market timing of seasoned equity offering (SEO hereafter) of Chinese listed firms. They find that market time has pronounced influence on the SEO decision. However, they also point that SEO in china is regulated by CRSC, which suggests that the number of SEOs reflects the regulator’s view of market timing rather than that of the listed firms. Since this paper endeavors to disentangle the impact of market timing and financing friction, it is inappropriate to employ Alti’s methodology here. As a matter of fact, Alti and Wang et al. both document a posi- tive correlation between the activeness of stock market and market index. Having said that, we measure market timing using stock market index. Profitability: the relationship between profitability and capital market is still under debate. Some researchers believe high profitability will increase the firm’s retained earnings, leading to a low leverage. Others argue that the leverage will increase in the case that the firm has better investment opportunity as well as sufficient capacity to borrow. Accordingly, the sign of its impact is not clear yet. We use EBIT/A as the proxy, defined as earnings before interest and tax divided by total assets. Size: Fama and Jensen [29] conjecture that the bigger the firm size, the more information the firm can provide to debtors. In other words, the information asymmetry between large firms and banks are lesser than that be- tween small firms and banks. Subsequent most empirical studies confirm this. Hence, we expect a positive impact of firm size on optimal capital structure. We define firm size as the natural logarithm of total assets. Fixed Assets: it is well recognized that the firm with more fixed assets can collateralize more assets and thus are capable to borrow more. Accordingly, we expect a positive impact of fixed assets measured by fixed assets over total assets. Depreciation: because depreciation and interest ex- penses can be substitutes of the “tax shield” effect, higher depreciation firms are expected to be lowlier levered. We define DEP/A = depreciation divided by total assets. Since listed firms in China did not disclose statement of cash flows until 1998, we are not able to observe their depreciation level. Having taken this into account, we conduct a separate test for sample after 1998. Ownership: Agency theory [7,30] proposes that firms with different ownership structure will face different agency problem and different capital structure consequently. According to the specific institutional background of China, private firms and state owned firms are facing different resource constraints. In particular, state owned firms are easier to access bank loan. We list ownership property as one of the major determinants of capital structure and use ownership proportion of state share as the proxy. It is defined as STATE = state share divided by total shares outstanding. 2.4. Descriptive Statistics In Table 2, we provide the descriptive statistics for the variables. It shows that there are 1204 observations for all of them except DEP/A for which 914 observations are available. It can be seen from the statistics that the mean and the median of each variable are close, indicating that the skewness is not a big issue of our sample. In Table 3, we slice our sample into 10 subsamples based on our prior review of regulations in the time se- quence. Nine regulation dichotomy variables are created accordingly. The table reveals the capital structure (BDR) and SEO proceeds (Proceeds/A)’s mean and variation in each subsample. It can be seen that among subsamples, mean varies a lot in BDR and Proceed/A. The last line of Table 3 lists the results of variation analysis. In this table the ANOVA analysis2 of BDR shows F statistics is 7.94 significant at 1% level, indicat- ing that the mean value is different among ten subsam- ples; the corresponding F statistics of Proceeds/A is 6.16 2T The null hypothesis of ANOVA analysis is mean is H0: the same among subsamples; the alternative analysis is H1: no less than one subsample has a different mean. Copyright © 2012 SciRes. ME  Z. W. WANG, W. X. ZHU 513 and significant at 1% level, indicating a large difference among ten subsamples. These results preliminarily show that the revolution of SEO regulations (or as indicated as the change in friction of equity refinancing) does heavily affect the proceeds of firms’ SEO decisions as well as optimal capital structure. Nonetheless, they are only the results from ANOVA analysis. It needs further confirma- tion based on following multivariate tests. 3. Empirical Results As mentioned previously, the change in friction of equity refinancing can have impact on firms’ financing activi- ties and further on optimal capital structure. On the other hand, based behavior financial theory, if the market tim- ing is right, financing proceeds would become greater and the optimal capital structure would be affected as well. In this section, we investigate the proceeds of equity refinancing and optimal capital structure respectively. The analysis includes detecting their determinants and further the influence of financing friction and market timing. Table 2. Descriptive statistics. Variables obs mean S.D. min max Median BDR 1204 0.2844 0.1725 0.0000 1.00000.2819 Proceeds/A 1204 0.1868 0.1314 0.0207 1.67210.1580 M/B 1204 1.6121 0.5797 0.9529 7.84631.4650 Volatility 1204 0.0251 0.0460 0.0002 0.20760.0182 Mktidx 1204 1868 1232 333 59541535 EBIT/A 1204 0.0696 0.0715 −0.2134 2.03710.0631 Size 1204 5.0570 1.0765 1.6760 9.58074.9769 FA/A 1204 0.3396 0.1897 0.0004 0.93120.3174 DEP/A 914 0.0203 0.0147 0.0000 0.12450.0175 STATE 1204 0.2458 0.2496 0.0000 0.88580.2112 Table 3. Variance analysis. BDR Proceeds/A obs mean S.D. mean S.D. Subsample 1 27 0.26390.1886 0.23850.1420 Subsample 2 32 0.20770.1569 0.20900.1535 Subsample 3 84 0.28950.1768 0.11630.0678 Subsample 4 191 0.27330.1623 0.17220.1430 Subsample 5 132 0.26720.1814 0.20780.1689 Subsample 6 150 0.24130.1444 0.18710.0896 Subsample 7 208 0.26650.1586 0.21450.1497 Subsample 8 73 0.26020.1601 0.20480.1036 Subsample 9 101 0.30950.1583 0.15040.0995 Subsample 10 206 0.36390.1912 0.18880.1209 ANOVA Test in subsamples F Value:7.94*** F Value:6.16*** ***mean statistically different from zero at the 1%. 3.1. Proceeds of Equity Refinancing As mentioned previously, the change in friction of equity refinancing can have impact on firms’ financing activi- ties and further on optimal capital structure. On the other hand, based behavior financial theory, if the market tim- ing is right, financing proceeds would become greater and the optimal capital structure would be affected as well. In this section, we investigate the proceeds of equity refinancing and optimal capital structure respectively. The analysis includes detecting their determinants and further the influence of financing friction and market timing. 01 121 3415 617 18 91 tt t tt tt tt ProceedsAcc MBcVolatility c Mktidxc EBITAc SIZE cFAAcDEPAcGYG cBDR 1 1t (1) As some variables are unobservable when refinancing, we adopt their value in prior year instead, denoted by subscript t-1; Mktidx is the comprehensive index of A share market when firms are refinancing, proxying for market timing. ε is the error term. In addition, based on the analysis of models in this paper and its numerical solution, friction in stock market is also a potential determinant of firms’ financing deci- sion. To account for this effect, we expand the model as follows, 01 121 3415 617 18 91 tt t tt tt tt ProceedsAcc MBc Volatility cMktidxcEBITAcSIZE cFAAcDEPA cGYG cBDR P 1 1 t (2) P denotes regulation indicator vector and β denotes other coefficient vector. Whether it is worth expanding model (1) into model (2) or whether the regulation indicator vector is jointly sig- nificant can be tested by F test. The null hypothesis H0: no need to add regulation in- dicators (that is, no need to establish model (2)); alterna- tive hypothesis H1: need to add regulation indicators (that is, need to establish model (2)). F statistics is im- puted as, 1 ru u SSE SSET FSSEN Tk (3) in which SSEr and SS Eu denotes the square sum of the residual square constraint model (without regulation in- dicators ) and non-constraint model (with regulation in- dicators) respectively; T is the number of regulation changes, N is the number of observations, and k denotes the number of other explanatory variables. The regression results of model (1) and model (2) are shown in Table 4. The first two columns illustrate the Copyright © 2012 SciRes. ME 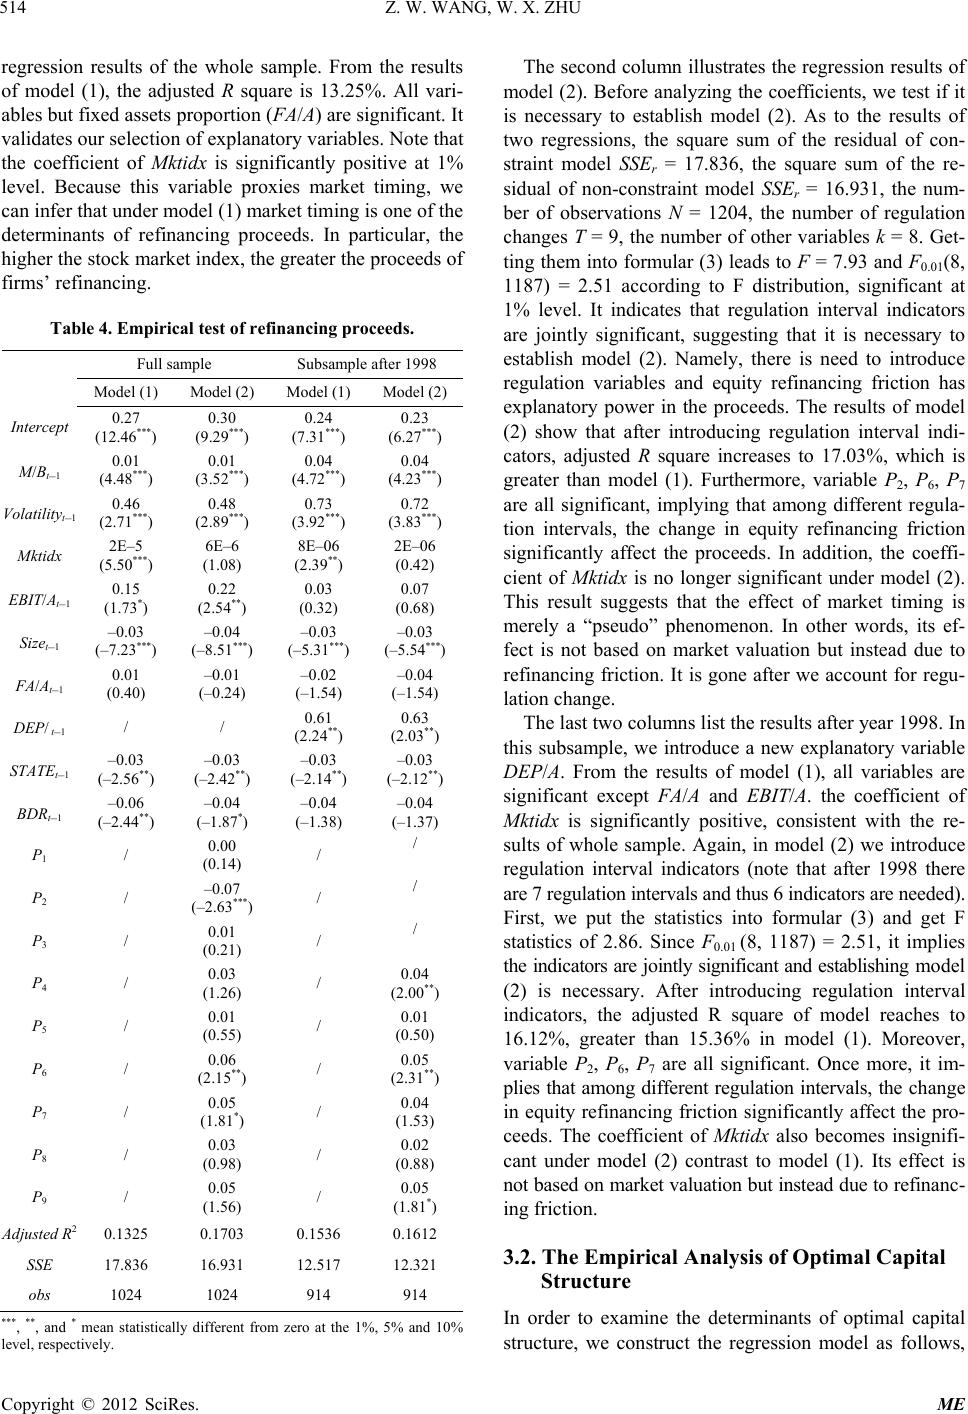 Z. W. WANG, W. X. ZHU 514 regression results of the whole sample. From the results of model (1), the adjusted R square is 13.25%. All vari- ables but fixed assets proportion (FA/A) are significant. It validates our selection of explanatory variables. Note that the coefficient of Mktidx is significantly positive at 1% level. Because this variable proxies market timing, we can infer that under model (1) market timing is one of the determinants of refinancing proceeds. In particular, the higher the stock market index, the greater the proceeds of firms’ refinancing. Table 4. Empirical test of refinancing proceeds. Full sample Subsample after 1998 Model (1) Model (2)Model (1) Model (2) Intercept 0.27 (12.46***) 0.30 (9.29***) 0.24 (7.31***) 0.23 (6.27***) M/Bt–1 0.01 (4.48***) 0.01 (3.52***) 0.04 (4.72***) 0.04 (4.23***) Volatilityt–1 0.46 (2.71***) 0.48 (2.89***) 0.73 (3.92***) 0.72 (3.83***) Mktidx 2E–5 (5.50***) 6E–6 (1.08) 8E–06 (2.39**) 2E–06 (0.42) EBIT/At–1 0.15 (1.73*) 0.22 (2.54**) 0.03 (0.32) 0.07 (0.68) Sizet–1 –0.03 (–7.23***) –0.04 (–8.51***) –0.03 (–5.31***) –0.03 (–5.54***) FA/At–1 0.01 (0.40) –0.01 (–0.24) –0.02 (–1.54) –0.04 (–1.54) DEP/ t–1 / / 0.61 (2.24**) 0.63 (2.03**) STATEt–1 –0.03 (–2.56**) –0.03 (–2.42**) –0.03 (–2.14**) –0.03 (–2.12**) BDRt–1 –0.06 (–2.44**) –0.04 (–1.87*) –0.04 (–1.38) –0.04 (–1.37) P1 / 0.00 (0.14) / / P2 / –0.07 (–2.63***) / / P3 / 0.01 (0.21) / / P4 / 0.03 (1.26) / 0.04 (2.00**) P5 / 0.01 (0.55) / 0.01 (0.50) P6 / 0.06 (2.15**) / 0.05 (2.31**) P7 / 0.05 (1.81*) / 0.04 (1.53) P8 / 0.03 (0.98) / 0.02 (0.88) P9 / 0.05 (1.56) / 0.05 (1.81*) Adjusted R2 0.1325 0.1703 0.1536 0.1612 SSE 17.836 16.931 12.517 12.321 obs 1024 1024 914 914 ***, **, and * mean statistically different from zero at the 1%, 5% and 10% level, respectively. The second column illustrates the regression results of model (2). Before analyzing the coefficients, we test if it is necessary to establish model (2). As to the results of two regressions, the square sum of the residual of con- straint model SSEr = 17.836, the square sum of the re- sidual of non-constraint model SSEr = 16.931, the num- ber of observations N = 1204, the number of regulation changes T = 9, the number of other variables k = 8. Get- ting them into formular (3) leads to F = 7.93 and F0.01(8, 1187) = 2.51 according to F distribution, significant at 1% level. It indicates that regulation interval indicators are jointly significant, suggesting that it is necessary to establish model (2). Namely, there is need to introduce regulation variables and equity refinancing friction has explanatory power in the proceeds. The results of model (2) show that after introducing regulation interval indi- cators, adjusted R square increases to 17.03%, which is greater than model (1). Furthermore, variable P2, P6, P7 are all significant, implying that among different regula- tion intervals, the change in equity refinancing friction significantly affect the proceeds. In addition, the coeffi- cient of Mktidx is no longer significant under model (2). This result suggests that the effect of market timing is merely a “pseudo” phenomenon. In other words, its ef- fect is not based on market valuation but instead due to refinancing friction. It is gone after we account for regu- lation change. The last two columns list the results after year 1998. In this subsample, we introduce a new explanatory variable DEP/A. From the results of model (1), all variables are significant except FA/A and EBIT/A. the coefficient of Mktidx is significantly positive, consistent with the re- sults of whole sample. Again, in model (2) we introduce regulation interval indicators (note that after 1998 there are 7 regulation intervals and thus 6 indicators are needed). First, we put the statistics into formular (3) and get F statistics of 2.86. Since F0.01 (8, 1187) = 2.51, it implies the indicators are jointly significant and establishing model (2) is necessary. After introducing regulation interval indicators, the adjusted R square of model reaches to 16.12%, greater than 15.36% in model (1). Moreover, variable P2, P6, P7 are all significant. Once more, it im- plies that among different regulation intervals, the change in equity refinancing friction significantly affect the pro- ceeds. The coefficient of Mktidx also becomes insignifi- cant under model (2) contrast to model (1). Its effect is not based on market valuation but instead due to refinanc- ing friction. 3.2. The Empirical Analysis of Optimal Capital Structure In order to examine the determinants of optimal capital structure, we construct the regression model as follows, Copyright © 2012 SciRes. ME 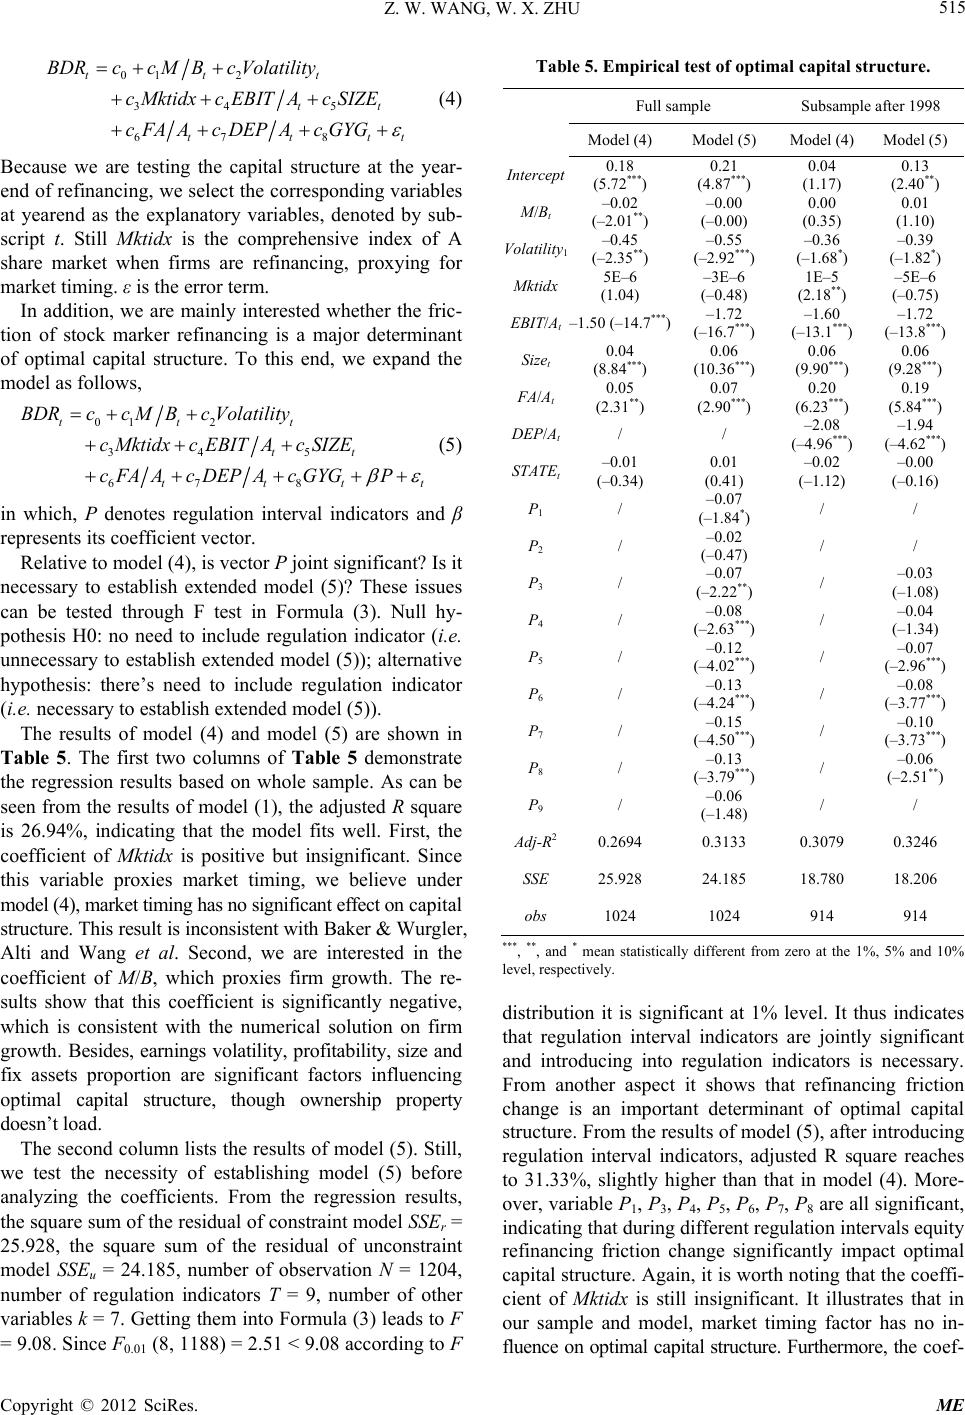 Z. W. WANG, W. X. ZHU 515 01 2 34 5 67 8 ttt tt ttt BDRcc MBcVolatility c MktidxcEBITAc SIZE cFAA cDEPA cGYGt (4) Because we are testing the capital structure at the year- end of refinancing, we select the corresponding variables at yearend as the explanatory variables, denoted by sub- script t. Still Mktidx is the comprehensive index of A share market when firms are refinancing, proxying for market timing. ε is the error term. In addition, we are mainly interested whether the fric- tion of stock marker refinancing is a major determinant of optimal capital structure. To this end, we expand the model as follows, 01 2 34 5 67 8 ttt tt ttt BDRcc MBcVolatility c MktidxcEBITAc SIZE cFAA cDEPA cGYGPt = 9.08. Since F0.01 (8, 1188) = 2.51 < 9.08 according to F (5) in which, P denotes regulation interval indicators and β represents its coefficient vector. Relative to model (4), is vector P joint significant? Is it necessary to establish extended model (5)? These issues can be tested through F test in Formula (3). Null hy- pothesis H0: no need to include regulation indicator (i.e. unnecessary to establish extended model (5)); alternative hypothesis: there’s need to include regulation indicator (i.e. necessary to establish extended model (5)). The results of model (4) and model (5) are shown in Table 5. The first two columns of Table 5 demonstrate the regression results based on whole sample. As can be seen from the results of model (1), the adjusted R square is 26.94%, indicating that the model fits well. First, the coefficient of Mktidx is positive but insignificant. Since this variable proxies market timing, we believe under model (4), market timing has no significant effect on capital structure. This result is inconsistent with Baker & Wurgler, Alti and Wang et al. Second, we are interested in the coefficient of M/B, which proxies firm growth. The re- sults show that this coefficient is significantly negative, which is consistent with the numerical solution on firm growth. Besides, earnings volatility, profitability, size and fix assets proportion are significant factors influencing optimal capital structure, though ownership property doesn’t load. The second column lists the results of model (5). Still, we test the necessity of establishing model (5) before analyzing the coefficients. From the regression results, the square sum of the residual of constraint model SSEr = 25.928, the square sum of the residual of unconstraint model SSEu = 24.185, number of observation N = 1204, number of regulation indicators T = 9, number of other variables k = 7. Getting them into Formula (3) leads to F Table 5. Empirical test of optimal capital structure. Full sample Subsample after 1998 Model el (5) M(4) Mododel (4) Model (5) Intercept (5 ) (4) (2 0.18 .72*** 0.21 .87*** 0.04 (1.17) 0.13 .40**) M/B t Volatility1(( ( t–1.5 ***)(( ( t(8 ) ) FA t) DEP t( ( t –01 0. 1( 2 3( –0 3 4 5( 6 7 8 9 Ad 20.294 0.3079 0.3246 –0.02 (–2.01**) –0.00 (–0.00) 0.00 (0.35) 0.01 (1.10) –0.45 (–2.35**) –0.55 –) 2.92*** –0.36 –1.68*) –0.39 –1.82*) Mktidx 5E–6 (1.04) –3E–6 (–0.48) 1E–5 (2.18**) –5E–6 (–0.75) EBIT/A0 (–14.7–1.72 –) 16.7*** –1.60 –) 13.1*** –1.72 –13.8***) Size 0.04 .84*** 0.06 (1 ) 0.36*** 0.06 (9.90*** 0.06 (9.28***) /A0.05 (2.31**) 0.07 (2.90*** 0.20 (6 ) .23*** 0.19 (5.84***) /A/ / –2.08 –) 4.96*** –1.94 –4.62***) STATE .0 (–0.34) 01 (0.41) –0.02 (–1.12) –0.00 (–0.16) P / –0.07 * –1.84 ) / / P / –0.02 (–0.47) / / P / –0.07 ** –2.22) / .0 (–1.08) P / –0.08 (– ) 2.63*** / –0.04 (–1.34) P / –0.12 (– ) 4.02*** / –0.07 –2.96***) P / –0.13 (– ) 4.24*** / –0.08 (–3.77***) P / –0.15 (– ) 4.50*** / –0.10 (–3.73***) P / –0.13 (– ) 3.79*** / –0.06 (–2.51**) P / –0.06 (–1.48) / / j-R 60.3133 SSE 25.928 24.185 18.780 18.206 obs 1024 1024 914 914 *** * mestically d zere 1%, 5%10% distribution it is significant at 1% level. It thus indicates , **, and an statiifferent fromo at th and level, respectively. that regulation interval indicators are jointly significant and introducing into regulation indicators is necessary. From another aspect it shows that refinancing friction change is an important determinant of optimal capital structure. From the results of model (5), after introducing regulation interval indicators, adjusted R square reaches to 31.33%, slightly higher than that in model (4). More- over, variable P1, P3, P4, P5, P6, P7, P8 are all significant, indicating that during different regulation intervals equity refinancing friction change significantly impact optimal capital structure. Again, it is worth noting that the coeffi- cient of Mktidx is still insignificant. It illustrates that in our sample and model, market timing factor has no in- fluence on optimal capital structure. Furthermore, the coef- Copyright © 2012 SciRes. ME  Z. W. WANG, W. X. ZHU 516 ficient of M/B is not significant under model (5). Because Baker and Wurgler (2002) interpret this coefficient as a measure of market timing, our results show that even though M/B is a measure of market timing, it is not a major determinant of optimal capital structure. In addi- tion, earnings volatility, profitability, size and fix assets proportion are still significant but ownership property continues to be insignificant. The last two columns show the statistics after 1998. In th 4. Conclusion Remarks ine the influence of stock un wi firms, “mar- ke mple of equity refinancing firms, firm gr preciation, earnings vola- tili ctors which ha REFERENCES [1] F. Modigliani e Cost of Capital, liani and M. H. Miller, “Corporate Income y, G. A. Jarrell and E. H. Kim, “On the Exis- is subsample, we introduce new explanatory variable DEP/A. From the result of model (4), we can see that DEP/A is significantly negative, consistent with our pre- diction, which confirms substitution “tax shield” effect between depreciation and liability. Here Mktidx is posi- tive, showing that without accounting for regulation change the result is dominated by “market timing” effect. As to other variables, little change takes place with regards to the sign and significance. In model (5), we again intro- duce regulation interval indicators. Getting the statistics results into Formula (3) lead to F value = 5.68. Accord- ing to F distribution, F0.01 (5, 900) = 3.02 < 5.68. Hence it is significant at 1% level and establishing model (5) is necessary. In addition, it shows the in this subsample equity refinancing friction change has critical effect in explaining optimal capital structure. After introducing regulation interval indicators, the adjusted R square reaches to 32.46%, slightly higher than 30.79% in model (4). Moreover, variable P5, P6, P7, P8 are all significant, indi- cating that in this subsample during different regulation intervals equity refinancing friction change significantly impact optimal capital structure. Again, it is worth noting that the coefficient of Mktidx is still insignificant. It illus- trates that the market timing effect is not really rooted from valuation but equity refinancing friction instead. Furthermore, the coefficient of M/B is not significant under model (5). Once more, it shows that market timing as proxied by M/B is not a major determinant of optimal capital structure. In addition, earnings volatility, profit- ability, size and fix assets proportion are still significant but ownership property continues to be insignificant. In this study, in order to exam market financing friction on optimal capital structure, we adopt all the listed A firms in China during 1993 to 2007 to study this effect. Based on our sample and variance and regression analysis, we conclude as follows: First, the refinancing regulation change, in conjction th its resulting refinancing friction change, is a signifi- cant determinant of firms’ refinancing proceeds and op- timal capital structure. This point adds to previous litera- ture on the determinants of capital structure. Second, in our sample of equity refinancing t timing” effect is neither a major determinant of firms’ refinancing proceeds nor a major determinant of optimal capital structure. Third, in our sa owth (measured by M/B) positively affects listed firms’ refinancing proceeds though no significant effect on op- timal capital structure is found. Fourth, other factors such as de ty, growth, size and fixed assets proportion are signifi- cant determinants of optimal capital structure. No effect, however, is found as to ownership property. All these results shows that besides the fa ve been considered in current capital structure litera- ture, equity refinancing friction is also an important fac- tor of firms’ financing behavior and capital structure. In addition, Chinese stock market is distinct from western mature markets with respects to firms refinancing be- havior and its impact on capital market. In particular, more government interventions are taking place in Chi- nese stock market and its effect on refinancing friction is a vital determinant of firms’ refinancing decision. On the contrary, marker timing effect plays a lesser important role at the same time. Therefore, it reflects a critical im- portant impact of the regulator in Chinese stock market. and M. H. Miller, “Th Corporation Finance and the Theory of Investment,” The American Economic Review, Vol. 48, No. 3, 1958, pp. 261-297. [2] F. Modig Taxes and the Cost of Capital: A Correction,” The Ameri- can Economic Review, Vol. 53, No. 3, 1963, pp. 433-443. [3] N. D. Baxter, “Leverage, Risk of Ruin and the Cost of Capital,” Journal of Finance, Vol. 22, No. 3, 1967, pp. 395-403. [4] M. Bradle tence of an Optimal Capital Structure: Theory and Evi- dence,” Journal of Finance, Vol. 39, No. 3, 1984, pp. 857-878. doi:10.1111/j.1540-6261.1984.tb03680.x [5] S. C. Myers and N. S. Majluf, “Corporate Financing and Investment Decisions When Firms Have Information That Investors Do Not Have,” Journal of Financial Economics, Vol. 13, No. 2, 1984, pp. 187-221. doi:10.1016/0304-405X(84)90023-0 [6] S. C. Myers, “The Capital Structure Puzzle,” Journal of Finance, Vol. 39, No. 3, 1984, pp. 575-592. doi:10.2307/2327916 [7] M. C. Jensen and W. H. Meckling, “Theory of the Firm: Managerial Behavior, Agency Costs and Ownership Structure,” Journal of Financial Economics, Vol. 3, No. 4, 1976, pp. 305-360. doi:10.1016/0304-405X(76)90026-X [8] S. C. Myers, “Determinants of Corporate Borrowing,” Journal of Financial Economics, Vol. 5, No. 2, 1977, pp. 147-175. doi:10.1016/0304-405X(77)90015-0 [9] S. Titman, “The Modigliani and Miller Theorem and Copyright © 2012 SciRes. ME  Z. W. WANG, W. X. ZHU Copyright © 2012 SciRes. ME 517 Irrationa Market Efficiency,” Working Paper 8641, National Bu- reau of Economic Research (December 2001). [10] J. C. Stein, “Rational Capital Budgeting in anl World,” Journal of Business, Vol. 69, No. 4, 1996, pp. 429-455. doi:10.1086/209699 [11] J. R. Graham and C. R. Harvey, “The Theory and Practice of Corporate Finance: Evidence from the Field,” Journal of Financial Economics, Vol. 60, No. 2, 2001, pp. 187- 243. doi:10.1016/S0304-405X(01)00044-7 [12] J. C. Brau and S. E. Fawcett, “Initial public Offerings: An 0.x Analysis of Theory and Practice,” Journal of Finance, Vol. 61, No. 1, 2006, pp. 399-436. doi:10.1111/j.1540-6261.2006.0084 st, “Initial Public [13] T. Loughran, J. R. Ritter and K. Rydqvi Offerings: International Insights,” Pacific Basin Finance Journal, Vol. 2, No. 2, 1994, pp. 165-199. doi:10.1016/0927-538X(94)90016-7 [14] A. Hovakimian, T. Opler and S. Titman, “The Debt- Equity Choice,” Journal of Financial and Quantitative Analysis, Vol. 36, No. 1, 2001, pp. 1-24. doi:10.2307/2676195 [15] M. Baker and J. Wurgler, “Market Timing and Capital Structure,” Journal of Finance, Vol. 57, No. 1, 2002, pp. 1-32. doi:10.1111/1540-6261.00414 [16] I. A. Strebulave, “Do Tests of Capital Structure Theor 2007.01256.x y Mean What They Say?” Journal of Finance, Vol. 62, No. 4, 2007, pp. 1747-1787. doi:10.1111/j.1540-6261. ynamic Capi-[17] E. O. Fischer, R. Heinkel and J. Zechner, “D tal Structure Choice: Theory and Tests,” Journal of Fi- nance, Vol. 44, No. 1, 1989, pp. 19-40. doi:10.1111/j.1540-6261.1989.tb02402.x et Timing 1.2006.00886.x [18] A. Alti, “How Persistent Is the Impact of Mark on Capital Structure?” Journal of Finance, Vol. 61, No. 4, 2006, pp. 1681-1710. doi:10.1111/j.1540-626 unt and V. Mak-[19] L. Booth, V. Aivazian, A. Demirguc-K simovic, “Capital Structures in Developing Countries,” Journal of Finance, Vol. 56, No. 1, 2001, pp. 87-130. doi:10.1111/0022-1082.00320 [20] W. S. Kim and E. H. Sorensen, “Evidence on the Impact of the Agency Costs of Debt on Corporate Debt Policy,” Journal of Financial and Quantitative Analysis, Vol. 21, No. 2, 1986, pp. 131-144. doi:10.2307/2330733 [21] R. G. Rajan and L. Zingales, “What Do We Know about Capital Structure? Some Evidence from International Data,” Journal of Finance, Vol. 50, No. 5, 1995, pp. 1421-1460. doi:10.1111/j.1540-6261.1995.tb05184.x [22] C. J. Smith and R. L. Watts, “The Investment Opportu- 029-W nity Set and Corporate Financing, Dividend, and Com- pensation Policies,” Journal of Financial Economics, Vol. 32, No. 3, 1992, pp. 263-292. doi:10.1016/0304-405X(92)90 Affect Capital De- [23] J. K. Wald, “How Firm Characteristics Structure: An International Comparison,” Journal of Fi- nancial Research, Vol. 22, No. 2, 1999, pp. 161-187. [24] A. Hovakimian, “Are Observed Capital Structures termined by Equity Market Timing?” Journal of Finan- cial and Quantitative Analysis, Vol. 41, No. 1, 2006, pp. 221-243. doi:10.1017/S0022109000002489 [25] A. Kayhan and S. Titman, “Firms’ Histories and Their 7 Capital Structures,” Journal of Financial Economics, Vol. 83, No. 1, 2007, pp. 1-32. doi:10.1016/j.jfineco.2005.10.00 nd an and R. Wessels, “The Determinants of Capital [26] S. Chaplinsky and G. Niehaus, “Do Inside Ownership a Leverage Share Common Determinants,” Quarterly Jour- nal of Business and Economics, Vol. 22, No. 4, 1993, pp. 51-65. [27] S. Titm Structure Choice,” Journal of Finance, Vol. 43, No. 1, 1988, pp. 1-19. doi:10.1111/j.1540-6261.1988.tb02585.x [28] Z. Wang, D. Zhao and W. Zhu, “Market Timing in Sea- y Problems and soned Equity Offerings with Security Issue Regulation and Its Impact on Capital Structure,” Nankai Business Review, Vol. 10, No. 6, 2007, pp. 40-46. [29] E. F. Fama and M. C. Jensen, “Agenc Residual Claims,” Journal of Law & Economics, Vol. 26, No. 2, 1983, pp. 327-349. doi:10.1086/467038 [30] M. C. Jensen, “Agency Costs of Free Cash Flow, Corpo- rate Finance, and Takeovers,” American Economic Re- view, Vol. 76, No. 2, 1986, pp. 323-329.
|