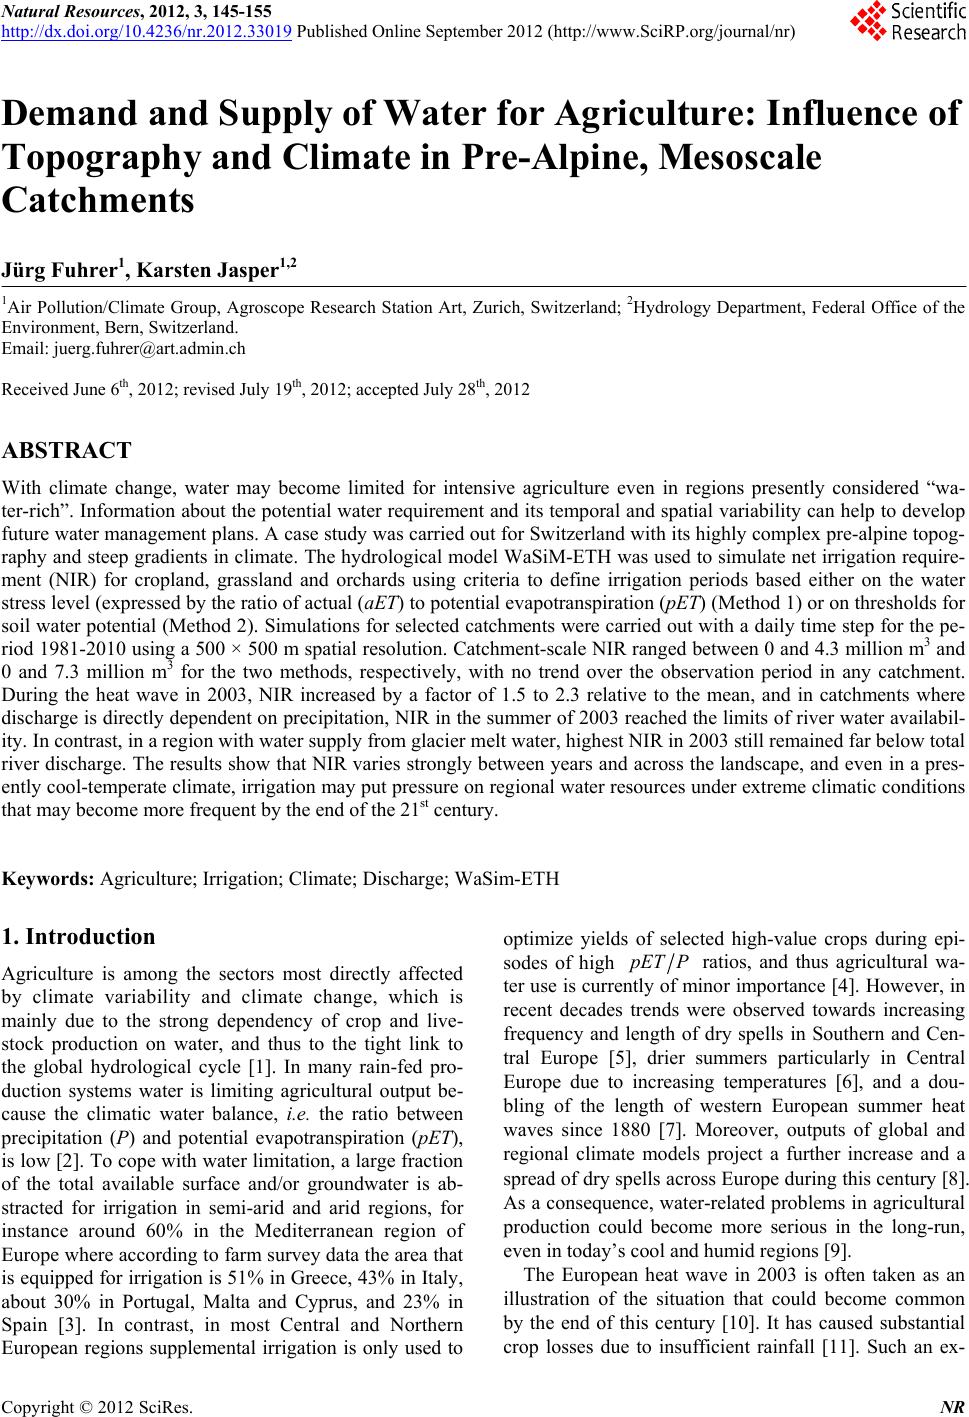
 Natural Resources, 2012, 3, 145-155 http://dx.doi.org/10.4236/nr.2012.33019 Published Online September 2012 (http://www.SciRP.org/journal/nr) 145 Demand and Supply of Water for Agriculture: Influence of Topography and Climate in Pre-Alpine, Mesoscale Catchments Jürg Fuhrer1, Karsten Jasper1,2 1Air Pollution/Climate Group, Agroscope Research Station Art, Zurich, Switzerland; 2Hydrology Department, Federal Office of the Environment, Bern, Switzerland. Email: juerg.fuhrer@art.admin.ch Received June 6th, 2012; revised July 19th, 2012; accepted July 28th, 2012 ABSTRACT With climate change, water may become limited for intensive agriculture even in regions presently considered “wa- ter-rich”. Information about the potential water requirement and its temporal and spatial variability can help to develop future water management plans. A case study was carried out for Switzerland with its highly complex pre-alpine topog- raphy and steep gradients in climate. The hydrological model WaSiM-ETH was used to simulate net irrigation require- ment (NIR) for cropland, grassland and orchards using criteria to define irrigation periods based either on the water stress level (expressed by the ratio of actual (aET) to potential evapotranspiration (pET) (Method 1) or on thresholds for soil water potential (Method 2). Simulations for selected catchments were carried out with a daily time step for the pe- riod 1981-2010 using a 500 × 500 m spatial resolution. Catchment-scale NIR ranged between 0 and 4.3 million m3 and 0 and 7.3 million m3 for the two methods, respectively, with no trend over the observation period in any catchment. During the heat wave in 2003, NIR increased by a factor of 1.5 to 2.3 relative to the mean, and in catchments where discharge is directly dependent on precipitation, NIR in the summer of 2003 reached the limits of river water availabil- ity. In contrast, in a region with water supply from glacier melt water, highest NIR in 2003 still remained far below total river discharge. The results show that NIR varies strongly between years and across the landscape, and even in a pres- ently cool-temperate climate, irrigation may put pressure on regional water resources under extreme climatic conditions that may become more frequent by the end of the 21st century. Keywords: Agriculture; Irrigation; Climate; Discharge; WaSim-ETH 1. Introduction Agriculture is among the sectors most directly affected by climate variability and climate change, which is mainly due to the strong dependency of crop and live- stock production on water, and thus to the tight link to the global hydrological cycle [1]. In many rain-fed pro- duction systems water is limiting agricultural output be- cause the climatic water balance, i.e. the ratio between precipitation (P) and potential evapotranspiration (pET), is low [2]. To cope with water limitation, a large fraction of the total available surface and/or groundwater is ab- stracted for irrigation in semi-arid and arid regions, for instance around 60% in the Mediterranean region of Europe where according to farm survey data the area that is equipped for irrigation is 51% in Greece, 43% in Italy, about 30% in Portugal, Malta and Cyprus, and 23% in Spain [3]. In contrast, in most Central and Northern European regions supplemental irrigation is only used to optimize yields of selected high-value crops during epi- sodes of high pETP ratios, and thus agricultural wa- ter use is currently of minor importance [4]. However, in recent decades trends were observed towards increasing frequency and length of dry spells in Southern and Cen- tral Europe [5], drier summers particularly in Central Europe due to increasing temperatures [6], and a dou- bling of the length of western European summer heat waves since 1880 [7]. Moreover, outputs of global and regional climate models project a further increase and a spread of dry spells across Europe during this century [8]. As a consequence, water-related problems in agricultural production could become more serious in the long-run, even in today’s cool and humid regions [9]. The European heat wave in 2003 is often taken as an illustration of the situation that could become common by the end of this century [10]. It has caused substantial crop losses due to insufficient rainfall [11]. Such an ex- Copyright © 2012 SciRes. NR  Demand and Supply of Water for Agriculture: Influence of Topography and Climate in Pre-Alpine, Mesoscale Catchments 146 treme situation increases the demand for irrigation, thus putting pressure on natural water resources and causing conflicts between different water users [4]. In response to the threat of an increasing competition between different sectors, national drought management plans have already been developed in several EU member states [12] and elsewhere. To develop sustainable water management plans for ag- riculture, quantitative estimates of water requirements under different climatic conditions are needed. Such es- timates enable to localize geographical hotspots, to iden- tify the most water-demanding production systems, and to evaluate the efficiency of different irrigation strategies and techniques [13,14]. In countries with ample water supply, detailed information about current agricultural water use is often not available because mandatory re- porting is lacking. In Switzerland, the only available es- timate is from a survey among Cantonal authorities. Ac- cording to this survey a total of 140 million m3 of water mostly taken from rivers and lakes is used annually to irrigate approximately 50,000 ha of which the largest fraction is located in the dry and warm Rhone valley (Valais) [15]. But for planning purposes, a more detailed analysis is necessary that accounts for spatial and tem- poral variability in potential irrigation water requirement in relation to the availability of surface water (river dis- charge). A high level of detail is particularly necessary in pre-alpine and alpine regions of Europe because of the complex topography and hydrology, and pronounced climatic gradients that are not sufficiently accounted for in global [16] or regional [17] models. Net irrigation requirement (NIR), i.e. the total amount of water during the growing season necessary to reach optimal crop yield without considering efficiency factors for irrigation systems, is essentially determined by the balance between all relevant water fluxes in and out of a cropping system. Therefore, to assess NIR across larger regions or catchments, spatially distributed hydrological models are necessary that consider all relevant hydro- logical processes and include crop-specific parameters and phenological patterns. In the present study, the model WaSiM-ETH [18,19] was applied which was pre- viously used to estimate the long-term response to cli- mate change scenarios of major river discharge [20], or of soil moisture in different catchments in Switzerland [21]. The model allows defining criteria to trigger irriga- tion. These criteria can be based on upper and lower thresholds of soil water potential, which is the default method of the model. As an alternative, thresholds of an index related to the level of water limitation, i.e. the ratio between actual (aET) and potential evapotranspiration (pET) can be used, which is directly related to the ratio between actual and non-water-limited crop yield [22]. The aim of the study was 1) to estimate average NIR during 1981-2010 for three main land use types (crop- land, grassland and orchards) in selected catchments based on the two criteria for irrigation triggering; 2) to analyze inter-annual variability and trends; and 3) to re- late NIR to observed discharge in the main rivers of these catchments to identify possible limitations for surface water availability. 2. Data and Methods 2.1. Catchments Six catchments representing different climatic and soil conditions, topography and degree of glaciations were chosen (Figure 1): Thur, Emme, and Broye on the Cen- tral Plateau, central Rhone (Rhone valley between Brigue and Sion) in the Valais, Ticino located south of the Alps, and Dischmabach in the eastern Alps. In Table 1, data are summarized to characterize the catchments. Together, the selected catchments covered a total area of 6159 km2. Their agricultural land was 2252 km2 representing about 16% of the total agricultural area of the country. 2.2. Meteorological Data Daily data for precipitation (428 stations), air tempera- ture (84 stations), wind speed (100 stations), vapor pres- sure (61 stations), relative humidity (86 stations), global radiation (68 stations) and relative sunshine duration (68) from different monitoring networks were extracted from the CLIMAP-net databank of the Swiss Federal Office for Meteorology (MeteoSuisse, www.meteosuisse.ch). The stations covered an altitude rangeing from 203 to 3580 m a.s.l. with the majority of stations located below 1000 m a.s.l. Precipitation measurements were error- corrected, separately for snow and rain using the methods described in Schulla and Jasper [23], with separate cor- rection factors for individual regions. In addition, data of temperature and radiation were adjusted for the effects of aspect and slope after their interpolation on the model grid. All station-based data were spatially interpolated using a weighted combination of inverse-distance inter- polation and altitude-dependent regression (for details, see [23]). Altitude-dependent regression was applied separately to regions differing in the overall climate [24]. Gridded data of all parameters were extracted for each catchment. 2.3. Geospatial Data Spatial information was derived from three gridded GIS data layers: elevation (from Swisstopo at www.swisstopo.admin.ch), land use (Swiss Land-Use Statistics 2004/09 at www.bfs.admin.ch), and soil char- acteristics (Swiss Soil Suitability Map, [25]). For the Copyright © 2012 SciRes. NR  Demand and Supply of Water for Agriculture: Influence of Topography and Climate in Pre-Alpine, Mesoscale Catchments Copyright © 2012 SciRes. NR 147 Figure 1. Location of selected catchments. Circles mark the location of the gauge. Table 1. Characteristics of the selected catchments. Catchment Thur Emme Broye Rhone Ticino Dischmabach Size (km2) 1696 939 392 1574 1515 43 Mean altitude (m a.s.l.) Altitude range 770 356 - 2504 860 458 - 2221 710 441 - 1504 2066 484 - 4435 1680 220 - 3402 2372 1668 - 3146 Fraction of agricultural land (cropland/grassland) (%) 55.2 (36.4/18.8) 51.5 (27.4/24.1) 64.1 (57.1/7.0) 16.9 (0.2/16.7) 12.9 (0.5/12.4) 27.1 (0/27.1) Mean temperature (oC)1) 14.7 14.6 16.2 14.1 15.5 8.6 Precipitation sum (mm)1) 825 666 664 488 931 718 Fraction of glaciation (%) 0 0 0 8.2 0.7 2.1 1) Regional means for April-September, 1981-2010. application of the hydrological model, the original land- use statistics with 72 classes were reclassified into 16 clas- ses from which three aggregated classes were extracted for this study: cropland, grassland and orchards. The neces- sary soil parameters, e.g. soil-water retention curves and saturated hydraulic conductivities for major soil textural groups, were not directly available. They were derived from the Swiss Soil Suitability Map [25]. All spatial data sets were adjusted to the 500 × 500 m model grid. 2.4. The Hydrological Model WaSiM-ETH Simulations with a daily time-step were carried out with the distributed catchment model WaSiM-ETH (Water Flow and Balance Simulation Model) [19]. A detailed description of the model can be found at www.wasim.ch [18]. The flexibility of WaSiM-ETH allows both short- term (flood runoff) and long-term (water balance) simu- lations. Briefly, the model considers spatial interpola-  Demand and Supply of Water for Agriculture: Influence of Topography and Climate in Pre-Alpine, Mesoscale Catchments 148 tions of meteorological data and their adjustment with respect to slope and shadowing (temperature and radia- tion), evapotranspiration, level of interception storage and evaporation from this storage, snow accumulation, snowmelt and evaporation from snow, glacier melt and runoff, surface runoff generation, soil water dynamics in pre-defined multi-layered soils, interflow generation, per- colation, groundwater recharge and water level, ground- water runoff (baseflow) and runoff concentration, dis- charge routing within river channels. Soil water dynam- ics in the unsaturated soil zone is calculated using a dis- crete formulation of the Richards equation with parame- terization after [26]. In this study, van Genuchten pa- rameters were based on values provided in [27]. The model allows simulating macro-pore fluxes and soil water extractions by multi-layered vegetation. Inter- flow is generated as layer-specific rates, depending on hydraulic potential, water content, hydraulic conductivity and gradient, and flow density (see [18]). Base flow is determined as exfiltration from the groundwater into the surface river system. Simulation of discharge routing within the river channels is based on hydraulic calcula- tions of flow velocities (kinematic wave approach). Fi- nally, aET is derived from pET [28] by accounting for the effect of soil matrix potential ( ). There are two limits of where aET starts to decrease through re- ductions in plant transpiration: one limit defines the start of stress due to water shortage and a second one marks the onset of wetness stress. 0 pwp pwp wp ws ws pwp ws os sat os sat sat os aET aET pET aET pET aET pET where θ is the volumetric water content, ψ is the matrix potential (suction), θpwp is the water content at the per- manent wilting point (|ψ| 150 m), θws is the water con- tent at which aET starts to decrease due to water limita- tion, θsat is the saturated water content, and θos is the wa- ter content at which aET starts to decrease due to water logging (oxygen stress) (see [21] for more details). Both θws and θos vary with vegetation and soil type. However, due to the lack of detailed information, θws was calcu- lated with respect to a constant suction of |ψ| = 350 hPa for all land use types, and θos was assumed for water contents > 0.95 × θsat. Vegetation parameters (e.g. LAI, cover, surface resis- tance, rooting depth) were assigned to each land use type according to the stage of vegetation development (phenol- ogy). For cropland, phenological development was de- termined dynamically using an approach that simulates the starting day of active growth and the timing of the subsequent key phenological stages based on growing- degree-days (GDD) [18,29]. Parameterization of the phenology model was based on data from Pöhler et al. [30], as described in the model description [18]. The representation of crop phenology by parameters for a single “average” crop was chosen because different crops (e.g. wheat, maize, barley, potato etc.) are usually grown in multi-year rotations and gridded crop yield statistics for each year were not available at the catchment scale. For permanent grassland, canopy development was pa- rameterized based on data from the experimental grass- land site at Oensingen, Switzerland [31], with the inter- mediate cutting dates depending on altitude. For orchards (fruit trees), simple pre-defined seasonal patterns and altitude dependency were used instead of uncertain dy- namic phenology curves [19]. 2.5. Net Irrigation Requirement, NIR NIR was estimated for each grid cell based on two methods. Method 1 was implemented as a new feature into WaSiM-ETH. The method uses the ratio between aET and pET assuming that the two terms are equal un- der non-water-limited conditions when crop yield is at a maximum. According to [22], aETpET is inversely related to the ratio between non-water-limited and actual yield of a crop with a nearly linear relationship between 1 and 0.5 for aETpET . For the present application, a value of aETpET of 1 was set at an equivalent soil matrix potential of 350 hPa for all land use types. A cut- off value for aETpET of 0.8 was used as the criteria to trigger irrigation and a value of 1 to stop irrigation. Method 2 was based on the soil matrix potential. Irriga- tion was triggered at a value of 50% of the usable field capacity (equivalent to about 1000 hPa) and stopped at 80% (equivalent to about 200 hPa). For both approaches, the time step of the simulation was one day, and daily irrigation amounts were summed up over the dynami- cally calculated growing season. 2.6. Model Calibration and Validation Calibration and validation of the hydrological model were carried out separately for each catchment. The skill of the model was assessed with respect to runoff produc- tion using daily observed data from a total of 26 runoff gauges as the reference [21]. Model calibration was per- formed with data of the period 1981-1990, and data of the period 1991-2000 were used for model validation. Besides checks of the calculated values of water balances (e.g. runoff volumes, evapotranspiration rates) and a visual Copyright © 2012 SciRes. NR 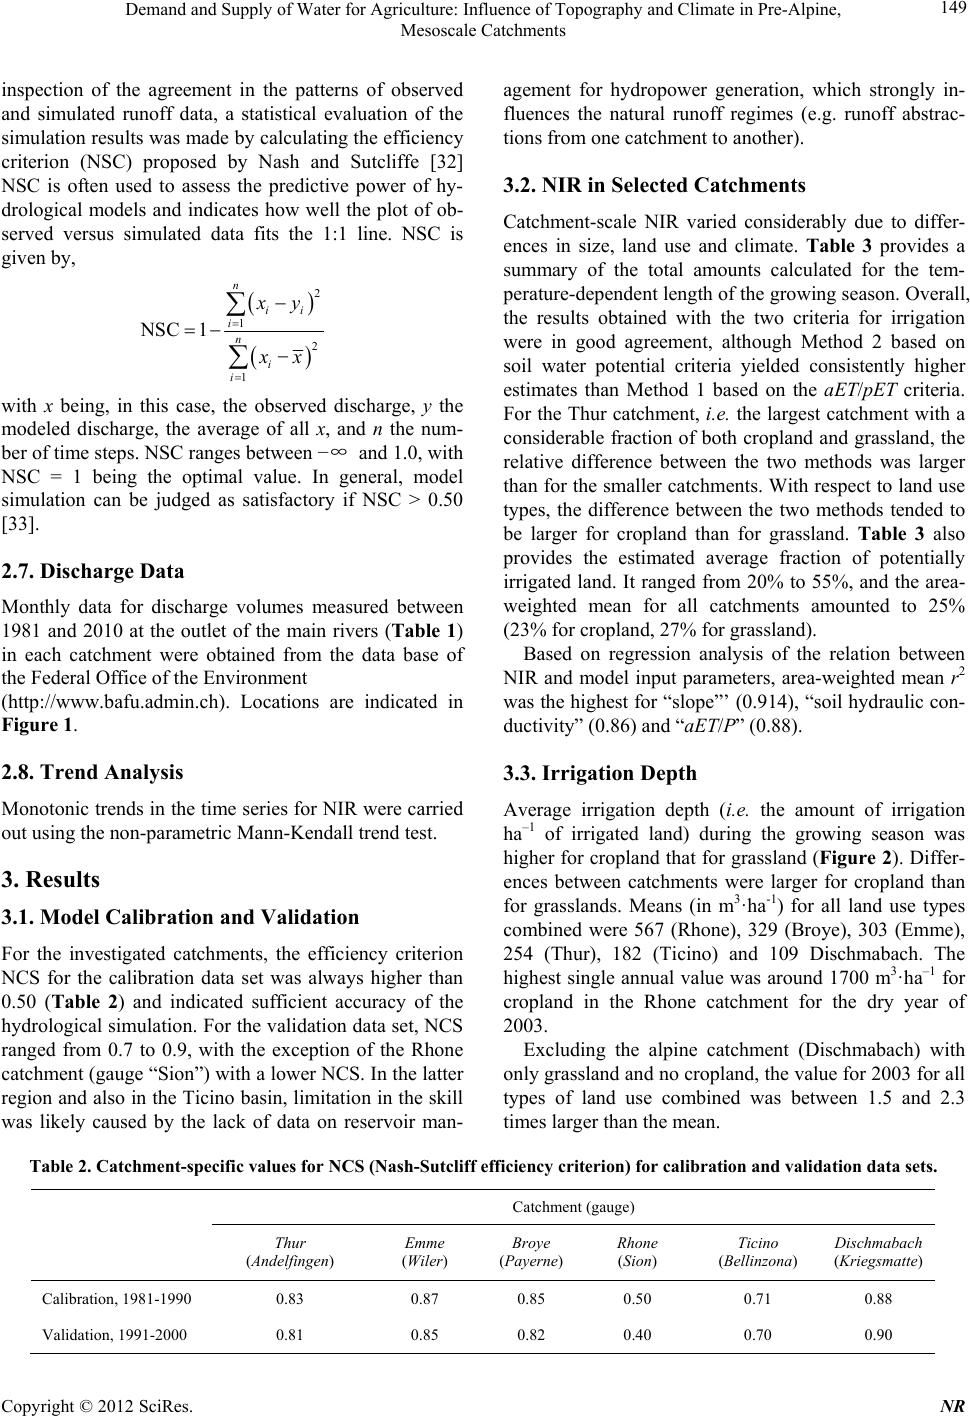 Demand and Supply of Water for Agriculture: Influence of Topography and Climate in Pre-Alpine, Mesoscale Catchments Copyright © 2012 SciRes. NR 149 agement for hydropower generation, which strongly in- fluences the natural runoff regimes (e.g. runoff abstrac- tions from one catchment to another). inspection of the agreement in the patterns of observed and simulated runoff data, a statistical evaluation of the simulation results was made by calculating the efficiency criterion (NSC) proposed by Nash and Sutcliffe [32] NSC is often used to assess the predictive power of hy- drological models and indicates how well the plot of ob- served versus simulated data fits the 1:1 line. NSC is given by, 3.2. NIR in Selected Catchments Catchment-scale NIR varied considerably due to differ- ences in size, land use and climate. Table 3 provides a summary of the total amounts calculated for the tem- perature-dependent length of the growing season. Overall, the results obtained with the two criteria for irrigation were in good agreement, although Method 2 based on soil water potential criteria yielded consistently higher estimates than Method 1 based on the aET/pET criteria. For the Thur catchment, i.e. the largest catchment with a considerable fraction of both cropland and grassland, the relative difference between the two methods was larger than for the smaller catchments. With respect to land use types, the difference between the two methods tended to be larger for cropland than for grassland. Table 3 also provides the estimated average fraction of potentially irrigated land. It ranged from 20% to 55%, and the area- weighted mean for all catchments amounted to 25% (23% for cropland, 27% for grassland). 2 1 2 1 NSC 1 n ii i n i i y x with x being, in this case, the observed discharge, y the modeled discharge, the average of all x, and n the num- ber of time steps. NSC ranges between −∞ and 1.0, with NSC = 1 being the optimal value. In general, model simulation can be judged as satisfactory if NSC > 0.50 [33]. 2.7. Discharge Data Monthly data for discharge volumes measured between 1981 and 2010 at the outlet of the main rivers (Table 1) in each catchment were obtained from the data base of the Federal Office of the Environment (http://www.bafu.admin.ch). Locations are indicated in Figure 1. Based on regression analysis of the relation between NIR and model input parameters, area-weighted mean r2 was the highest for “slope”’ (0.914), “soil hydraulic con- ductivity” (0.86) and “aET/P” (0.88). 2.8. Trend Analysis 3.3. Irrigation Depth Monotonic trends in the time series for NIR were carried out using the non-parametric Mann-Kendall trend test. Average irrigation depth (i.e. the amount of irrigation ha–1 of irrigated land) during the growing season was higher for cropland that for grassland (Figure 2). Differ- ences between catchments were larger for cropland than for grasslands. Means (in m3·ha-1) for all land use types combined were 567 (Rhone), 329 (Broye), 303 (Emme), 254 (Thur), 182 (Ticino) and 109 Dischmabach. The highest single annual value was around 1700 m3·ha–1 for cropland in the Rhone catchment for the dry year of 2003. 3. Results 3.1. Model Calibration and Validation For the investigated catchments, the efficiency criterion NCS for the calibration data set was always higher than 0.50 (Table 2) and indicated sufficient accuracy of the hydrological simulation. For the validation data set, NCS ranged from 0.7 to 0.9, with the exception of the Rhone catchment (gauge “Sion”) with a lower NCS. In the latter region and also in the Ticino basin, limitation in the skill was likely caused by the lack of data on reservoir man- Excluding the alpine catchment (Dischmabach) with only grassland and no cropland, the value for 2003 for all types of land use combined was between 1.5 and 2.3 times larger than the mean. Table 2. Catchment-specific values for NCS (Nash-Sutcliff efficiency criterion) for calibration and validation data sets. Catchment (gauge) Thur (Andelfingen) Emme (Wiler) Broye (Payerne) Rhone (Sion) Ticino (Bellinzona) Dischmabach (Kriegsmatte) Calibration, 1981-1990 0.83 0.87 0.85 0.50 0.71 0.88 Validation, 1991-2000 0.81 0.85 0.82 0.40 0.70 0.90 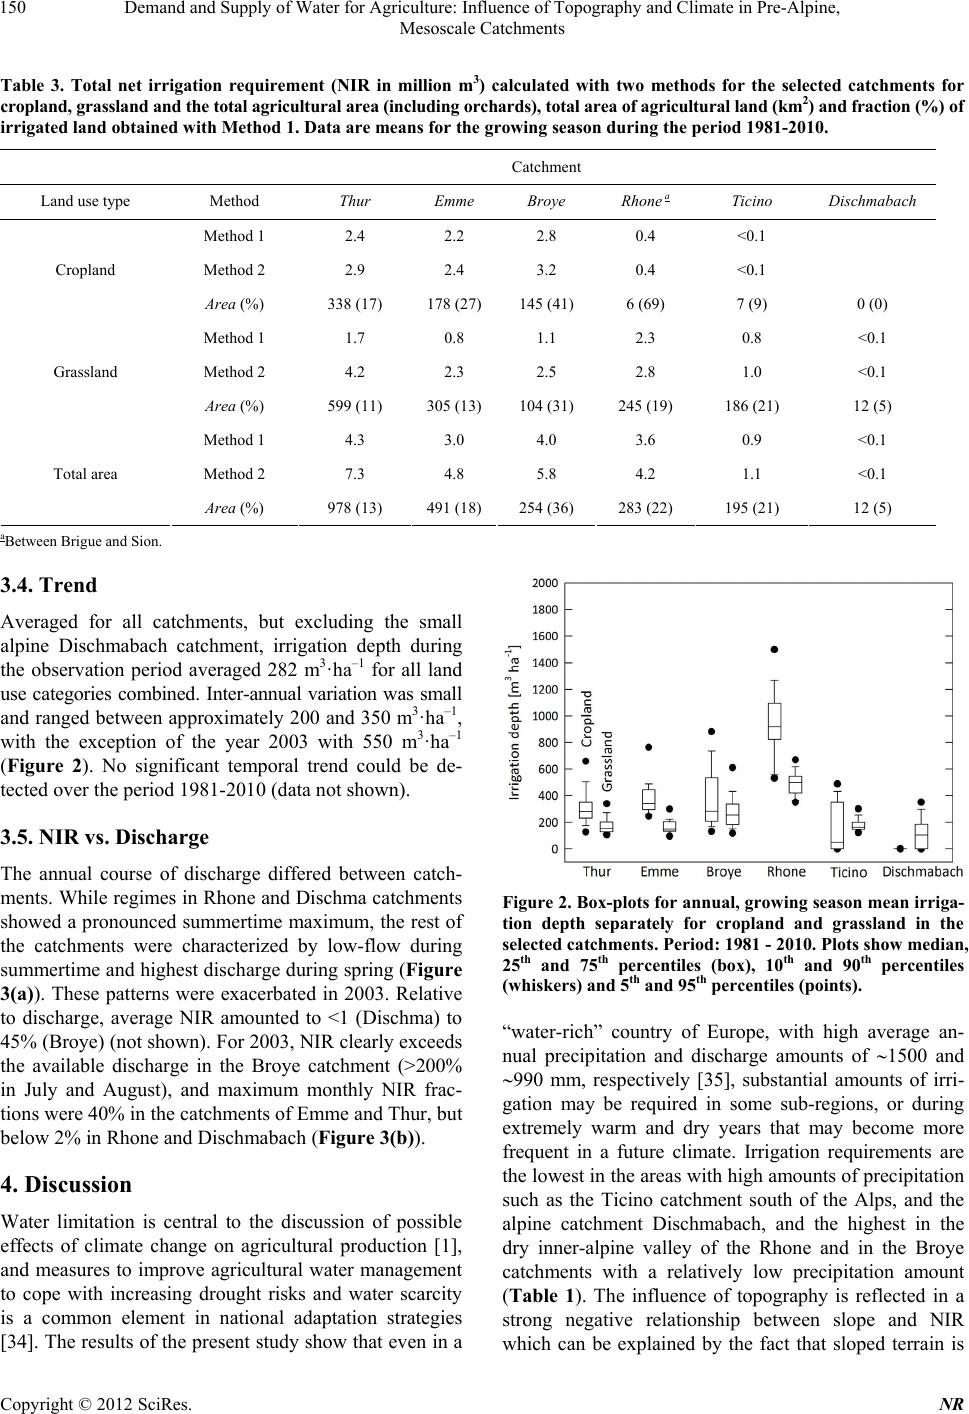 Demand and Supply of Water for Agriculture: Influence of Topography and Climate in Pre-Alpine, Mesoscale Catchments 150 Table 3. Total net irrigation requirement (NIR in million m3) calculated with two methods for the selected catchments for cropland, grassland and the total agricultural area (including orchards), total area of agricultural land (km2) and fraction (%) of irrigated land obtained with Method 1. Data are means for the growing season during the period 1981-2010. Catchment Land use type Method Thur Emme Broye Rhone a Ticino Dischmabach Method 1 2.4 2.2 2.8 0.4 <0.1 Method 2 2.9 2.4 3.2 0.4 <0.1 Cropland Area (%) 338 (17) 178 (27)145 (41) 6 (69) 7 (9) 0 (0) Method 1 1.7 0.8 1.1 2.3 0.8 <0.1 Method 2 4.2 2.3 2.5 2.8 1.0 <0.1 Grassland Area (%) 599 (11) 305 (13)104 (31) 245 (19) 186 (21) 12 (5) Method 1 4.3 3.0 4.0 3.6 0.9 <0.1 Method 2 7.3 4.8 5.8 4.2 1.1 <0.1 Total area Area (%) 978 (13) 491 (18)254 (36) 283 (22) 195 (21) 12 (5) aBetween Brigue and Sion. 3.4. Trend Averaged for all catchments, but excluding the small alpine Dischmabach catchment, irrigation depth during the observation period averaged 282 m3·ha–1 for all land use categories combined. Inter-annual variation was small and ranged between approximately 200 and 350 m3·ha–1, with the exception of the year 2003 with 550 m3·ha–1 (Figure 2). No significant temporal trend could be de- tected over the period 1981-2010 (data not shown). 3.5. NIR vs. Discharge The annual course of discharge differed between catch- ments. While regimes in Rhone and Dischma catchments showed a pronounced summertime maximum, the rest of the catchments were characterized by low-flow during summertime and highest discharge during spring (Figure 3(a)). These patterns were exacerbated in 2003. Relative to discharge, average NIR amounted to <1 (Dischma) to 45% (Broye) (not shown). For 2003, NIR clearly exceeds the available discharge in the Broye catchment (>200% in July and August), and maximum monthly NIR frac- tions were 40% in the catchments of Emme and Thur, but below 2% in Rhone and Dischmabach (Figure 3(b)). 4. Discussion Water limitation is central to the discussion of possible effects of climate change on agricultural production [1], and measures to improve agricultural water management to cope with increasing drought risks and water scarcity is a common element in national adaptation strategies [34]. The results of the present study show that even in a Figure 2. Box-plots for annual, growing season mean irr iga- tion depth separately for cropland and grassland in the selected catchments. Period: 1981 - 2010. Plots show median, 25th and 75th percentiles (box), 10th and 90th percentiles (whiskers) and 5th and 95 th percentiles (points). “water-rich” country of Europe, with high average an- nual precipitation and discharge amounts of 1500 and 990 mm, respectively [35], substantial amounts of irri- gation may be required in some sub-regions, or during extremely warm and dry years that may become more frequent in a future climate. Irrigation requirements are the lowest in the areas with high amounts of precipitation such as the Ticino catchment south of the Alps, and the alpine catchment Dischmabach, and the highest in the dry inner-alpine valley of the Rhone and in the Broye catchments with a relatively low precipitation amount (Table 1). The influence of topography is reflected in a strong negative relationship between slope and NIR which can be explained by the fact that sloped terrain is Copyright © 2012 SciRes. NR 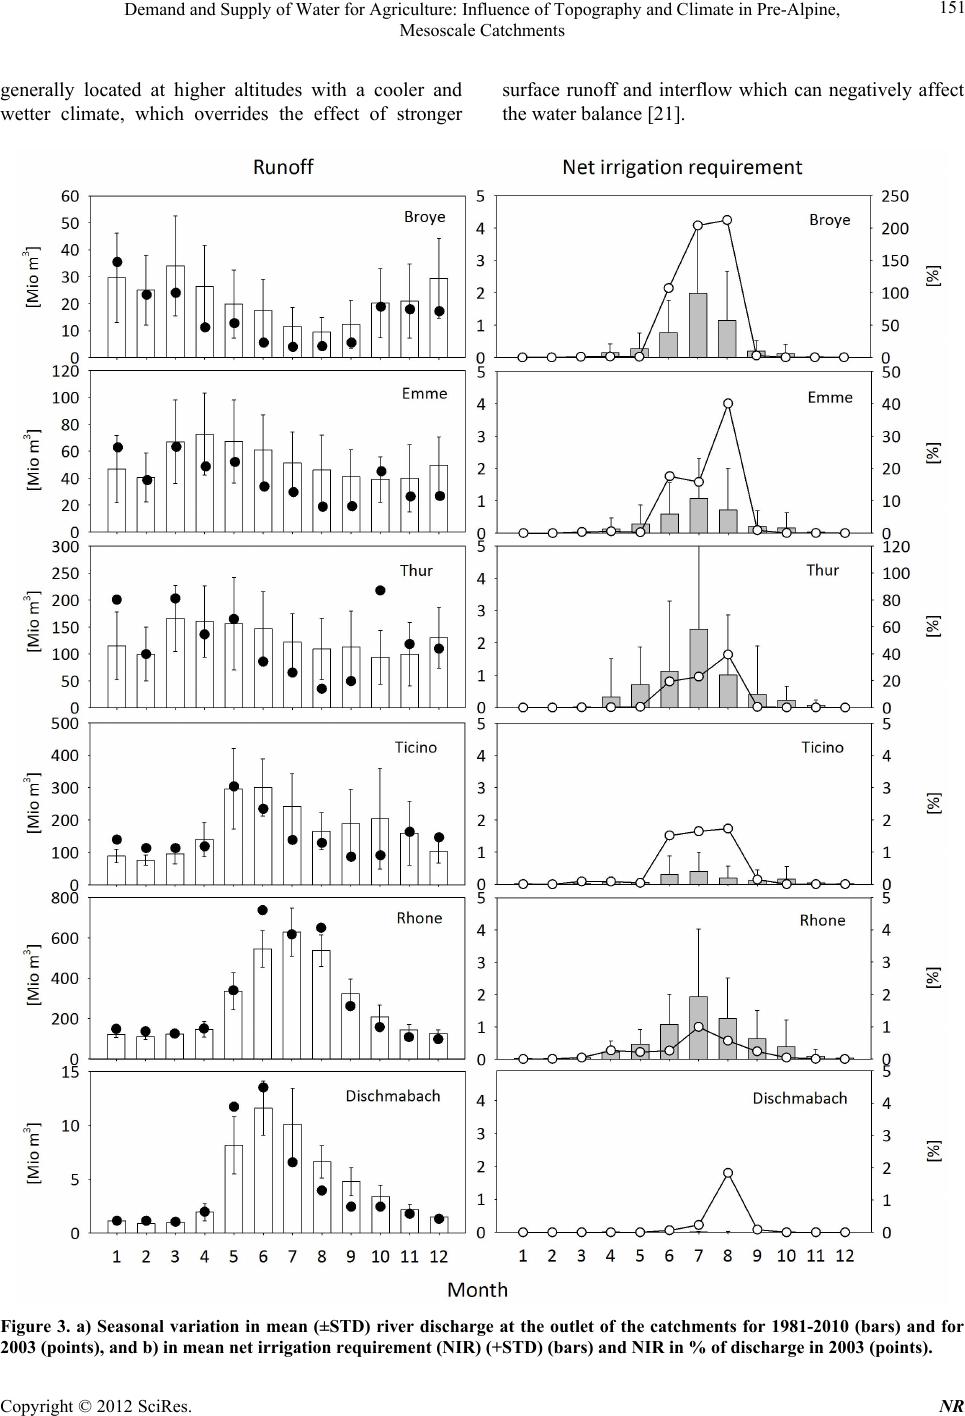 Demand and Supply of Water for Agriculture: Influence of Topography and Climate in Pre-Alpine, Mesoscale Catchments 151 generally located at higher altitudes with a cooler and wetter climate, which overrides the effect of stronger surface runoff and interflow which can negatively affect the water balance [21]. Figure 3. a) Seasonal variation in mean (±STD) river discharge at the outlet of the catchments for 1981-2010 (bars) and for 2003 (points), and b) in mean net irrigation requirement (NIR) (+STD) (bars) and NIR in % of discharge in 2003 (points). Copyright © 2012 SciRes. NR  Demand and Supply of Water for Agriculture: Influence of Topography and Climate in Pre-Alpine, Mesoscale Catchments 152 The results reveal that irrigation depth in some regions can reach values well above 1000 m3·ha–1. Such high values are not evident from larger-scale studies with resolutions of 10 × 10 km grid cells [13]. Thus, a high degree of detail is necessary to identify small hotspots of water demand in a highly structured pre-alpine landscape with heterogeneous climatic conditions and pronounced effects of topography. Higher values resulted from the EPIC simulations for neighboring countries such as Germany (1010 m3·ha–1), France (4050 m3·ha–1) or Italy (9130 m3·ha–1) [17]. The difference may reflect differences in soil texture and cli- mate between regions in which irrigation is applied. Here, for a warm/dry region such as the inner-alpine Rhone Valley, the estimated mean is 948 m3·ha–1 for cropland, and over 1700 m3·ha–1 in a dry year, as in 2003. However, the comparison between results from different studies may be biased because of differences in the methodology, including model parameterization with respect to soil (e.g. van Genuchten parameters) and vegetation; for in- stance, Wriedt et al. [17] used parameters for a “repre- sentative” crop in five main crop categories, and van der Velde et al. [14] used specific parameters for maize in France, while in the present study parameters for a single “average crop” were used based on data from Germany [30]. This simplification was necessary because spatially explicit statistical data for crops are not available at the scale of interest, and because crops are almost exclu- sively grown in multi-crop rotations and thus over time, different crops such as maize, winter wheat and root crops may be present in each grid. Hence, differences in crop-specific water requirements during the different phenological stages, as described by specific crop coeffi- cients provided in the literature [22], are ignored here, but they could be included in more detailed modeling for regions where spatially explicit crop statistics are avail- able. The uncertainty may be less important for perennial grasslands than for arable crops because water use is less dependent on phenological changes during the growing season. It should also be noted that the present study covers a 30-year period, while other mean estimates are based on different and often much shorter periods. NIR estimates were obtained with two different meth- ods for irrigation triggering. The results for the two methods agree reasonably well, although estimates with Method 2 are systematically higher than those obtained with Method 1. Method 2 follows common practical recommendations for irrigation control (e.g. [36]); it is based on criteria for soil matrix potential with 200 hPa as the value to stop irrigation. In contrast, Method 1 is based on criteria for aETpET and uses a value of 1 as the stop value, which was set here to a matrix potential of 350 hPa. Through a direct comparison for selected sites, it could be observed that the different criteria for the start of irrigation consistently leads to more frequent but shorter irrigation periods with Method 1 than with Method 2, which results in lower irrigation totals at the end of the season (data not shown). Clearly, the outcome of any calculation of NIR is sensitive to the choice of these criteria and leads to different irrigation strategies [17]. The criteria used here are set to obtain a maximum theoretical water requirement for irrigation. In reality, irrigation may be limited by economic considerations or lack of access to water or suitable technologies. The annual data for the observation period reveal no apparent upward or downward trend with time, although in all regions of Switzerland mean temperature during the growing season has increased by about 2˚C over the time period considered (according to data from Meteo- Suisse at www.meteosuisse.ch). According to the Pen- man-Monteith relationship, for each degree of warming pET should increase by some 2% - 3% thus leading to a corresponding increase in evaporative water use by crops of less than 10% [37]. Unlike temperature, precipitation amount did not change significantly between 1981 and 2010. Hence, the extent of climatic changes need to be more substantial in order to cause significantly increased pETP ratio and, consequently, detectable changes in irrigation requirement. The effect of lower precipitation in combination with a small positive difference in tem- perature is illustrated by the difference in irrigation depth for crops between the Rhone catchment (948 m3·ha–1) with an average seasonal precipitation amount (April to September) of below 488 mm and an average tempera- ture of 14.1˚C (Table 1), and the Thur catchment on the Central Plateau (307 m3·ha–1) with 825 mm precipitation and a mean temperature of 14.7˚C (Table 1). Hence, any trend in irrigation requirement during the next decades may depend primarily on changes in precipitation rather than temperature, but projections of future precipitation changes at the relevant scales of resolution remain highly uncertain [38]. For Switzerland, summer precipitation is projected to decline between 21% and 27% by 2085 (2070-2099) relative to 1980-2009 when assuming the SRES A2 emission scenario [39]. This decrease may be much more relevant to NIR in the currently driest re- gions. The summer of 2003, which caused significant crop losses in Switzerland [40] and elsewhere in Europe is often considered indicative of prevailing conditions in Switzerland towards the end of the 21st century [41]. This trend would lead more frequently to limiting soil mois- ture [1]. Calanca [42] estimated that the risk to reach critical soil moisture conditions for crop production on the Central Plateau could increase from 15% during the next 100 years to about 50%. The simulated decrease in Copyright © 2012 SciRes. NR 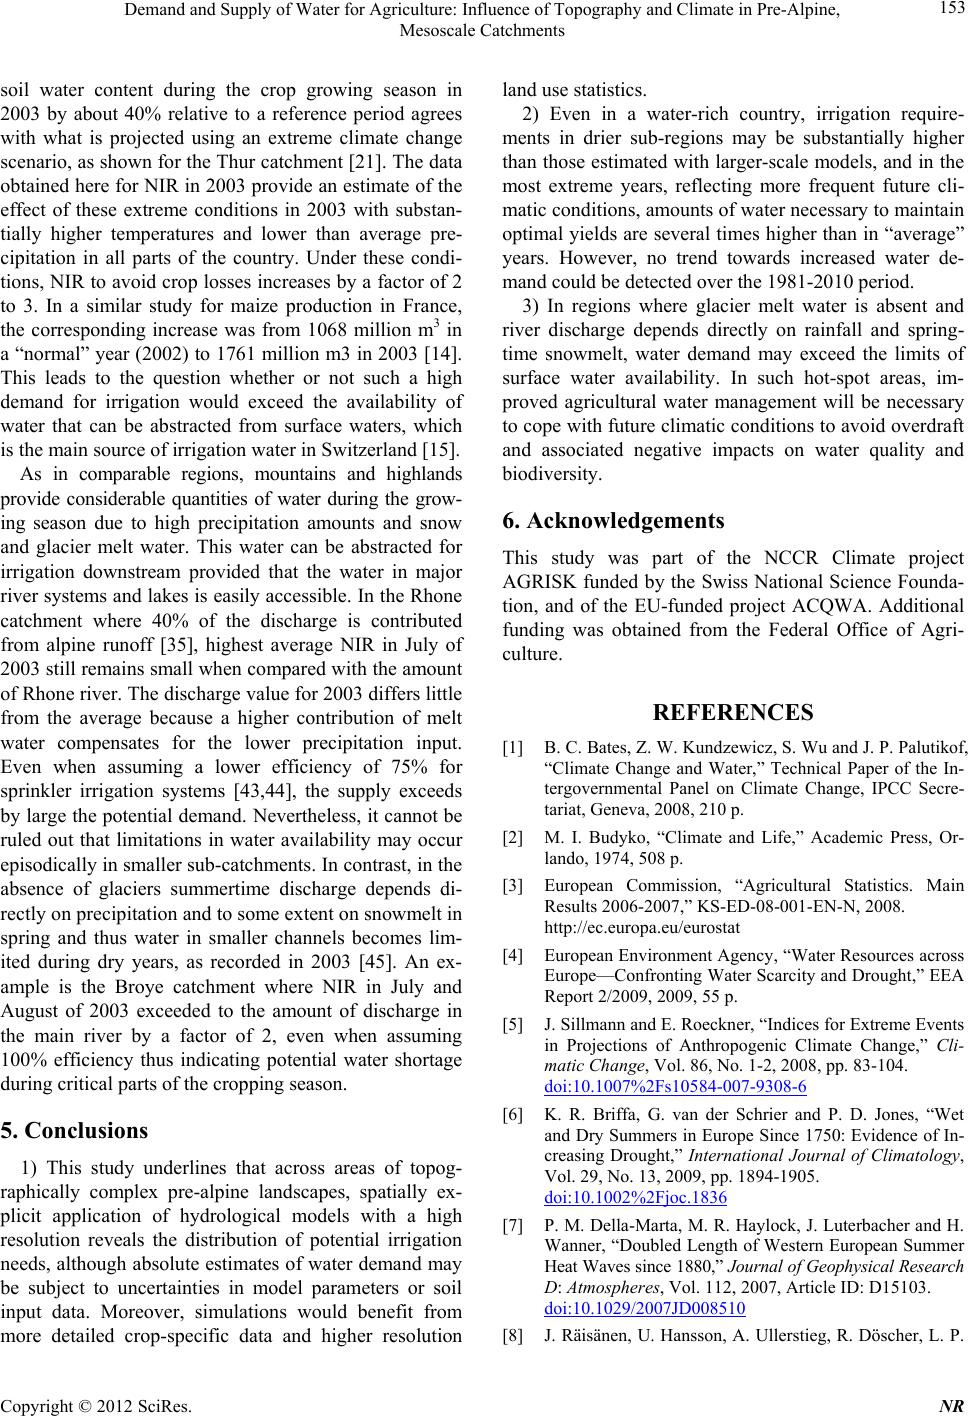 Demand and Supply of Water for Agriculture: Influence of Topography and Climate in Pre-Alpine, Mesoscale Catchments 153 soil water content during the crop growing season in 2003 by about 40% relative to a reference period agrees with what is projected using an extreme climate change scenario, as shown for the Thur catchment [21]. The data obtained here for NIR in 2003 provide an estimate of the effect of these extreme conditions in 2003 with substan- tially higher temperatures and lower than average pre- cipitation in all parts of the country. Under these condi- tions, NIR to avoid crop losses increases by a factor of 2 to 3. In a similar study for maize production in France, the corresponding increase was from 1068 million m3 in a “normal” year (2002) to 1761 million m3 in 2003 [14]. This leads to the question whether or not such a high demand for irrigation would exceed the availability of water that can be abstracted from surface waters, which is the main source of irrigation water in Switzerland [15]. As in comparable regions, mountains and highlands provide considerable quantities of water during the grow- ing season due to high precipitation amounts and snow and glacier melt water. This water can be abstracted for irrigation downstream provided that the water in major river systems and lakes is easily accessible. In the Rhone catchment where 40% of the discharge is contributed from alpine runoff [35], highest average NIR in July of 2003 still remains small when compared with the amount of Rhone river. The discharge value for 2003 differs little from the average because a higher contribution of melt water compensates for the lower precipitation input. Even when assuming a lower efficiency of 75% for sprinkler irrigation systems [43,44], the supply exceeds by large the potential demand. Nevertheless, it cannot be ruled out that limitations in water availability may occur episodically in smaller sub-catchments. In contrast, in the absence of glaciers summertime discharge depends di- rectly on precipitation and to some extent on snowmelt in spring and thus water in smaller channels becomes lim- ited during dry years, as recorded in 2003 [45]. An ex- ample is the Broye catchment where NIR in July and August of 2003 exceeded to the amount of discharge in the main river by a factor of 2, even when assuming 100% efficiency thus indicating potential water shortage during critical parts of the cropping season. 5. Conclusions 1) This study underlines that across areas of topog- raphically complex pre-alpine landscapes, spatially ex- plicit application of hydrological models with a high resolution reveals the distribution of potential irrigation needs, although absolute estimates of water demand may be subject to uncertainties in model parameters or soil input data. Moreover, simulations would benefit from more detailed crop-specific data and higher resolution land use statistics. 2) Even in a water-rich country, irrigation require- ments in drier sub-regions may be substantially higher than those estimated with larger-scale models, and in the most extreme years, reflecting more frequent future cli- matic conditions, amounts of water necessary to maintain optimal yields are several times higher than in “average” years. However, no trend towards increased water de- mand could be detected over the 1981-2010 period. 3) In regions where glacier melt water is absent and river discharge depends directly on rainfall and spring- time snowmelt, water demand may exceed the limits of surface water availability. In such hot-spot areas, im- proved agricultural water management will be necessary to cope with future climatic conditions to avoid overdraft and associated negative impacts on water quality and biodiversity. 6. Acknowledgements This study was part of the NCCR Climate project AGRISK funded by the Swiss National Science Founda- tion, and of the EU-funded project ACQWA. Additional funding was obtained from the Federal Office of Agri- culture. REFERENCES [1] B. C. Bates, Z. W. Kundzewicz, S. Wu and J. P. Palutikof, “Climate Change and Water,” Technical Paper of the In- tergovernmental Panel on Climate Change, IPCC Secre- tariat, Geneva, 2008, 210 p. [2] M. I. Budyko, “Climate and Life,” Academic Press, Or- lando, 1974, 508 p. [3] European Commission, “Agricultural Statistics. Main Results 2006-2007,” KS-ED-08-001-EN-N, 2008. http://ec.europa.eu/eurostat [4] European Environment Agency, “Water Resources across Europe—Confronting Water Scarcity and Drought,” EEA Report 2/2009, 2009, 55 p. [5] J. Sillmann and E. Roeckner, “Indices for Extreme Events in Projections of Anthropogenic Climate Change,” Cli- matic Change, Vol. 86, No. 1-2, 2008, pp. 83-104. doi:10.1007%2Fs10584-007-9308-6 [6] K. R. Briffa, G. van der Schrier and P. D. Jones, “Wet and Dry Summers in Europe Since 1750: Evidence of In- creasing Drought,” International Journal of Climatology, Vol. 29, No. 13, 2009, pp. 1894-1905. doi:10.1002%2Fjoc.1836 [7] P. M. Della-Marta, M. R. Haylock, J. Luterbacher and H. Wanner, “Doubled Length of Western European Summer Heat Waves since 1880,” Journal of Geophysical Research D: Atmospheres, Vol. 112, 2007, Article ID: D15103. doi:10.1029/2007JD008510 [8] J. Räisänen, U. Hansson, A. Ullerstieg, R. Döscher, L. P. Copyright © 2012 SciRes. NR  Demand and Supply of Water for Agriculture: Influence of Topography and Climate in Pre-Alpine, Mesoscale Catchments 154 Graham, C. Jones, H. E. M. Meier, P. Samuelson and U. Willén, “European Climate in the Late Twenty-First Century: Regional Simulations With Two Driving Global Models and Two Forcing Scenarios,” Climate Dynamics, Vol. 22, No. 1, 2004, pp. 13-31. doi:10.1007/s00382-003-0365-x [9] J. Fuhrer, M. Beniston, A. Fischlin, Ch. Frei, S. Goyette, K. Jasper and C. Pfister, “Climate Risks and Their Impact on Agricultural Land and Forests in Switzerland,” Cli- mate Change, Vol. 79, No. 1-2, 2006, pp. 79-102. doi:10.1007/s10584-006-9106-6 [10] M. Beniston, “The 2003 Heat Wave in Europe. A shape of Things to Come?” Geophysical Research Letters, Vol. 31, 2004, pp. 2022-2026. doi:10.1029/2003GL018857 [11] European Environment Agency, “Vulnerability and Ad- aptation to Climate Change in Europe,” 2005, 79 p. [12] European Commission, “Drought Management Report,” Technical Report, 2008, 109 p. [13] G. Wriedt, M. van der Velde, A. Aloe and F. Bouraoui, “A European Irrigation Map for Spatially Distributed Ag- ricultural Modeling,” Agricultural Water Management, Vol. 96, No. 5, 2009, pp. 771-789. doi:10.1016/j.agwat.2008.10.012 [14] G. van der Velde, G. Wriedt and F. Bouraoui, “Estimating Irrigation Use and Effects on Maize Yield during the 2003 Heatwave in France. Agriculture, Ecosystems and Environment, Vol. 135, No. 1-2, 2010, pp. 90-97. doi:10.1016/j.agee.2009.08.017 [15] M. Weber and A. Schild, “Stand der Bewässerung in der Schweiz. Bericht zur Umfrage 2006,” Report, Federal Of- fice of Agriculture, Bern, 2007, 17 p. [16] P. Döll and S. Siebert, “Global Modeling of Irrigation Water Requirements,” Water Resources Research, Vol. 38, 2002, pp. 8.1-8.10. doi:10.1029/2001WRR000355 [17] G. Wriedt, M. van der Velde, A. Aloe and F. Bouraoui, “Estimating Irrigation Requirements in Europe,” Journal of Hydrology, Vol. 373, No. 3-4, 2009, pp. 527-544. doi:10.1016/j.jhydrol.2009.05.018 [18] J. Schulla, “Model Description WaSim,” Technical Re- port, 2012, 300 p. www.wasim.ch [19] J. Schulla, “Hydrologische Modellierung von Flussgebieten zur Abschätzung der Folgen von Klimaänderungen (Hydrological Modelling of River Basins for Estimating the Effects of Climate Change),” Zürcher Geographische Schriften 69, 1997, ETH Zurich, Switzerland. [20] J. Kleinn, C. Frei, J. Gurtz, D. Lüthi, P. L. Vidale and C. Schär, “Hydrologic Simulations in the Rhine Basin Driven by a Regional Climate Model,” Journal of Geo- physical Research, Vol. 110, 2004, Article ID: D04102. doi:10.1029/2004JD005143 [21] K. Jasper, P. Calanca and J. Fuhrer, “Changes in Sum- mertime Soil Water Patterns in Complex Terrain Due to Climatic Change,” Journal of Hydrology, Vol. 327, No. 3-4, 2006, pp. 550-563. doi:10.1016/j.jhydrol.2005.11.061 [22] J. Doorenbos and A. H. Kassam, “Yield Response to Water,” FAO Irrigation and Drainage Paper No. 56. Rome, 1979, 193 p. [23] J. Schulla and K. Jasper, “Model Description WaSiM- ETH,” 2007. www.wasim.ch [24] G. Müller, “Die Beobachtungsnetze der Schweizerischen Meteorologischen Anstalt. Konzept 1980,” Arbeitsberichte der Schweizerischen Meteorologischen Anstalt, Nr. 93, 1980, Anhang Ib. Zürich. [25] Bundesamt für Statistik, “Die Digitale Bodeneignungskarte der Schweiz. Überarbeitung 2000,” Federal Office of Sta- tistics, Neuchatel, 2004. www.bfs.admin.ch [26] M. T. van Genuchten, “A closed-Form Equation for Pre- dicting the Hydraulic Conductivity of Unsaturated Soils,” Soil Science Society of America Journal, Vol. 44, No. 5, 1980, pp. 892-898. doi:10.2136/sssaj1980.03615995004400050002x [27] R. F. Carsel and R. S. Parrish, “Developing Joint Prob- ability Distributions of Soil Water Retention Characteris- tics,” Water Resources Research, Vol. 24, No. 5, 1988, pp. 755-769. doi:10.1029/WR024i005p00755 [28] J. L. Monteith and M. H. Unsworth, “Principles of Envi- ronmental Physics,” 2nd Edition, Edward Arnold, London, 1990. [29] F. M. Chmielewski, Y. Henniges, B. Schultze, H. Pöhler and J. Scherzer, “Weiterentwicklung von WaSiM-ETH und Coupmodel—Implementierung Flexibler Vegetation- sperioden (KliWEP-Phänologie—Forstmodul). Abschlus- sbericht,” Sächsische Landesanstalt für Landwirtschaft, Dresden, 2007, 37 p. [30] H. Pöhler, F. M. Chmielewski, K. Jasper, Y. Henniges and J. Scherzer, “KliWEP—Abschätzung der Auswirkungen der für Sachsen Prognostizierten Klimaveränderungen auf den Wasser-und Stoffhaushalt im Einzugsgebiet der Parthe Weiterentwicklung von WaSiM-ETH: Implikation Dyna- mischer Vegetationszeiten und Durchführung von Test- simulationen für Sächsische Klimaregionen,” Sächsische Landesamt für Umwelt und Geologie, Dresden, 2007, 74 p. [31] C. Ammann, C. Spirig, J. Leifeld and A. Neftel, “Assess- ment of the Nitrogen and Carbon Budget of Two Man- aged Temperate Grassland Fields,” Agriculture Ecosys- tems and Environment, Vol. 133, No. 3-4, 2009, pp. 150- 162. doi:10.1016/j.agee.2009.05.006 [32] J. E. Nash and J. V. Sutcliffe, “River Flow Forecasting Through Conceptual Models. Part I. A Discussion of Principles,” Journal of Hydrology, Vol. 10, No. 3, 1970, pp. 282-290. doi:10.1016/0022-1694(70)90255-6 [33] D. N. Moriasi, J. G. Arnold, M. W. Van Liew, R. L. Bingner, R. D. Harmel and T. L. Veith, “Model Evalua- tion Guidelines For Systematic Quantification of Accu- racy in Watershed Simulations,” Transactions of the ASABE, Vol. 50, No. 3, 2007, pp. 885-900. http://naldc.nal.usda.gov/download/9298 /PDF [34] G. R. Biesbroek, R. J. Swart, T. R. Carter, C. Cowan, T. Henrichs, H. Mela, M. D. Morecroft and D. Rey, “Europe Adapts To Climate Change: Comparing National Adapta- tion Strategies,” Global Environmental Change, Vol. 20, Copyright © 2012 SciRes. NR  Demand and Supply of Water for Agriculture: Influence of Topography and Climate in Pre-Alpine, Mesoscale Catchments Copyright © 2012 SciRes. NR 155 3, 2010, pp. 440-450. doi:10.1016/j.gloenvcha.2010.03.005 [35] R. Weingartner, D. Viviroli and B. Schädler, “Water Re- sources in Mountain Regions: A Methodological Ap- proach to Assess the Water Balance in a Highland- Lowland System,” Hydrological Processes, Vol. 21, No. 5, 2007, pp. 578-585. doi:10.1002/hyp.6268 [36] A. Lüttger, B. Dittmann and H. Sourell, “Leitfaden zur Beregnung Landwirtschaftlicher Kulturen,“ Schriftenreihe des Landesamtes für Verbraucherschutz, Landwirtschaft und Flurneuordnung, Bd 6, Heft IV, Potsdam, 2005, 16 p. [37] J. Fuhrer, “Sustainability of Crop Production Systems under Climate Change,” In: P. C. D. Newton, R. A. Car- ran, G. R. Edwards and P. A. Niklaus, Eds., Agroecosys- tems in a Changing Climate, CRC Press, Boca Raton, 2007, pp. 167-185. [38] D. Maraun, F. Wetterhall, A. M. Ireson, R. E. Chandler, E. J. Kendon, M. Widmann, S. Brienen, H. W. Rust, T. Sau- ter, M. Themessl, V. K. C. Venema, K. P. Chun, C. M. Goodess, R. G. Jones, C. Onof, M. Vrac and I. Thiele-Eich, “Precipitation Downscaling under Climate Change. Recent Developments to Bridge the Gap between Dynamical Models and the End User,” Reviews of Geo- physics, Vol. 48, 2010, Article ID: RRG3003. doi:10.1029/2009RG000314. [39] CH2011, “Swiss Climate Change Scenarios CH2011,” C2SM, MeteoSwiss, ETH, NCCR Climate, and OcCC, Zurich, 2011, 88 p. [40] F. Keller and J. Fuhrer, “Die Landwirtschaft und der Hitzesommer 2003,” Agrarforschung, Vol. 11, No. 9, 2004, pp. 403-410 [41] C. Schär, P. L. Vidale, D. Lüthi, C. Frei, C. Häberli, M. Liniger and C. Appenzeller, “The Role of Increasing Temperature Variability for European Summer Heat Waves,” Nature, Vol. 427, No. 6972, 2004, pp. 332-336. doi:10.1038/nature02300 [42] P. Calanca, “Climate Change and Drought Occurrence in The Alpine Region: How Severe Are Becoming the Ex- tremes?” Global and Planetary Change, Vol. 57, No. 1-2, 2006, pp. 151-160. doi:10.1016/j.gloplacha.2006.11.001 [43] C. Brouwer, K. Prins and M. Heibloem, “Irrigation Water Management: Irrigation Scheduling,” Training Manual No. 4, 1989, Food and Agriculture Organization, Rome, 43 p. [44] T. A. Howell, “Irrigation Efficiency,” In: T. A. Howell, Ed., Encyclopedia of Water Science, Marcel Dekker Inc., New York, 2003, pp. 467-472. doi:10.1081/E-EWS 120010252 [45] ProClim, “Hitzesommer 2003,” Synthesebericht, Bern, 2004, 28 p.
|