Paper Menu >>
Journal Menu >>
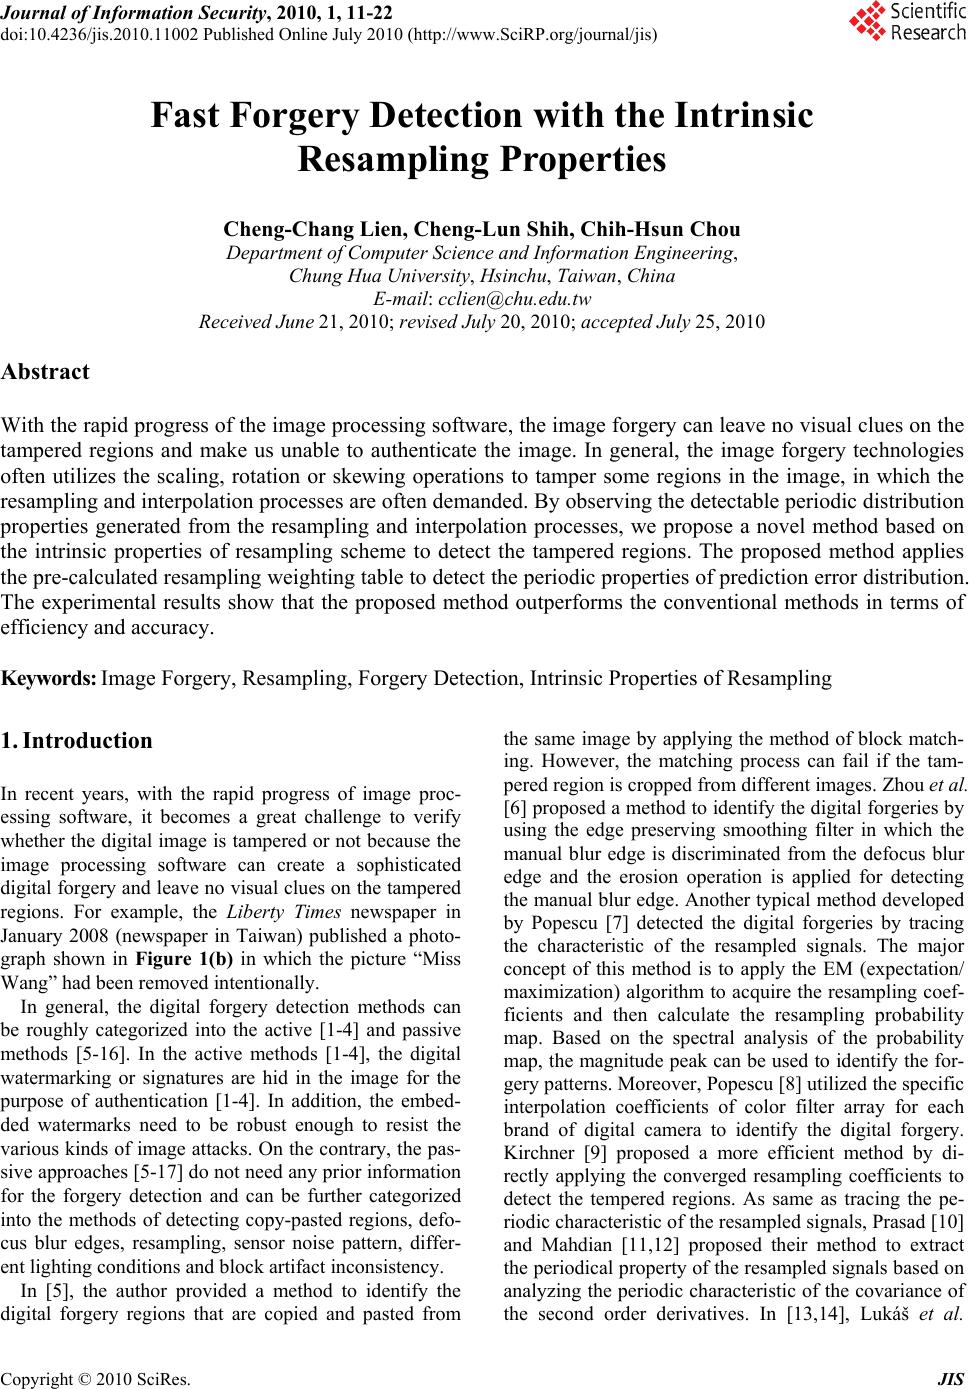 Journal of Information Security, 2010, 1, 11-22 doi:10.4236/jis.2010.11002 Published Online July 2010 (http://www.SciRP.org/journal/jis) Copyright © 2010 SciRes. JIS Fast Forgery Detection with the Intrinsic Resampling Properties Cheng-Chang Lien, Cheng-Lun Shih, Chih-Hsun Chou Department of C om put er Science and Inform at i on E ngineering, Chung Hua University, Hsinchu, Taiwan, China E-mail: cclien@chu.edu.tw Received June 21 , 2010; revised July 20, 2010; accepted July 25, 2010 Abstract With the rapid progress of the image processing software, the image forgery can leave no visual clues on the tampered regions and make us unable to authenticate the image. In general, the image forgery technologies often utilizes the scaling, rotation or skewing operations to tamper some regions in the image, in which the resampling and interpolation processes are often demanded. By observing the detectable periodic distribution properties generated from the resampling and interpolation processes, we propose a novel method based on the intrinsic properties of resampling scheme to detect the tampered regions. The proposed method applies the pre-calculated resampling weighting table to detect the periodic properties of prediction error distribution. The experimental results show that the proposed method outperforms the conventional methods in terms of efficiency and accuracy. Keywords: Image Forgery, Resampling, Forgery Detection, Intrinsic Properties of Resampling 1. Introduction In recent years, with the rapid progress of image proc- essing software, it becomes a great challenge to verify whether the digital image is tampered or not because the image processing software can create a sophisticated digital forgery and leav e no visual clues on the tampered regions. For example, the Liberty Times newspaper in January 2008 (newspaper in Taiwan) published a photo- graph shown in Figure 1(b) in which the picture “Miss Wang” had been removed intentional l y . In general, the digital forgery detection methods can be roughly categorized into the active [1-4] and passive methods [5-16]. In the active methods [1-4], the digital watermarking or signatures are hid in the image for the purpose of authentication [1-4]. In addition, the embed- ded watermarks need to be robust enough to resist the various kinds of image attacks. On the contrary, the pas- sive approaches [5-17] do not need any prior information for the forgery detection and can be further categorized into the methods of detecting copy-pasted regions, defo- cus blur edges, resampling, sensor noise pattern, differ- ent lighting conditions and block artifact inconsistency. In [5], the author provided a method to identify the digital forgery regions that are copied and pasted from the same image by applying the method of block match- ing. However, the matching process can fail if the tam- pered region is cropped from different images. Zhou et al. [6] proposed a method to identify the digital forgeries by using the edge preserving smoothing filter in which the manual blur edge is discriminated from the defocus blur edge and the erosion operation is applied for detecting the manual blur edge. Another typical method developed by Popescu [7] detected the digital forgeries by tracing the characteristic of the resampled signals. The major concept of this method is to apply the EM (expectation/ maximization) algorithm to acquire the resampling coef- ficients and then calculate the resampling probability map. Based on the spectral analysis of the probability map, the magnitude peak can be used to identify the for- gery patterns. Moreover, Popescu [8] utilize d the specific interpolation coefficients of color filter array for each brand of digital camera to identify the digital forgery. Kirchner [9] proposed a more efficient method by di- rectly applying the converged resampling coefficients to detect the tempered regions. As same as tracing the pe- riodic characteristic of the resa mpled signals, Prasad [10 ] and Mahdian [11,12] proposed their method to extract the periodical property of the resampled signals based on analyzing the periodic characteristic of the covariance of the second order derivatives. In [13,14], Lukáš et al. 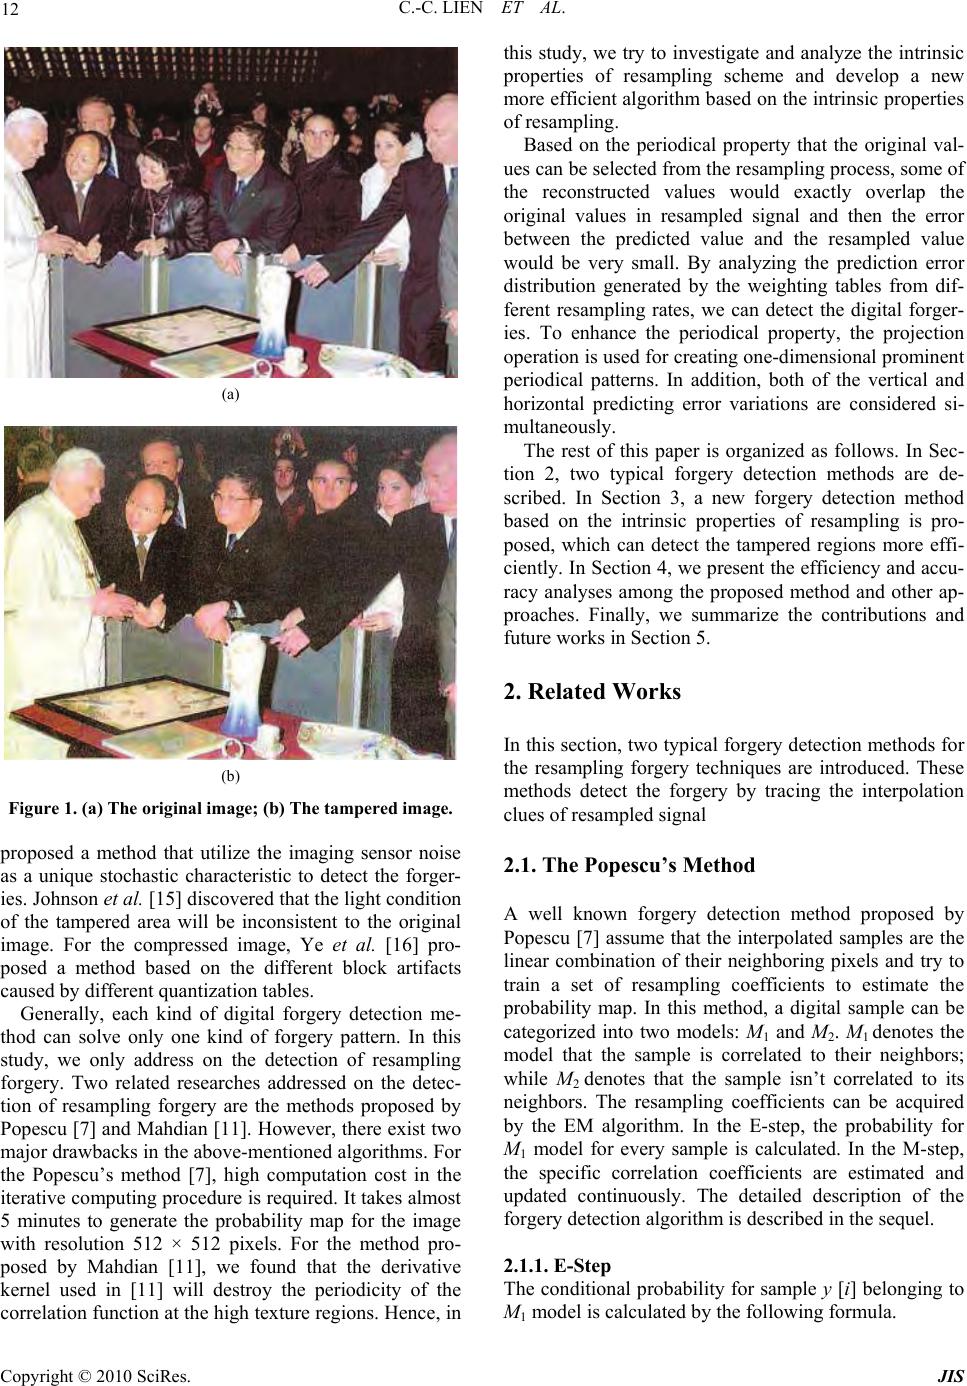 12 C.-C. LIEN ET AL. (a) (b) Figure 1. (a) The original image; (b) The tampered image. proposed a method that utilize the imaging sensor noise as a unique stochastic characteristic to detect the forger- ies. Johnson et al. [15] discovered that the light condition of the tampered area will be inconsistent to the original image. For the compressed image, Ye et al. [16] pro- posed a method based on the different block artifacts caused by different quantization tables. Generally, each kind of digital forgery detection me- thod can solve only one kind of forgery pattern. In this study, we only address on the detection of resampling forgery. Two related researches addressed on the detec- tion of resampling forgery are the methods proposed by Popescu [7] and Mahdian [11]. Howev er, there exist two major dr awb ack s in th e abov e-me ntio n ed a lgor ithms . F or the Popescu’s method [7], high computation cost in the iterative computing procedure is required . It takes almost 5 minutes to generate the probability map for the image with resolution 512 × 512 pixels. For the method pro- posed by Mahdian [11], we found that the derivative kernel used in [11] will destroy the periodicity of the correlation function at the high texture regions. Hence, in this study, we try to investigate and analyze the intrinsic properties of resampling scheme and develop a new more efficient algorithm based on the intrinsic properties of resampling. Based on the periodical property that the original val- ues can be selected from the resampling process, some of the reconstructed values would exactly overlap the original values in resampled signal and then the error between the predicted value and the resampled value would be very small. By analyzing the prediction error distribution generated by the weighting tables from dif- ferent resampling rates, we can detect the digital forger- ies. To enhance the periodical property, the projection operation is used for creating one-dimensiona l prominent periodical patterns. In addition, both of the vertical and horizontal predicting error variations are considered si- multaneously. The rest of this paper is organized as follows. In Sec- tion 2, two typical forgery detection methods are de- scribed. In Section 3, a new forgery detection method based on the intrinsic properties of resampling is pro- posed, which can detect the tampered regions more effi- ciently. In Section 4, we present the efficiency and accu- racy analyses among the proposed method and other ap- proaches. Finally, we summarize the contributions and future works in Section 5. 2. Related Works In this section, two typical forgery detection methods for the resampling forgery techniques are introduced. These methods detect the forgery by tracing the interpolation clues of resampled signal 2.1. The Popescu’s Method A well known forgery detection method proposed by Popescu [7] assume that the interpolated samples are the linear combination of their neighboring pixels and try to train a set of resampling coefficients to estimate the probability map. In this method, a digital sample can be categorized into two models: M1 and M2. M1 denotes the model that the sample is correlated to their neighbors; while M2 denotes that the sample isn’t correlated to its neighbors. The resampling coefficients can be acquired by the EM algorithm. In the E-step, the probability for M1 model for every sample is calculated. In the M-step, the specific correlation coefficients are estimated and updated continuously. The detailed description of the forgery detection algorithm is described in the sequel. 2.1.1. E-Step The conditional probability for sample y [i] belonging to M1 model is calculated by the following formula. Copyright © 2010 SciRes. JIS 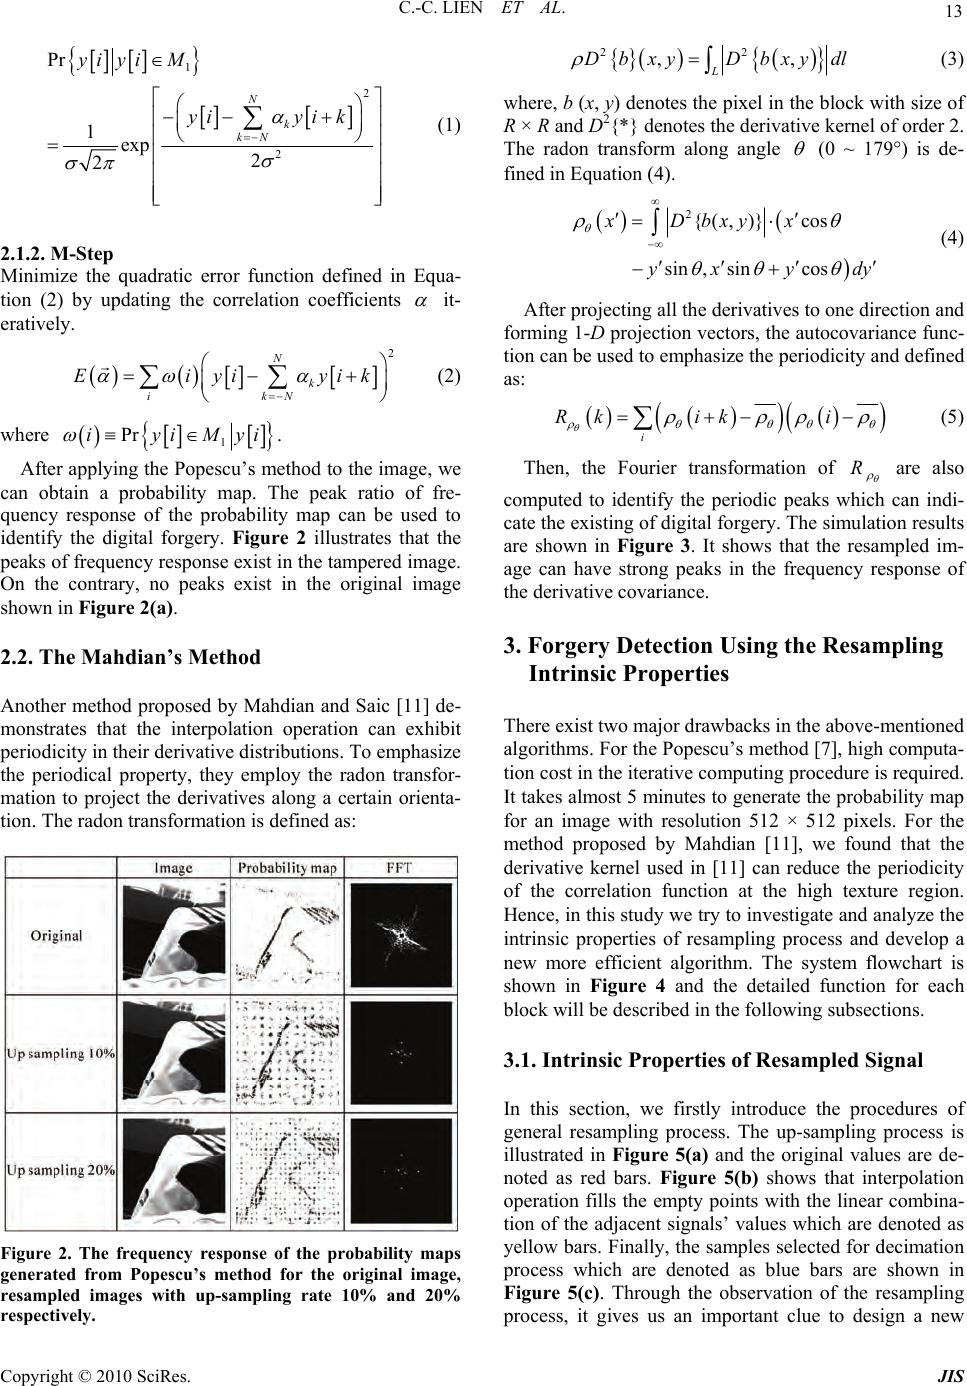 C.-C. LIEN ET AL. 13 1 2 2 Pr 1exp 2 2 N k kN yi yiM yiyi k (1) 2.1.2. M- Step Minimize the quadratic error function defined in Equa- tion (2) by updating the correlation coefficients it- eratively. 2 N k ikN Eiyiyi k (2) where 1 PriyiMy i. After applying the Popescu’s method to the image, we can obtain a probability map. The peak ratio of fre- quency response of the probability map can be used to identify the digital forgery. Figure 2 illustrates that the peaks of frequency response exist in the tampered image. On the contrary, no peaks exist in the original image shown in Figure 2(a). 2.2. The Mahdian’s Method Another method proposed by Mahdian and Saic [11] de- monstrates that the interpolation operation can exhibit periodicity in their derivative distributions. To emphasize the periodical property, they employ the radon transfor- mation to project the derivatives along a certain orienta- tion. The radon transformation is defined as: Figure 2. The frequency response of the probability maps generated from Popescu’s method for the original image, resampled images with up-sampling rate 10% and 20% respectively. 22 ,, L Dbxy Dbxydl (3) where, b (x, y) denotes the pixel in the block with size of R × R and D2{*} denotes the derivative kernel of order 2. The radon transform along angle (0 ~ 179°) is de- fined in Equation (4). 2{(, )}cos sin ,sincos xDbxyx yxy d y (4) After projecting all the deriv atives to one directio n and forming 1-D projection vectors, the autocovariance func- tion can be used to emphasize the periodicity and defined as: i Rk iki (5) Then, the Fourier transformation of R are also computed to identify the periodic peaks which can indi- cate the existing of digital forg ery. Th e simulation resu lts are shown in Figure 3. It shows that the resampled im- age can have strong peaks in the frequency response of the derivative covariance. 3. Forgery Detection Using the Resampling Intrinsic Properties There exist two major drawbacks in the above-mentioned algorithms. For the Popescu’s method [7], high computa- tion cost in the iterative co mputin g pro cedure is requ ired. It takes almost 5 minutes to generate the probability map for an image with resolution 512 × 512 pixels. For the method proposed by Mahdian [11], we found that the derivative kernel used in [11] can reduce the periodicity of the correlation function at the high texture region. Hence, in this study we try to investigate and an alyze the intrinsic properties of resampling process and develop a new more efficient algorithm. The system flowchart is shown in Figure 4 and the detailed function for each block will be described in the following subsections. 3.1. Intrinsic Properties of Resampled Signal In this section, we firstly introduce the procedures of general resampling process. The up-sampling process is illustrated in Figure 5(a) and the original values are de- noted as red bars. Figure 5(b) shows that interpolation operation fills the empty points with the linear combina- tion of the adjacent signals’ values which are denoted as yellow bars. Finally, the samples selected for decimation process which are denoted as blue bars are shown in Figure 5(c). Through the observation of the resampling process, it gives us an important clue to design a new Copyright © 2010 SciRes. JIS 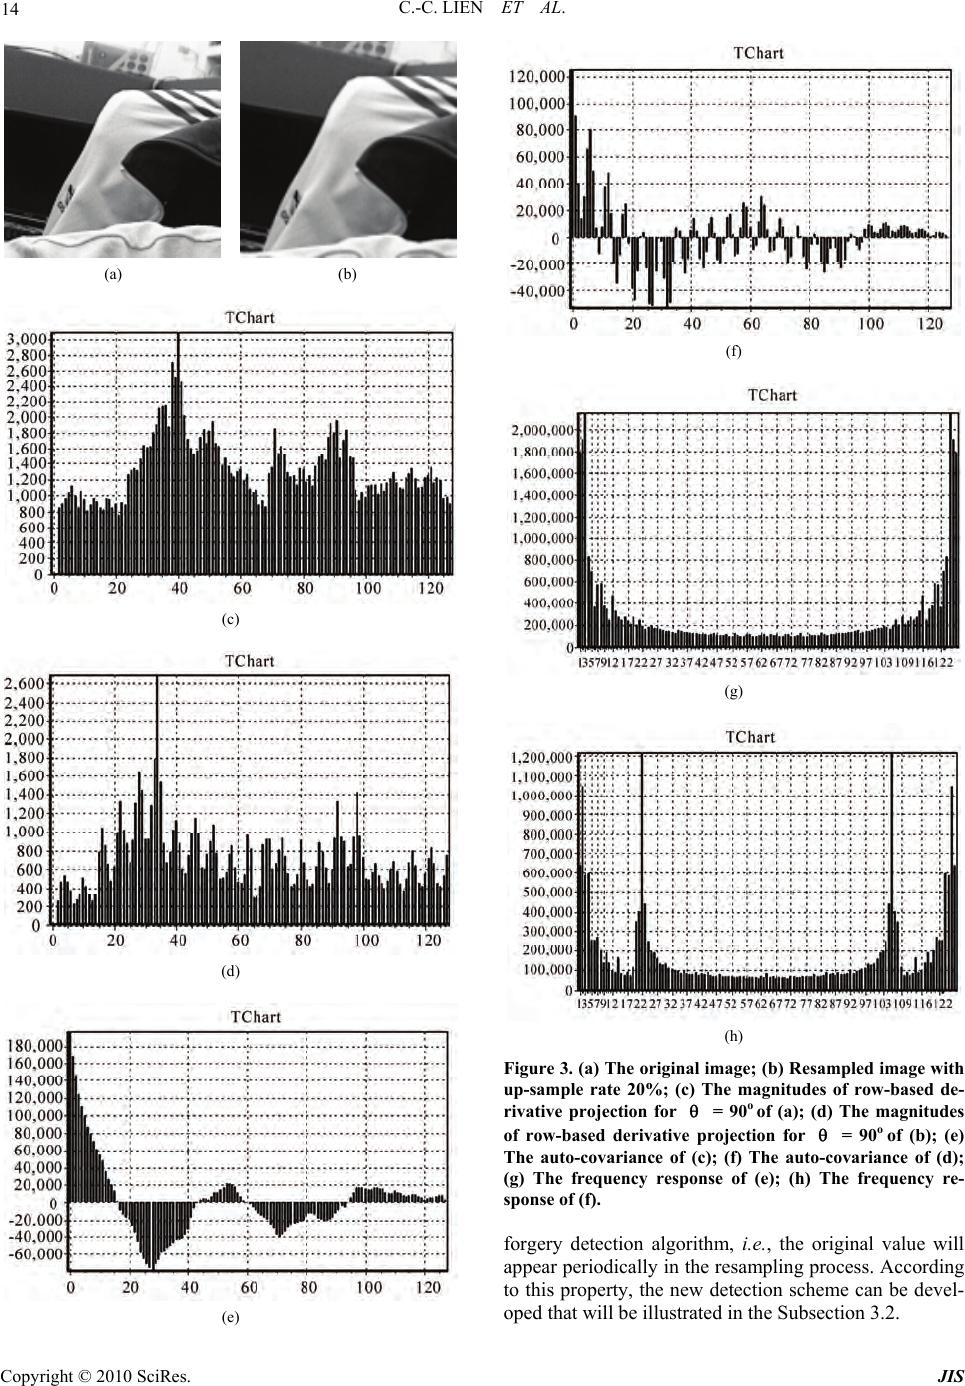 14 C.-C. LIEN ET AL. (a) (b) (c) (d) (e) (f) (g) (h) Figure 3. (a) The original image; (b) Resampled image with up-sample rate 20%; (c) The magnitudes of row-based de- rivative projection for = 90o of (a); (d) The magnitudes of row-based derivative projection for = 90o of (b); (e) The auto-covariance of (c); (f) The auto-covariance of (d); (g) The frequency response of (e); (h) The frequency re- sponse of (f). forgery detection algorithm, i.e., the original value will appear periodically in the resampling process. According to this property, the new detection scheme can be devel- oped that will be illustrated in the Subsection 3.2. Copyright © 2010 SciRes. JIS  C.-C. LIEN ET AL. 15 3.2. Periodicity of the Prediction Error Every resampled value denoted as blue bar in Figure 5 can be approximated by the linear combinations of the adjacent original values denoted as red bar with different weights according to their positions, i.e., the weightin g in the linear interpolation algorithm is propositional to the distance to their neighbors. Here, we pre-calculate the weighing table (shown in Table 1) for each resampling rates. If the resampling rate is known, then the original values can be approximated by the linear combination of the interpolated values. Based on the periodical property of the original values selected from resampling, some of the approximated values would exactly overlap the ori- ginal values in resampled signal (see the green bar in Figure 6). Ideally, the error between the predicted value and the resampled value would be very small at the posi- tion where the original value is resampled (the green bar in Figure 6). Moreover, the variation of the prediction error will distribute periodically. The weighting table WT [i], i = 1, 2,…, N, should be calculated in advance for Input image Vertical resampling rate predictiont Horizontal resampling rate prediction Prediction error variation analysisPrediction error variation analysis DCT DCT Peak searching< threshold > threshold Tampered Image Original image Figure 4. Flowchart of the proposed forgery detection sys- tem. (a) (b) (c) Figure 5. An example for illustrating the intrinsic property of resampled signal. The scaling factor used here is 6/5. (a) The up-sampling for the original values (red bars); (b) Lin- ear interpolation denoted as yellow bars; (c) Down sam- pling of signal in (b). The resampled signal is denoted as blue bars. The blue bars labeled the w hite node denote that the original values are chosen. Figure 6. The values (red bar) could be predicted by the resampled values (blue bar). After a certain periodical time interval, the predicted value will overlap the original value denoted as green bar. Table 1. Weighting table for resampling rate 6/5. WTL [i] WTR [i] 1 1/6 5/6 2 2/6 4/6 3 3/6 3/6 4 4/6 2/6 5 5/6 1/6 each resampling rate. The prediction process is described in Figure 6. In Figure 6, the interpolated values can be computed as: i1 1 1 iL iR BRWT iRWTi (6) Copyright © 2010 SciRes. JIS  16 C.-C. LIEN ET AL. Then, the predicted resampling values can be comput- ed as: 1 1 2 12 3 23 11 . . L R L R NmL mN N R BRWTi pre RWT i BpreWTi pre RWT i BpreWTi pre RB WT i (7) Finally, the prediction error within the certain sliding window can be computed as: 1 Prediction error N m Bpre (8) For the case of resampling rate 120%, the difference between pre5 and B7 will be very small. When the sliding window for calculating the sample prediction is moving (shown in Figure 7), the prediction error will increase and then decrease to the mini mum value until the sliding window moves to the next periodical position (B14, B21…). Such a periodical property makes the sequence of prediction error distribute periodically shown in Figure 8. In order to enhance this property, the projection opera- tion is also performed for every row and column (two directions are considered separately) before we utilize the frequency analysis to detect the forgery patterns (peaks in frequency response). If the test samples are not resampled or the wrong weighting table is selected, the distribution of prediction error would be irregular. Figure 7. The sliding window for calculating the sample prediction using the pre-calculate d weighting table. (a) (b) (c) (d) (e) Copyright © 2010 SciRes. JIS  C.-C. LIEN ET AL. 17 (f) Figure 8. (a) The original image; (b) Resampled image with up-sampled rate 10%; (c) The magnitudes of row-based prediction error variation projection of (a); (d) The magni- tudes of row-based prediction error variation projection of (b); (e) The frequency response of (c); (f) The frequency response (d). To develop an automatic forgery detection method, there are two main criteria should be considered. The first one is the position where the peak occurs and the second one is the peak ratio. According to the different weighting tables (different resampling rate) for the for- gery detection and the specific periodical property for each resampling rate, the expected position where the peak occurs could be forecasted. Then, we can match the peak position to the forecasted position where the spe- cific resampling rate generates for identifying the exis- tence of digital forgery. If the ratio is larg er than a speci- fied threshold, we can identify that existence of digital forgery. Finally, the flowchart of the proposed system is shown in Figure 9. To detect the tampered region, the image is scanned from left-top to right-bottom with dif- ferent block sizes. In each block, the proposed method is applied to detect the tampered regions. 4. Experimental Results In this section, the efficiency and accuracy for Popescu’d method [7], Mahdian’s method [11], and the proposed method are analyzed. The experimental database is con- structed with 160 gray level images with resolution 512 × 512 and each image is partial tampered in BMP format. The image tampering is based on the resampling process with the different bi-linear sampling rates: 105%, 110%, 120% and 125%. The forgery detections are performed by scanning the image with the block size of 128 × 128 pixels. Before analyzing the accuracy of forgery detection, we firstly describe the detection rules for the Popescu’s [7], Mahdian’s [11], and our methods. Here, the forgery de- tection of Popescu’s and Mahdian’s methods is deter- Figure 9. The flowchart of the proposed method. mined by evaluating whether the ratio of peak-to-average frequency response is larger than a predefined threshold value or not. The ratio of peak-to-average frequency re- sponse is defined as: maximum sec average Pop uMahdian magnitude RR magnitude For our method, the forgery detection is determined by evaluating whether the ratio of forecasted peak-to-average frequency response is larger than a predefined threshold value or not. The ratio of forecasted peak-to-average frequency resp onse is defined as: forecasted position average our magnitude Rmagnitude The resampled image with rate 120% shown in Figure 10(a) is used as the tampered image for analyzing the detection accuracy for the three methods. Figure 10(b) shows the probability map produced by the Popescu’s method and Figure 10(c) shows the frequency response of the probability map. Figure 11(a) shows the radon transformation of the derivative along horizontal direc- Copyright © 2010 SciRes. JIS  18 C.-C. LIEN ET AL. tion generated by Mahdian’s method and Figure 11(b) shows its auto-covariance. Figure 11(c) shows the fre- quency response of the au to-covariance values. Based on the proposed method, the prediction error generated by the novel algorithm is shown in Figure 12(a). Figure 12(b) presents the frequency response of the prediction error. An obvious drawback of the Mahdian’s method is that the weak periodical patterns occur at the high texture regions shown in Figure 11(c). The accuracy analyses of forgery detections for different resampling rates are ana- lyzed in Table 2. (a) (b) (c) Figure 10. (a) The tampered image; (b) The probability map generated by the P opescu’s method; (c) The fre quency response of (b). (a) (b) (c) Figure 11. (a) The radon transformation output of Figure 13 by the Mahdian’s method; (b) The autocovariance of (a); (c) The frequency response of (b). The ROC curves with different up-sampling rates for Popescu’s, Mahdian’s and our methods are shown in Figure 13. In this Figure, the detection accuracy of Popescu’s method is the highest one and the detection accuracy of our method is close to the Popescu’s curve. However, our method is the fastest one that will be men- tioned later. The detection accuracy of Mahdian’s me- thod is the lowest because the detection accuracy is af- fected by the high texture regions. Copyright © 2010 SciRes. JIS 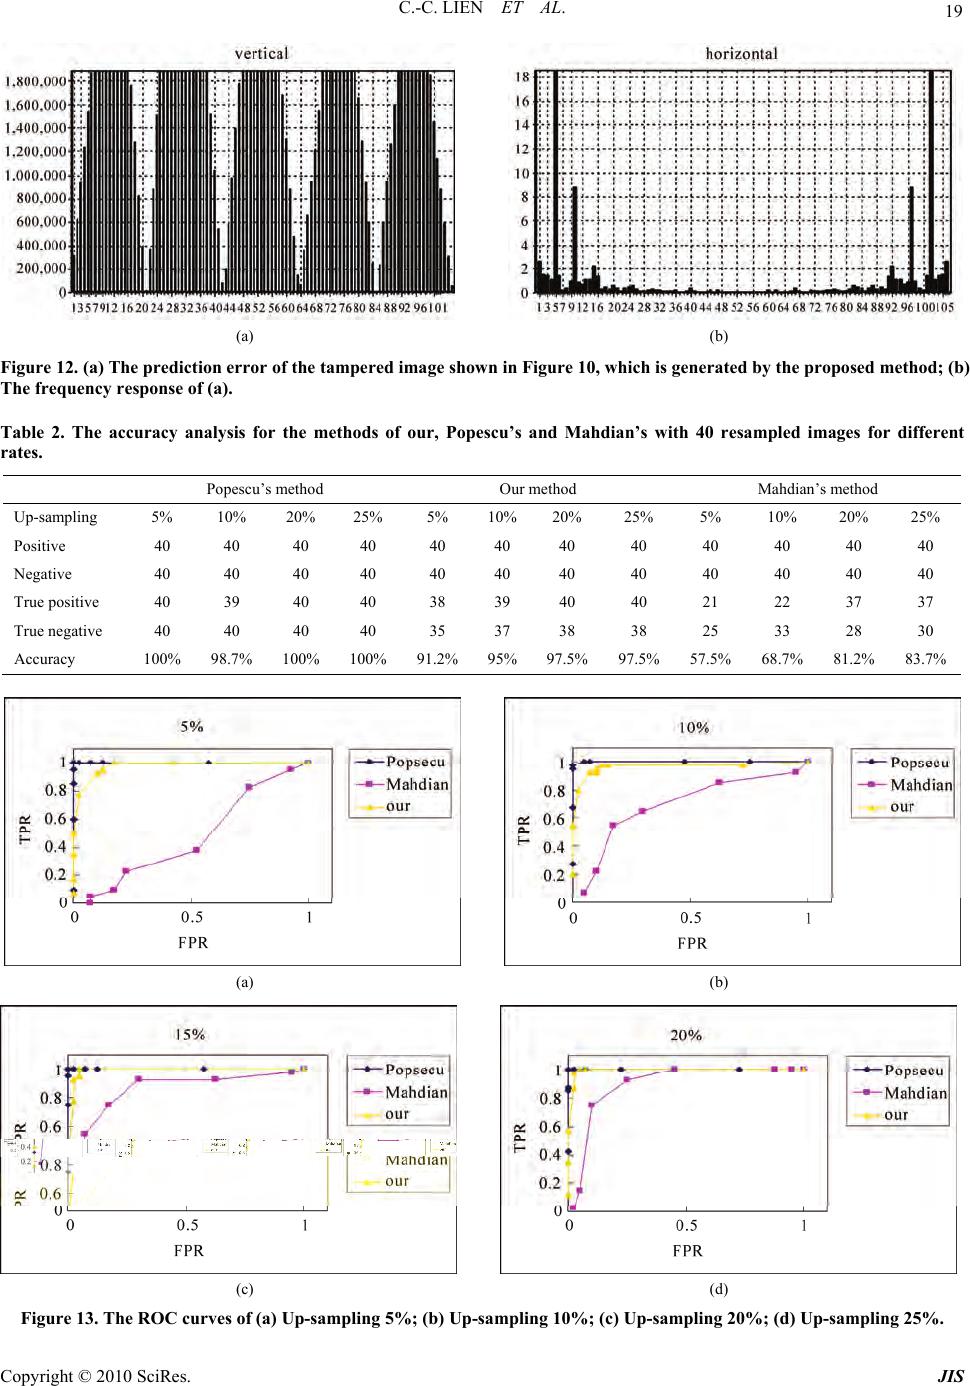 C.-C. LIEN ET AL. Copyright © 2010 SciRes. JIS 19 (a) (b) Figure 12. (a) The prediction error of the tampered image shown in Figure 10, which is generated by the proposed method; (b) The frequency response of (a). Table 2. The accuracy analysis for the methods of our, Popescu’s and Mahdian’s with 40 resampled images for different rates. Popescu’s method Our method Mahdian’s method Up-sampling 5% 10% 20% 25% 5% 10%20% 25% 5% 10% 20% 25% Positive 40 40 40 40 40 40 40 40 40 40 40 40 Negative 40 40 40 40 40 40 40 40 40 40 40 40 True positive 40 39 40 40 38 39 40 40 21 22 37 37 True negative 40 40 40 40 35 37 38 38 25 33 28 30 Accuracy 100% 98.7%100% 100%91.2%95%97.5%97.5%57.5% 68.7% 81.2%83.7% (a) (b) (c) (d) Figure 13. The ROC curves of (a) Up-sampling 5%; (b) Up-sampling 10%; (c) Up-sampling 20%; (d) Up-sampling 25%. 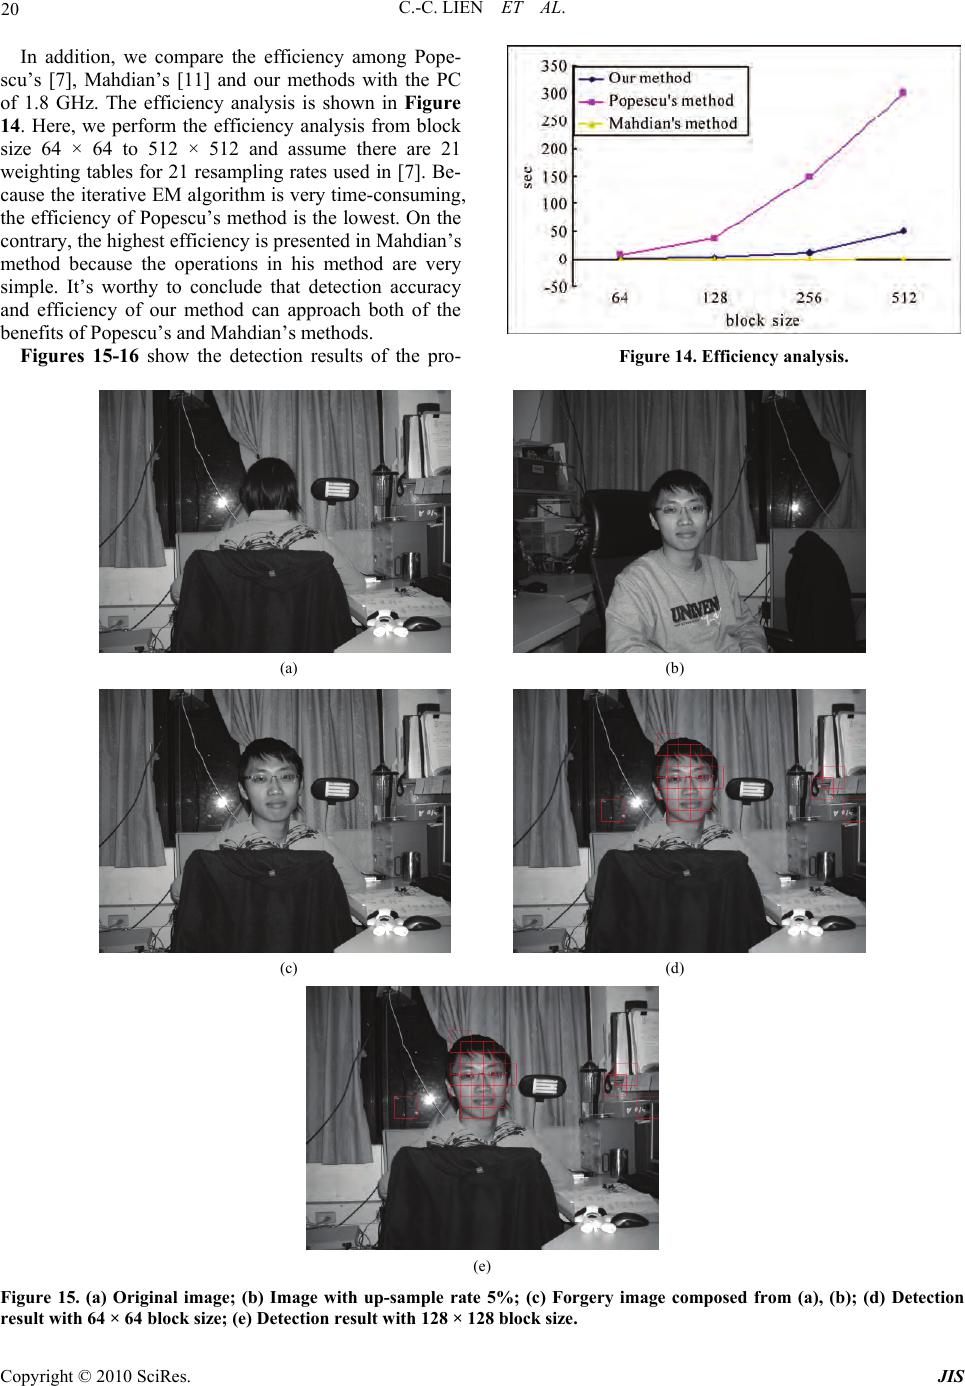 C.-C. LIEN ET AL. Copyright © 2010 SciRes. JIS 20 In addition, we compare the efficiency among Pope- scu’s [7], Mahdian’s [11] and our methods with the PC of 1.8 GHz. The efficiency analysis is shown in Figure 14. Here, we perform the efficiency analysis from block size 64 × 64 to 512 × 512 and assume there are 21 weighting tables for 21 resampling rates used in [7]. Be- cause the iterative EM algorithm is very time-consuming, the efficiency of Popescu’s method is the lowest. On the contrary, the highest efficiency is presented in Mahdian’s method because the operations in his method are very simple. It’s worthy to conclude that detection accuracy and efficiency of our method can approach both of the benefits of Popescu’s and Mahdian’s methods. Figures 15-16 show the detection results of the pro- Figure 14. Efficiency analysis. (a) (b) (c) (d) (e) Figure 15. (a) Original image; (b) Image with up-sample rate 5%; (c) Forgery image composed from (a), (b); (d) Detection result with 64 × 64 block size; (e) Detection result with 128 × 128 block size. 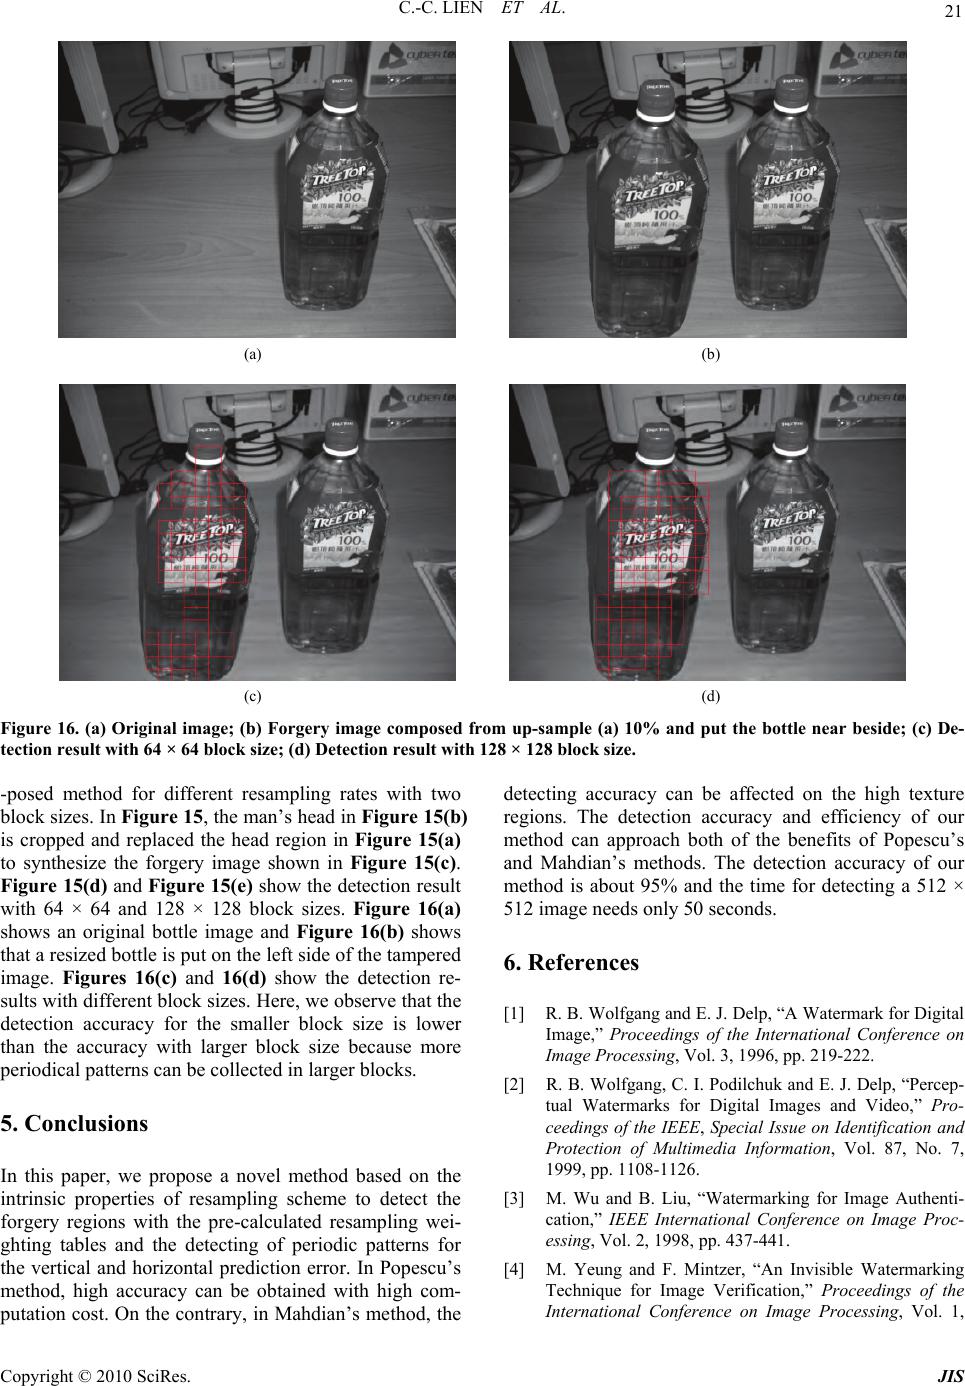 C.-C. LIEN ET AL. 21 (a) (b) (c) (d) Figure 16. (a) Original image; (b) Forgery image composed from up-sample (a) 10% and put the bottle near beside; (c) De- tection result with 64 × 64 block size; (d) Detection result with 128 × 128 block size. -posed method for different resampling rates with two block sizes. In Figure 15, the man’s head in Figure 15(b) is cropped and replaced the head region in Figure 15(a) to synthesize the forgery image shown in Figure 15(c). Figure 15(d) and Figure 15(e) show the detection result with 64 × 64 and 128 × 128 block sizes. Figure 16(a) shows an original bottle image and Figure 16(b) shows that a resized bottle is put on the left side of the tampered image. Figures 16(c) and 16(d) show the detection re- sults with different block sizes. Here, we observe that the detection accuracy for the smaller block size is lower than the accuracy with larger block size because more periodical patterns can be collected in larger blocks. 5. Conclusions In this paper, we propose a novel method based on the intrinsic properties of resampling scheme to detect the forgery regions with the pre-calculated resampling wei- ghting tables and the detecting of periodic patterns for the vertical and horizontal prediction error. In Popescu’s method, high accuracy can be obtained with high com- putation cost. On the contrary, in Mahdian’s method, the detecting accuracy can be affected on the high texture regions. The detection accuracy and efficiency of our method can approach both of the benefits of Popescu’s and Mahdian’s methods. The detection accuracy of our method is about 95% and the time for detecting a 512 × 512 image needs only 50 seconds. 6. References [1] R. B. Wolfgang and E. J. Delp, “A Watermark for Digital Image,” Proceedings of the International Conference on Image Processing, Vol. 3, 1996, pp. 219-222. [2] R. B. Wolfgang, C. I. Podilchuk and E. J. Delp, “Percep- tual Watermarks for Digital Images and Video,” Pro- ceedings of the IEEE, Special Issue on Identification and Protection of Multimedia Information, Vol. 87, No. 7, 1999, pp. 1108-1126. [3] M. Wu and B. Liu, “Watermarking for Image Authenti- cation,” IEEE International Conference on Image Proc- essing, Vol. 2, 1998, pp. 437-441. [4] M. Yeung and F. Mintzer, “An Invisible Watermarking Technique for Image Verification,” Proceedings of the International Conference on Image Processing, Vol. 1, Copyright © 2010 SciRes. JIS 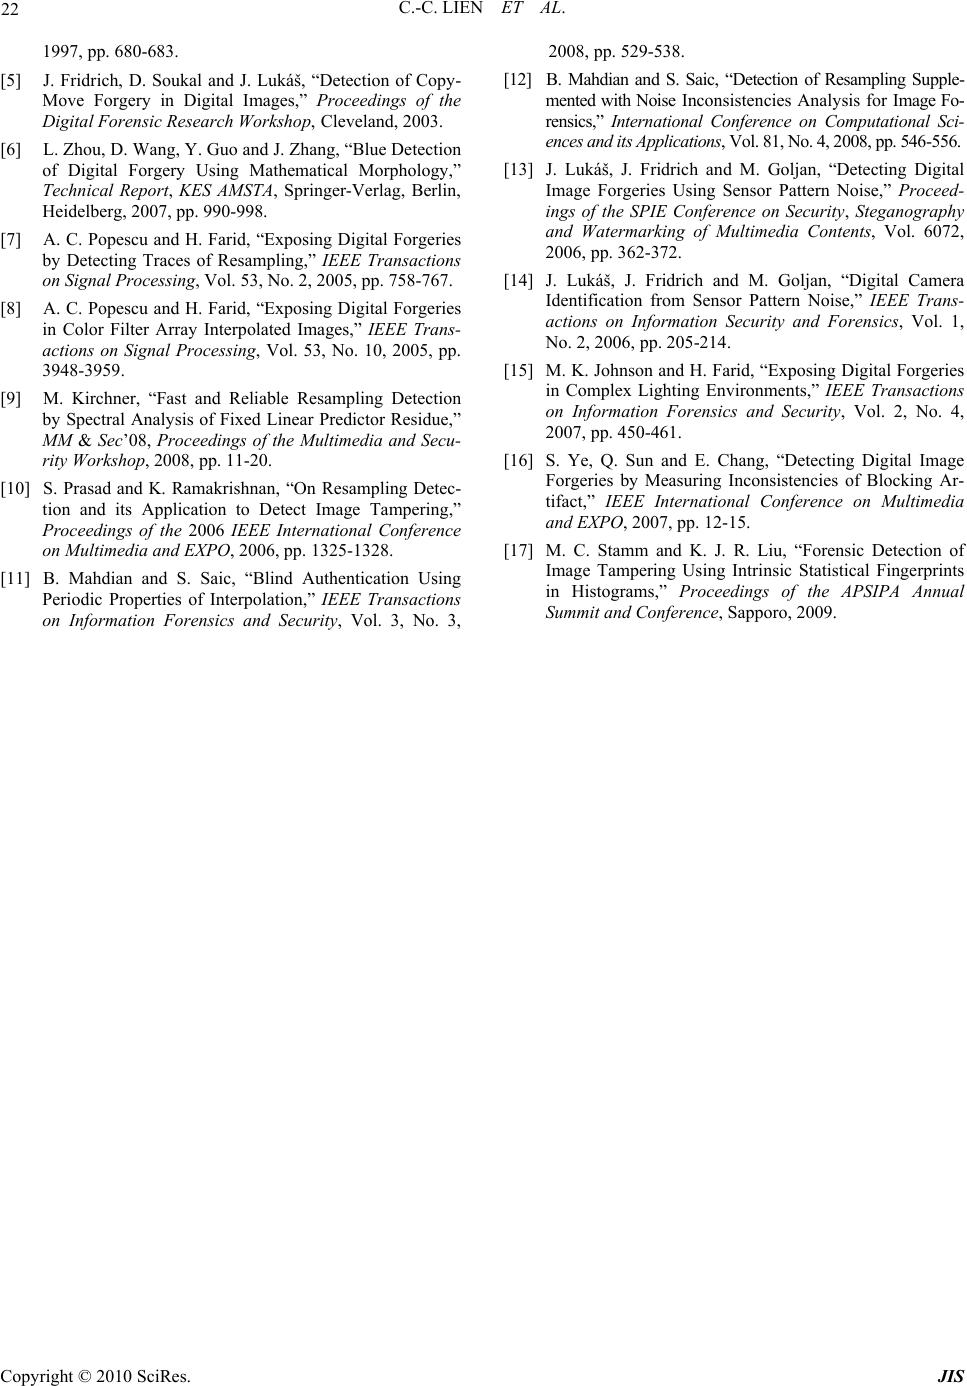 22 C.-C. LIEN ET AL. 1997, pp. 680-683. [5] J. Fridrich, D. Soukal and J. Lukáš, “Detection of Copy- Move Forgery in Digital Images,” Proceedings of the Digital Forensic Research Workshop, Cleveland, 2003. [6] L. Zhou, D. Wang, Y. Guo and J. Zhang, “Blue Detection of Digital Forgery Using Mathematical Morphology,” Technical Report, KES AMSTA, Springer-Verlag, Berlin, Heidelberg, 2007, pp. 990-998. [7] A. C. Popescu and H. Farid, “Exposing Digital Forgeries by Detecting Traces of Resampling,” IEEE Transactions on Signal Processing, Vol. 53, No. 2, 2005, pp. 758-767. [8] A. C. Popescu and H. Farid, “Exposing Digital Forgeries in Color Filter Array Interpolated Images,” IEEE Trans- actions on Signal Processing, Vol. 53, No. 10, 2005, pp. 3948-3959. [9] M. Kirchner, “Fast and Reliable Resampling Detection by Spectral Analysis of Fixed Linear Predictor Residue,” MM & Sec’08, Proceedings of the Multimedia and Secu- rity Workshop, 2008, pp. 11-20. [10] S. Prasad and K. Ramakrishnan, “On Resampling Detec- tion and its Application to Detect Image Tampering,” Proceedings of the 2006 IEEE International Conference on Multimedia and EXPO, 2006, pp. 1325-1328. [11] B. Mahdian and S. Saic, “Blind Authentication Using Periodic Properties of Interpolation,” IEEE Transactions on Information Forensics and Security, Vol. 3, No. 3, 2008, pp. 529-538. [12] B. Mahdian and S. Saic, “Detection of Resampling Supple- mented with Noise Inconsistencies Analysis for Image Fo- rensics,” International Conference on Computational Sci- ences and its Applications, Vol. 81, No. 4, 2008, pp . 546-556. [13] J. Lukáš, J. Fridrich and M. Goljan, “Detecting Digital Image Forgeries Using Sensor Pattern Noise,” Proceed- ings of the SPIE Conference on Security, Steganography and Watermarking of Multimedia Contents, Vol. 6072, 2006, pp. 362-372. [14] J. Lukáš, J. Fridrich and M. Goljan, “Digital Camera Identification from Sensor Pattern Noise,” IEEE Trans- actions on Information Security and Forensics, Vol. 1, No. 2, 2006, pp. 205-214. [15] M. K. Johnson and H. Farid, “Exposing Digital Forgeries in Complex Lighting Environments,” IEEE Transactions on Information Forensics and Security, Vol. 2, No. 4, 2007, pp. 450-461. [16] S. Ye, Q. Sun and E. Chang, “Detecting Digital Image Forgeries by Measuring Inconsistencies of Blocking Ar- tifact,” IEEE International Conference on Multimedia and EXPO, 2007, pp. 12-15. [17] M. C. Stamm and K. J. R. Liu, “Forensic Detection of Image Tampering Using Intrinsic Statistical Fingerprints in Histograms,” Proceedings of the APSIPA Annual Summit and Conference, Sapporo, 2009. Copyright © 2010 SciRes. JIS |