Z. BARGHOUTHI, S. AMEREIH
654
where: [resorcin blue] is measured using the molar ab-
sorptivity for resorcin blue, which was found to be
3
0.07 10±×
()
2
in blueis
5.67 L·mol−1·cm−1 at 624 nm, and the ab-
sorbance at the equilibrium;
Al resorc
()
2initial
Al resorcin blue12r
−
esorcin blue;
()
[]
esorcin blue
()
3
6
AlF
−
−
3
6
AlFis 12r
−
;
and
––
initial
FisF
.
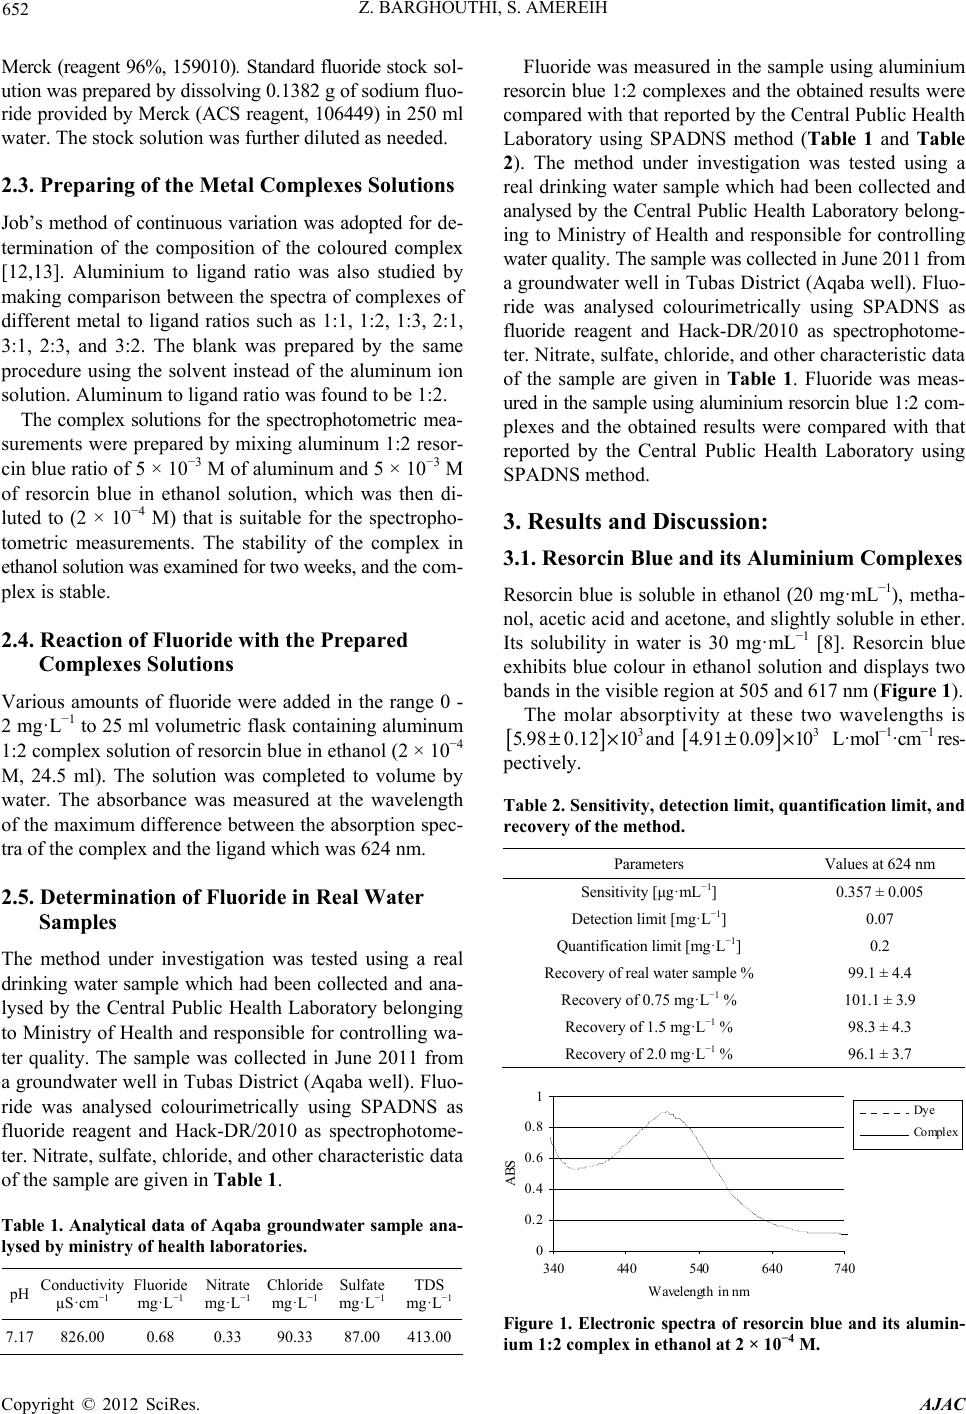
Figures 3 and 4 show that aluminium resorcin blue
complex is suitable for determination of fluoride in the
range 0.0 to 1.0 mg·L−1. The sensitivity, detection limit,
limit of quantification, percentage recovery of fluoride in
real water sample, and the percentage recovery of 0.75,
1.5, and 2.0 mg·L−1 fluoride of the aluminium resorcin
blue complex for the spectrophotometric determination of
fluoride at 624 nm are given in Table 2.
The sensitivity was taken as the average of the slope of
the calibration curve for five replicates. The detection limit
and the limit of quantification were calculated as (3.3 σ/S)
and (10 σ/S) respectively, where σ is the standard devia-
tion of response and S is the slope of the calibration curve.
The recovery was measured as the average of 10 rep-
licate. The recover of high fluoride concentration such as
1.5, and 2.0 mg·L−1 fluoride was calculated by measuring
the absorbance for the diluted solutions (1 to 3).
The interference studies were done by measuring the
influence of the anions such as chloride, nitrate, and sul-
phate in such concentration commonly found in the natural
water on the determination of 1.0 mg·L−1 fluoride. Chloride
and nitrate which were added in the range of 100 - 500
and 5 - 100 mg·L−1 respectively do not interfere with the
determination of fluoride. Sulphate interferes with the most
visual and photometric methods for determination of fluo-
ride by its competition with fluoride to form a complex
with the metal and therefore it results in higher concen-
trations [17,18]. In the present work, sulphate up to 100
mg· L−1 does not interfere with the determination of fluo-
ride. However, at higher concentration, sulphate interferes
with determination of fluoride by causing a positive error
of about 25%. This error can be overcome by precipitat-
ing sulphate in the cold by the addition of aqueous bar-
ium chloride solution and aqueous agar-agar solution, then
to separate the precipitate by filtration [19].
The proposed spectrophotometric method can be ap-
plied without any previous preparations, such that were
necessary to separate fluoride ions, to control fluoride in
countries with low fluoride content water resources.
4. Conclusions
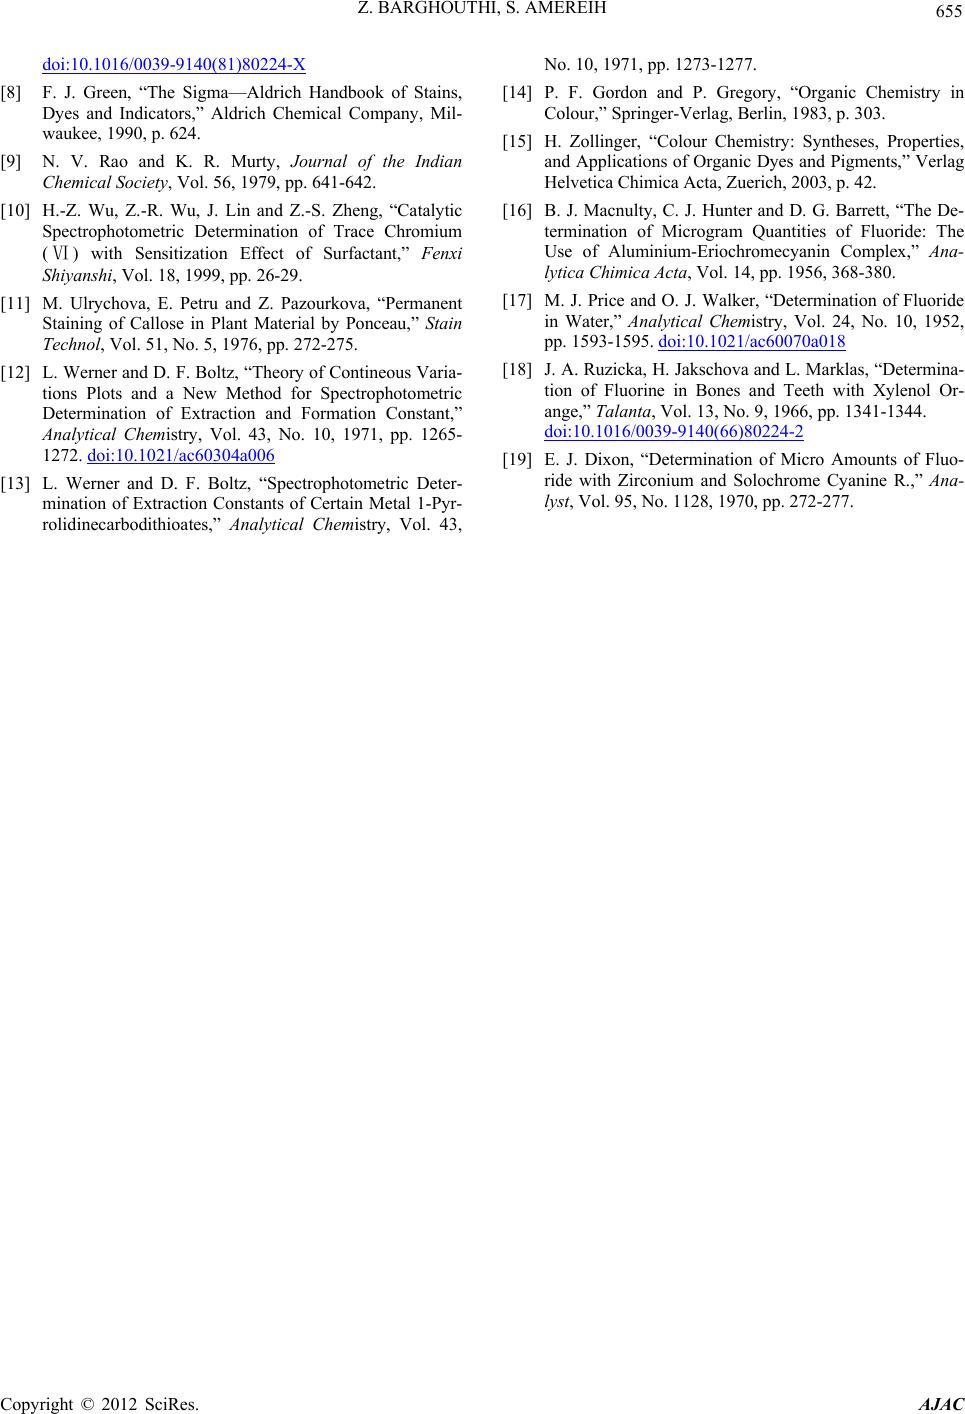
The relationship of the reaction of fluoride with alumin-
ium-resorcin blue complex is related linearly at 624 nm
to the concentration of fluoride in the range 0.0 - 1.0
mg· L −1. However, at higher fluoride concentration, the
relationship was best described by a sixth-order polyno-
mial function. The reaction reaches equilibrium at fluo-
ride concentration of 0.054 mM, and the equilibrium con-
stant (Keq) was found to be 1.12 × 1034.
Aluminium-resorcin blue complex was used success-
fully as new spectrophotometric reagent for determina-
tion of fluoride in water in the range 0.0 to 1.0 mg·L−1.
Due to its simplicity and high sensitivity, the method can
be recommended as new spectrophotometric reagent for
determination of fluoride in drinking water at low con-
centration. However, determination of fluoride at higher
concentration is possible by diluting of the water sample
to fit the requirements of the proposed method.
5. Acknowledgements
The authors thank Professor Walter Kosmus from the Ana-
lytical Chemistry Institute in the University of Graz-Aus-
tria for his advices, suggestions, ideas, comments, helpful
discussions, and for his supervision through the Ph. D
research. The Director (Mr. Ibrahim Salem) and the staff
of the Central Public Health Laboratory—Ministry of Hea-
lth are highly acknowledged for their cooperation and for
sharing their data.
REFERENCES
[1] WHO, “Fluoride in Drinking-Water,” IWA Publishing,
London, 2006, pp. 1-3, 83-95.
[2] W. Czarnowski, K. Wrzesniowska and J. Krechniak,
“Fluoride in Drinking Water and Human Urine in North-
ern and Central Poland,” Science of the Total Environ-
ment, Vol. 191, No. 1-2, 1996, pp. 177-184.
doi:10.1016/0048-9697(96)05259-X
[3] S. M. Maliyekkal, S. Shukla, L. Philip and I. M. Nambie,
“Enhanced Fluoride Removal from Drinking Water by
Magnesia-Amended Activated Alumina Granules,” Che-
mical Engineering Journal, Vol. 140, No. 1-3, 2008, pp.
183-192. doi:10.1016/j.cej.2007.09.049
[4] Y.-N. Wang, K. Q. Xiao, J. L. Liu, G. Dallner and Z. Z.
Guan, “Effect of Long Time Fluoride Exposure on Lipid
Composition in Rat Liver,” Toxicology, Vol. 146, No. 2-5,
2000, pp. 161-169. doi:10.1016/S0300-483X(00)00167-0
[5] M. A. Armienta and N. Segovia, “Arsenic in Fluoride in
Groundwater of Maxico,” Environmental Geochemistry
and Health, Vol. 30, No. 4, 2008, pp. 345-353.
doi:10.1007/s10653-008-9167-8
[6] WHO, “Guidelines for Drinking-Water Quality. Recom-
mendation,” 2nd Edition, Vol. 1, World Health Organiza-
tion, Geneva, 2004, pp. 375-377.
[7] H. Einaga and I. Iwasaki, “Spectrophotometric Study of
the Reaction of Zirconium with Chrome Azurol S and
Fluoride,” Talanta, Vol. 28, No. 12, 1981, pp. 889-900.
C
opyright © 2012 SciRes. AJAC