Paper Menu >>
Journal Menu >>
 American Journal of Analytical Chemistry, 2012, 3, 646-650 http://dx.doi.org/10.4236/ajac.2012.39084 Published Online September 2012 (http://www.SciRP.org/journal/ajac) Measurement of the Trace Elements Cu, Zn, Fe, and Mg and the Ultratrace Elements Cd, Co, Mn, and Pb in Limited Quantity Human Plasma and Serum Samples by Inductively Coupled Plasma-Mass Spectrometry Gang Li1, John D. Brockman2*, Shih-Wen Lin3, Christian C. Abnet3, Lance A. Schell1, J. David Robertson1,2 1University of Missouri-Columbia, Department of Chemistry, Columbia, USA 2University of Missouri-Columbia, Research Reactor, Columbia, USA 3National Cancer Institute, Division of Cancer Epidemiology and Genetics, Bethesda, USA Email: *BrockmanJD@missouri.edu Received July 9, 2012; revised August 14, 2012; accepted August 27, 2012 ABSTRACT In public health studies limited volumes of blood are often collected and stored for future hypothesis testing. Archived samples are irreplaceable and therefore it is valuable to develop analytical techniques that require minimal sample vol- ume. This work describes the measurement of trace elements Mg, Cu, Fe, Zn and ultratrace elements Cd, Co, Mn, Pb in limited quantity (150 µL) human serum or plasma samples. Samples were digested using a hotblock and analyzed using inductively coupled plasma mass spectrometry (ICP-MS). The analytical method was evaluated using a quadrupole (Q) and sector field high resolution (SF) instrument to analyze trace elements in Seronorm® quality control serum material. The method was used to analyze 1888 blinded human plasma samples which were archived for the National Cancer Institute from the Nutrition Intervention Trial in Linxian China. The inductively coupled plasma method was capable of accurately analyzed limited quantity samples of human serum and plasma for the trace elements Mg, Cu, Fe Zn and the ultra trace elements Co, Mn and Pb. The concentration of Cd in human plasma samples was below the level of detection for 75% of the samples analyzed. Keywords: Inductively Coupled Plasma Mass Spectrometry; Trace Element Measurements; Human Plasma; Serum 1. Introduction Epidemiologists and scientists interested in studying nu- tritional, environmental, biologic and genetic factors that influence human health often collect and process blood samples into plasma or serum for analytical testing. Serum, plasma and blood samples are used to test hypotheses relat- ing to trace element exposure/status, environmental pol- lutants, antibodies, proteins, DNA adducts and genotypes. Because of limited sample availability it is advantageous to develop analytical methods that require minimal sam- ple volume. Many studies that report trace element concentrations in serum and plasma samples require a minimum of 500 µL of sample [1-5]. In these publications, sample prepa- ration is limited to a “dilute and shoot” procedure. The so called “dilute and shoot” methods rely on dilution of the sample, often with a mixture of ammonium hydroxide, triton X and EDTA, prior to analysis [6]. The advantages include minimum sample preparation which speeds up analysis and limits potential sources of contamination. However the resulting sample matrix requires a matched calibration curve for accurate quantification which must be constructed using standard additions to a sample. Fur- thermore, the presence of undigested proteins often results in buildup of residue on the nebulizer and sample intro- duction system and can cause instrument instability and clogging. Finally, the dilute and shoot methods require a nebulizer with sample flow rates of 1 mL/min or greater. This can be a challenge in small volume samples for ul- tra-trace elements such as Co, Pb and Cd which require a 1:10 to 1:20 sample dilution. Digestion procedures have the advantage of eliminate- ing proteins which reduces matrix effects and instrument clogging. However, the digestion procedure can introduce random contamination and volatile elements such as Hg may be compromised. It is therefore important to analyze digestion blanks to determine if random contaminating of the sample has occurred [7]. *Corresponding autho r . C opyright © 2012 SciRes. AJAC 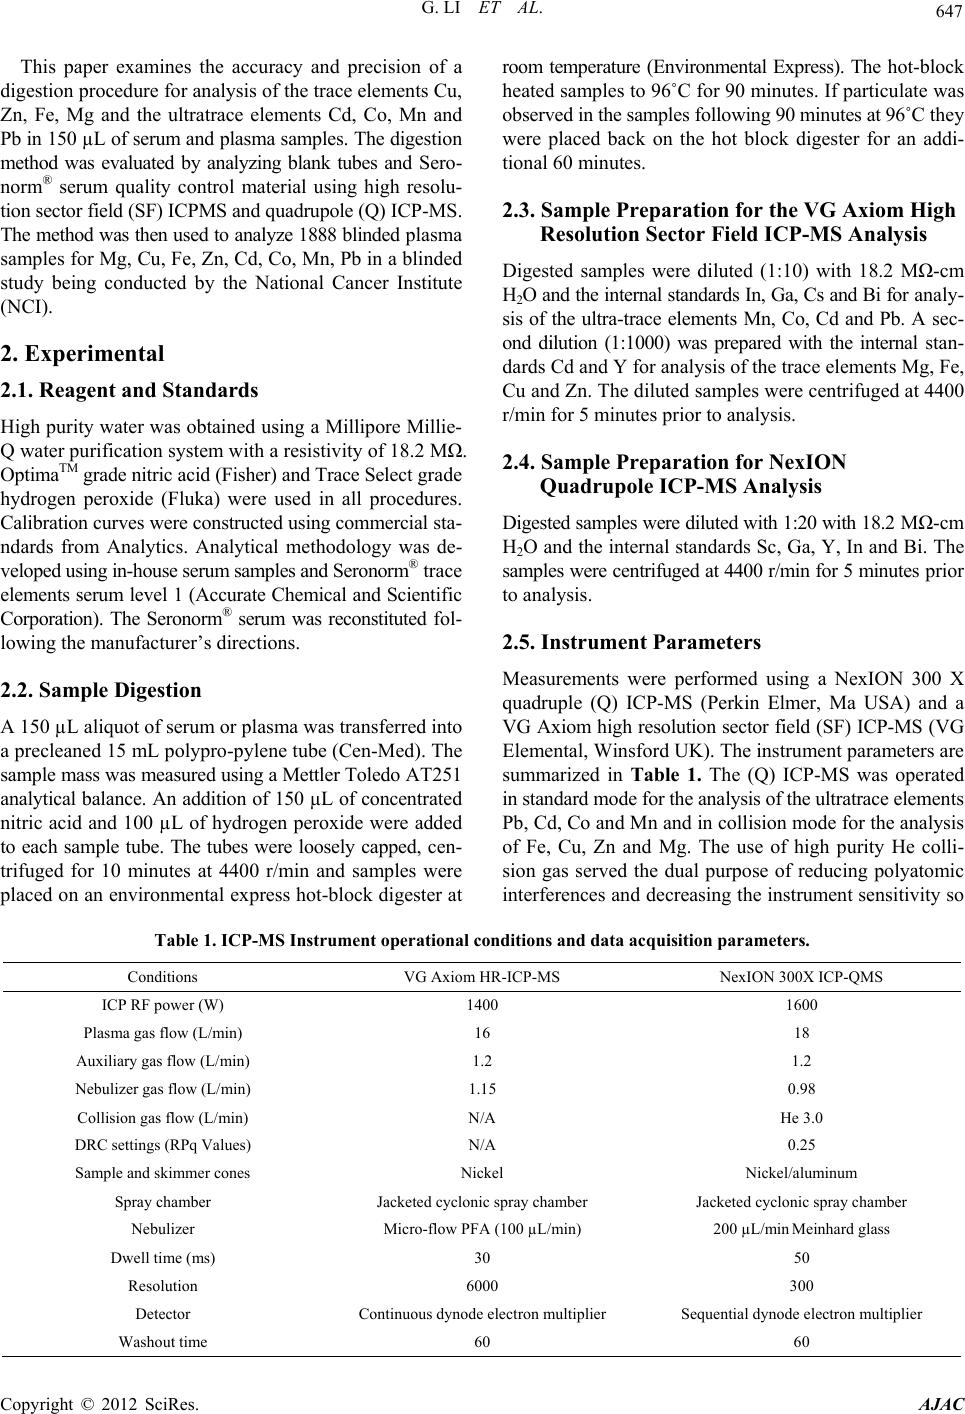 G. LI ET AL. 647 This paper examines the accuracy and precision of a digestion procedure for analysis of the trace elements Cu, Zn, Fe, Mg and the ultratrace elements Cd, Co, Mn and Pb in 150 µL of serum and plasma samples. The digestion method was evaluated by analyzing blank tubes and Sero- norm® serum quality control material using high resolu- tion sector field (SF) ICPMS and quadrupole (Q) ICP-MS. The method was then used to analyze 1888 blinded plasma samples for Mg, Cu, Fe, Zn, Cd, Co, Mn, Pb in a blinded study being conducted by the National Cancer Institute (NCI). 2. Experimental 2.1. Reagent and Standards High purity water was obtained using a Millipore Millie- Q water purification system with a resistivity of 18.2 MΩ. OptimaTM grade nitric acid (Fisher) and Trace Select grade hydrogen peroxide (Fluka) were used in all procedures. Calibration curves were constructed using commercial sta- ndards from Analytics. Analytical methodology was de- veloped using in-house serum samples and Seronorm® trace elements serum level 1 (Accurate Chemical and Scientific Corporation). The Seronorm® serum was reconstituted fol- lowing the manufacturer’s directions. 2.2. Sample Digestion A 150 µL aliquot of serum or plasma was transferred into a precleaned 15 mL polypro-pylene tube (Cen-Med). The sample mass was measured using a Mettler Toledo AT251 analytical balance. An addition of 150 µL of concentrated nitric acid and 100 µL of hydrogen peroxide were added to each sample tube. The tubes were loosely capped, cen- trifuged for 10 minutes at 4400 r/min and samples were placed on an environmental express hot-block digester at room temperature (Environmental Express). The hot-block heated samples to 96˚C for 90 minutes. If particulate was observed in the samples following 90 minutes at 96˚C they were placed back on the hot block digester for an addi- tional 60 minutes. 2.3. Sample Preparation for the VG Axiom High Resolution Sector Field ICP-MS Analysis Digested samples were diluted (1:10) with 18.2 MΩ-cm H2O and the internal standards In, Ga, Cs and Bi for analy- sis of the ultra-trace elements Mn, Co, Cd and Pb. A sec- ond dilution (1:1000) was prepared with the internal stan- dards Cd and Y for analysis of the trace elements Mg, Fe, Cu and Zn. The diluted samples were centrifuged at 4400 r/min for 5 minutes prior to analysis. 2.4. Sample Preparation for NexION Quadrupole ICP-MS Analysis Digested samples were diluted with 1:20 with 18.2 MΩ-cm H2O and the internal standards Sc, Ga, Y, In and Bi. The samples were centrifuged at 4400 r/min for 5 minutes prior to analysis. 2.5. Instrument Parameters Measurements were performed using a NexION 300 X quadruple (Q) ICP-MS (Perkin Elmer, Ma USA) and a VG Axiom high resolution sector field (SF) ICP-MS (VG Elemental, Winsford UK). The instrument parameters are summarized in Table 1. The (Q) ICP-MS was operated in standard mode for the analysis of the ultratrace elements Pb, Cd, Co and Mn and in collision mode for the analysis of Fe, Cu, Zn and Mg. The use of high purity He colli- sion gas served the dual purpose of reducing polyatomic interferences and decreasing the instrument sensitivity so Table 1. ICP-MS Instrument operational conditions and data acquisition parameters. Conditions VG Axiom HR-ICP-MS NexION 300X ICP-QMS ICP RF power (W) 1400 1600 Plasma gas flow (L/min) 16 18 Auxiliary gas flow (L/min) 1.2 1.2 Nebulizer gas flow (L/min) 1.15 0.98 Collision gas flow (L/min) N/A He 3.0 DRC settings (RPq Values) N/A 0.25 Sample and skimmer cones Nickel Nickel/aluminum Spray chamber Jacketed cyclonic spray chamber Jacketed cyclonic spray chamber Nebulizer Micro-flow PFA (100 µL/min) 200 µL/min Meinhard glass Dwell time (ms) 30 50 Resolution 6000 300 Detector Continuous dynode electron multiplier Sequential dynode electron multiplier Washout time 60 60 Copyright © 2012 SciRes. AJAC 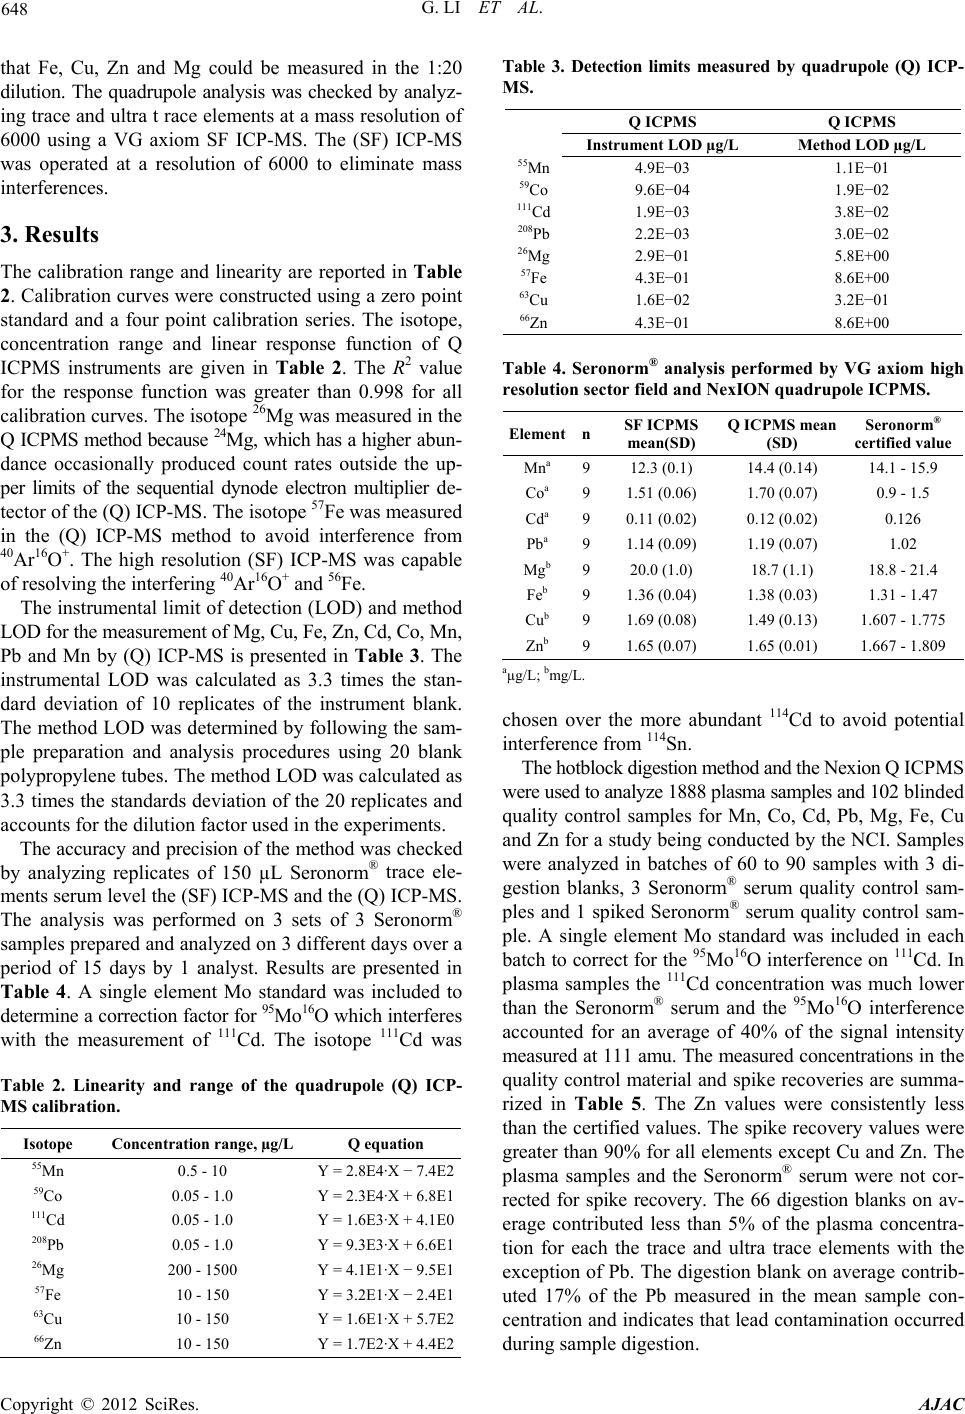 G. LI ET AL. 648 that Fe, Cu, Zn and Mg could be measured in the 1:20 dilution. The quadrupole analysis was checked by analyz- ing trace and ultra t race elements at a mass resolution of 6000 using a VG axiom SF ICP-MS. The (SF) ICP-MS was operated at a resolution of 6000 to eliminate mass interferences. 3. Results The calibration range and linearity are reported in Table 2. Calibration curves were constructed using a zero point standard and a four point calibration series. The isotope, concentration range and linear response function of Q ICPMS instruments are given in Table 2. The R2 value for the response function was greater than 0.998 for all calibration curves. The isotope 26Mg was measured in the Q ICPMS method because 24Mg, which has a higher abun- dance occasionally produced count rates outside the up- per limits of the sequential dynode electron multiplier de- tector of the (Q) ICP-MS. The isotope 57Fe was measured in the (Q) ICP-MS method to avoid interference from 40Ar16O+. The high resolution (SF) ICP-MS was capable of resolving the interfering 40Ar16O+ and 56Fe. The instrumental limit of detection (LOD) and method LOD for the measurement of Mg, Cu, Fe, Zn, Cd, Co, Mn, Pb and Mn by (Q) ICP-MS is presented in Table 3. The instrumental LOD was calculated as 3.3 times the stan- dard deviation of 10 replicates of the instrument blank. The method LOD was determined by following the sam- ple preparation and analysis procedures using 20 blank polypropylene tubes. The method LOD was calculated as 3.3 times the standards deviation of the 20 replicates and accounts for the dilution factor used in the experiments. The accuracy and precision of the method was checked by analyzing replicates of 150 µL Seronorm® trace ele- ments serum level the (SF) ICP-MS and the (Q) ICP-MS. The analysis was performed on 3 sets of 3 Seronorm® samples prepared and analyzed on 3 different days over a period of 15 days by 1 analyst. Results are presented in Table 4. A single element Mo standard was included to determine a correction factor for 95Mo16O which interferes with the measurement of 111Cd. The isotope 111Cd was Table 2. Linearity and range of the quadrupole (Q) ICP- MS calibration. Isotope Concentration range, µg/L Q equation 55Mn 0.5 - 10 Y = 2.8E4·X − 7.4E2 59Co 0.05 - 1.0 Y = 2.3E4·X + 6.8E1 111Cd 0.05 - 1.0 Y = 1.6E3·X + 4.1E0 208Pb 0.05 - 1.0 Y = 9.3E3·X + 6.6E1 26Mg 200 - 1500 Y = 4.1E1·X − 9.5E1 57Fe 10 - 150 Y = 3.2E1·X − 2.4E1 63Cu 10 - 150 Y = 1.6E1·X + 5.7E2 66Zn 10 - 150 Y = 1.7E2·X + 4.4E2 Table 3. Detection limits measured by quadrupole (Q) ICP- MS. Q ICPMS Q ICPMS Instrument LOD µg/L Method LOD µg/L 55Mn 4.9E−03 1.1E−01 59Co 9.6E−04 1.9E−02 111Cd 1.9E−03 3.8E−02 208Pb 2.2E−03 3.0E−02 26Mg 2.9E−01 5.8E+00 57Fe 4.3E−01 8.6E+00 63Cu 1.6E−02 3.2E−01 66Zn 4.3E−01 8.6E+00 Table 4. Seronorm® analysis performed by VG axiom high resolution sector fiel d and Ne xION quadrupole ICP MS. Element nSF ICPMS mean(SD) Q ICPMS mean (SD) Seronorm® certified value Mna 912.3 (0.1) 14.4 (0.14) 14.1 - 15.9 Coa 91.51 (0.06) 1.70 (0.07) 0.9 - 1.5 Cda 90.11 (0.02) 0.12 (0.02) 0.126 Pba 91.14 (0.09) 1.19 (0.07) 1.02 Mgb 920.0 (1.0) 18.7 (1.1) 18.8 - 21.4 Feb 91.36 (0.04) 1.38 (0.03) 1.31 - 1.47 Cub 91.69 (0.08) 1.49 (0.13) 1.607 - 1.775 Znb 91.65 (0.07) 1.65 (0.01) 1.667 - 1.809 aµg/L; bmg/L. chosen over the more abundant 114Cd to avoid potential interference from 114Sn. The hotblock digestion method and the Nexion Q ICPMS were used to analyze 1888 plasma samples and 102 blinded quality control samples for Mn, Co, Cd, Pb, Mg, Fe, Cu and Zn for a study being conducted by the NCI. Samples were analyzed in batches of 60 to 90 samples with 3 di- gestion blanks, 3 Seronorm® serum quality control sam- ples and 1 spiked Seronorm® serum quality control sam- ple. A single element Mo standard was included in each batch to correct for the 95Mo16O interference on 111Cd. In plasma samples the 111Cd concentration was much lower than the Seronorm® serum and the 95Mo16O interference accounted for an average of 40% of the signal intensity measured at 111 amu. The measured concentrations in the quality control material and spike recoveries are summa- rized in Table 5. The Zn values were consistently less than the certified values. The spike recovery values were greater than 90% for all elements except Cu and Zn. The plasma samples and the Seronorm® serum were not cor- rected for spike recovery. The 66 digestion blanks on av- erage contributed less than 5% of the plasma concentra- tion for each the trace and ultra trace elements with the exception of Pb. The digestion blank on average contrib- uted 17% of the Pb measured in the mean sample con- centration and indicates that lead contamination occurred during sample digestion. Copyright © 2012 SciRes. AJAC 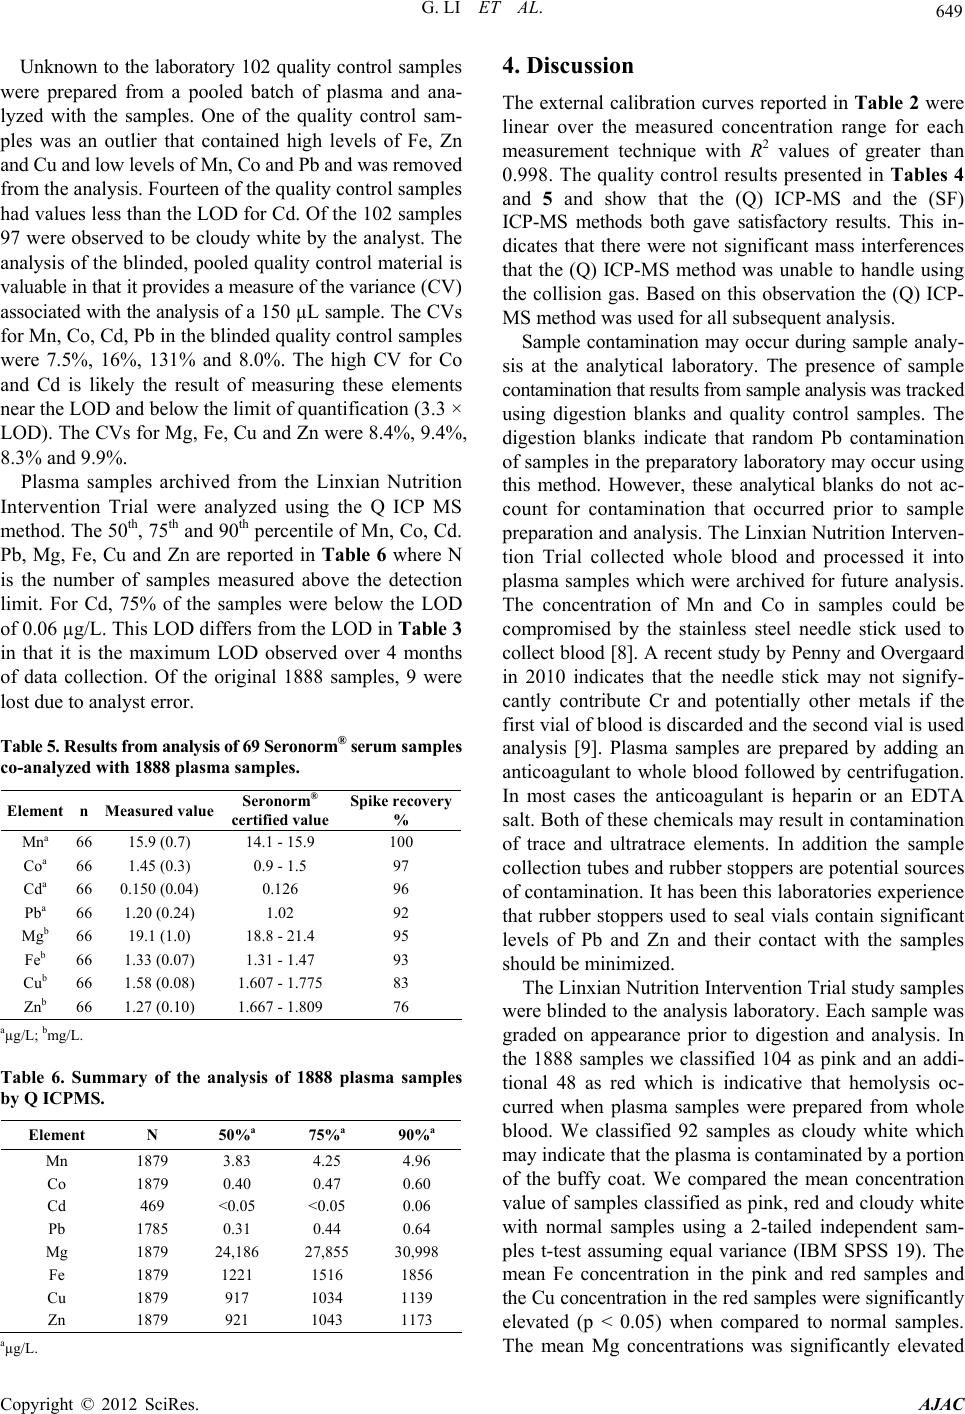 G. LI ET AL. 649 Unknown to the laboratory 102 quality control samples were prepared from a pooled batch of plasma and ana- lyzed with the samples. One of the quality control sam- ples was an outlier that contained high levels of Fe, Zn and Cu and low levels of Mn, Co and Pb and was removed from the analysis. Fourteen of the quality control samples had values less than the LOD for Cd. Of the 102 samples 97 were observed to be cloudy white by the analyst. The analysis of the blinded, pooled quality control material is valuable in that it provides a measure of the variance (CV) associated with the analysis of a 150 µL sample. The CVs for Mn, Co, Cd, Pb in the blinded quality control samples were 7.5%, 16%, 131% and 8.0%. The high CV for Co and Cd is likely the result of measuring these elements near the LOD and below the limit of quantification (3.3 × LOD). The CVs for Mg, Fe, Cu and Zn were 8.4%, 9.4%, 8.3% and 9.9%. Plasma samples archived from the Linxian Nutrition Intervention Trial were analyzed using the Q ICP MS method. The 50th, 75th and 90th percentile of Mn, Co, Cd. Pb, Mg, Fe, Cu and Zn are reported in Table 6 where N is the number of samples measured above the detection limit. For Cd, 75% of the samples were below the LOD of 0.06 µg/L. This LOD differs from the LOD in Table 3 in that it is the maximum LOD observed over 4 months of data collection. Of the original 1888 samples, 9 were lost due to analyst error. Table 5. Results from analysis of 69 Serono rm® serum samples co-analyzed with 1888 plasma samples. Element n Measured value Seronorm® certified value Spike recovery % Mna 66 15.9 (0.7) 14.1 - 15.9 100 Coa 66 1.45 (0.3) 0.9 - 1.5 97 Cda 66 0.150 (0.04) 0.126 96 Pba 66 1.20 (0.24) 1.02 92 Mgb 66 19.1 (1.0) 18.8 - 21.4 95 Feb 66 1.33 (0.07) 1.31 - 1.47 93 Cub 66 1.58 (0.08) 1.607 - 1.775 83 Znb 66 1.27 (0.10) 1.667 - 1.809 76 aµg/L; bmg/L. Table 6. Summary of the analysis of 1888 plasma samples by Q ICPMS. Element N 50%a 75%a 90%a Mn 1879 3.83 4.25 4.96 Co 1879 0.40 0.47 0.60 Cd 469 <0.05 <0.05 0.06 Pb 1785 0.31 0.44 0.64 Mg 1879 24,186 27,855 30,998 Fe 1879 1221 1516 1856 Cu 1879 917 1034 1139 Zn 1879 921 1043 1173 aµg/L. 4. Discussion The external calibration curves reported in Table 2 were linear over the measured concentration range for each measurement technique with R2 values of greater than 0.998. The quality control results presented in Tables 4 and 5 and show that the (Q) ICP-MS and the (SF) ICP-MS methods both gave satisfactory results. This in- dicates that there were not significant mass interferences that the (Q) ICP-MS method was unable to handle using the collision gas. Based on this observation the (Q) ICP- MS method was used for all subsequent analysis. Sample contamination may occur during sample analy- sis at the analytical laboratory. The presence of sample contamination that results from sample analysis was tracked using digestion blanks and quality control samples. The digestion blanks indicate that random Pb contamination of samples in the preparatory laboratory may occur using this method. However, these analytical blanks do not ac- count for contamination that occurred prior to sample preparation and analysis. The Linxian Nutrition Interven- tion Trial collected whole blood and processed it into plasma samples which were archived for future analysis. The concentration of Mn and Co in samples could be compromised by the stainless steel needle stick used to collect blood [8]. A recent study by Penny and Overgaard in 2010 indicates that the needle stick may not signify- cantly contribute Cr and potentially other metals if the first vial of blood is discarded and the second vial is used analysis [9]. Plasma samples are prepared by adding an anticoagulant to whole blood followed by centrifugation. In most cases the anticoagulant is heparin or an EDTA salt. Both of these chemicals may result in contamination of trace and ultratrace elements. In addition the sample collection tubes and rubber stoppers are potential sources of contamination. It has been this laboratories experience that rubber stoppers used to seal vials contain significant levels of Pb and Zn and their contact with the samples should be minimized. The Linxian Nutrition Intervention Trial study samples were blinded to the analysis laboratory. Each sample was graded on appearance prior to digestion and analysis. In the 1888 samples we classified 104 as pink and an addi- tional 48 as red which is indicative that hemolysis oc- curred when plasma samples were prepared from whole blood. We classified 92 samples as cloudy white which may indicate that the plasma is contaminated by a portion of the buffy coat. We compared the mean concentration value of samples classified as pink, red and cloudy white with normal samples using a 2-tailed independent sam- ples t-test assuming equal variance (IBM SPSS 19). The mean Fe concentration in the pink and red samples and the Cu concentration in the red samples were significantly elevated (p < 0.05) when compared to normal samples. The mean Mg concentrations was significantly elevated Copyright © 2012 SciRes. AJAC  G. LI ET AL. Copyright © 2012 SciRes. AJAC 650 (p < 0.05) and the Co concentration was significantly re- duced (p < 0.05) in the cloudy white samples when com- pared to normal samples. Based on this analysis it is im- portant for the analytical testing laboratory to provide qualitative information about the samples. At a minimum sample color should be noted. 5. Conclusion We have demonstrated that a hotblock digestion method coupled with high resolution sector field and Q ICPMS is capable of accurately analyzing Mn, Co, Cd, Pb, Mg, Fe, Cu and Zn in 150 µL plasma and serum samples. The minimal sample volume required by the analysis is im- portant because it preserves sample and allows research- ers to couple trace element measurement with other ana- lytical techniques to measure antibodies, proteins, DNA adducts and genotypes. To the best of our knowledge, there have been no other studies published in the litera- ture that have quantified the trace and ultratrace elements with this low sample volume. The method was used to analyze 1888 plasma samples for Mn, Co, Cd, Pb, Mg, Fe, Cu and Zn. 6. Acknowledgements This research was supported in part by the Intramural Research Program of the NIH, National Cancer Institute, Division of Cancer Epidemiology and Genetics. REFERENCES [1] H. Vanhoe, R. Dams and J. Versieck, “Use of Inductively Coupled Plasma Mass Spectrometry for the Determina- tion of Ultra-Trace Elements in Human Serum,” Journal of Analytical Atomic Spectrometry, Vol. 9, No. 1, 1994, pp. 23-31. doi:10.1039/ja9940900023 [2] E. Barany, I. A. Bergdahl, L. E. Bratteby, et al., “Trace Element Levels in Whole Blood and Serum from Swedish Adolescents,” Science of the Total Environment, Vol. 286, No. 1-3, 2002, pp. 129-141. doi:10.1016/S0048-9697(01)00970-6 [3] H. Vanhoe, C. Vandecasteele, J. Versieck and R. Dams, “Determination of Iron, Cobalt, Copper, Zinc, Rubidium, Molybdenum, and Cesium in Human Serum by Induc- tively Coupled Plasma Mass Spectrometry,” Analytical Chemistry, Vol. 61, No. 17, 1989, pp. 1851-1857. doi:10.1021/ac00192a014 [4] R. Forrer, K. Gautschi and H. Lutz, “Simultaneous Meas- urement of the Trace Elements Al, As, B, Be, Cd, Co, Cu, Fe, Li, Mn, Mo, Ni, Rb, Se, Sr, and Zn in Human Serum and Their Reference Ranges by ICP-MS,” Biological Trace Element Research, Vol. 80, No. 1, 2001, pp. 77-93. doi:10.1385/BTER:80:1:77 [5] C. M. Sariego, J. L. Fernandez-Martin, J. M. Marchante- Gayon, et al., “Reference Values for Trace and Ultratrace Elements in Human Serum Determined by Double Fo- cusing ICP-MS,” Biological Trace Element Research, Vol. 82, No. 1-2, 2001, pp. 259-272. doi:10.1385/BTER:82:1-3:259 [6] J. A. Nobrega, M. C. Santos, R. A. de Sousa, S. Cadore, R. M. Barnes and M. Tatro, “Sample Preparation in Alka- line Media,” Spectrochimica Acta Part B: Atomic Spec- troscopy, Vol. 61, No. 5, 2006, pp. 465-495. doi:10.1016/j.sab.2006.02.006 [7] D. Beauchemin, “Inductively Coupled Plasma Mass Spec- trometry,” Alytical Chemistry, Vol. 78, No. 12, 2006, pp. 4111-4135. doi:10.1021/ac060712t [8] J. Versieck, F. Barbier, R. Cornelis and J. Hoste, “Sample Contamination as a Source of Error in Trace-Element Analysis of Biological Samples,” Talanta, Vol. 29, No. 11, 1982, pp. 973-984. doi:10.1016/0039-9140(82)80238-5 [9] J. Penny and S. Overgaard, “Serum Chromium Levels Sampled with Steel Needle versus Plastic IV Cannula. Does Method Matter?” Journal of Biomedical Materials Research Part B, Vol. 92, No. 1, 2010, pp. 1-4. doi:10.1002/jbm.b.31479 |