L. J. SOLTZBERG ET AL.
Copyright © 2012 SciRes. AJAC
631
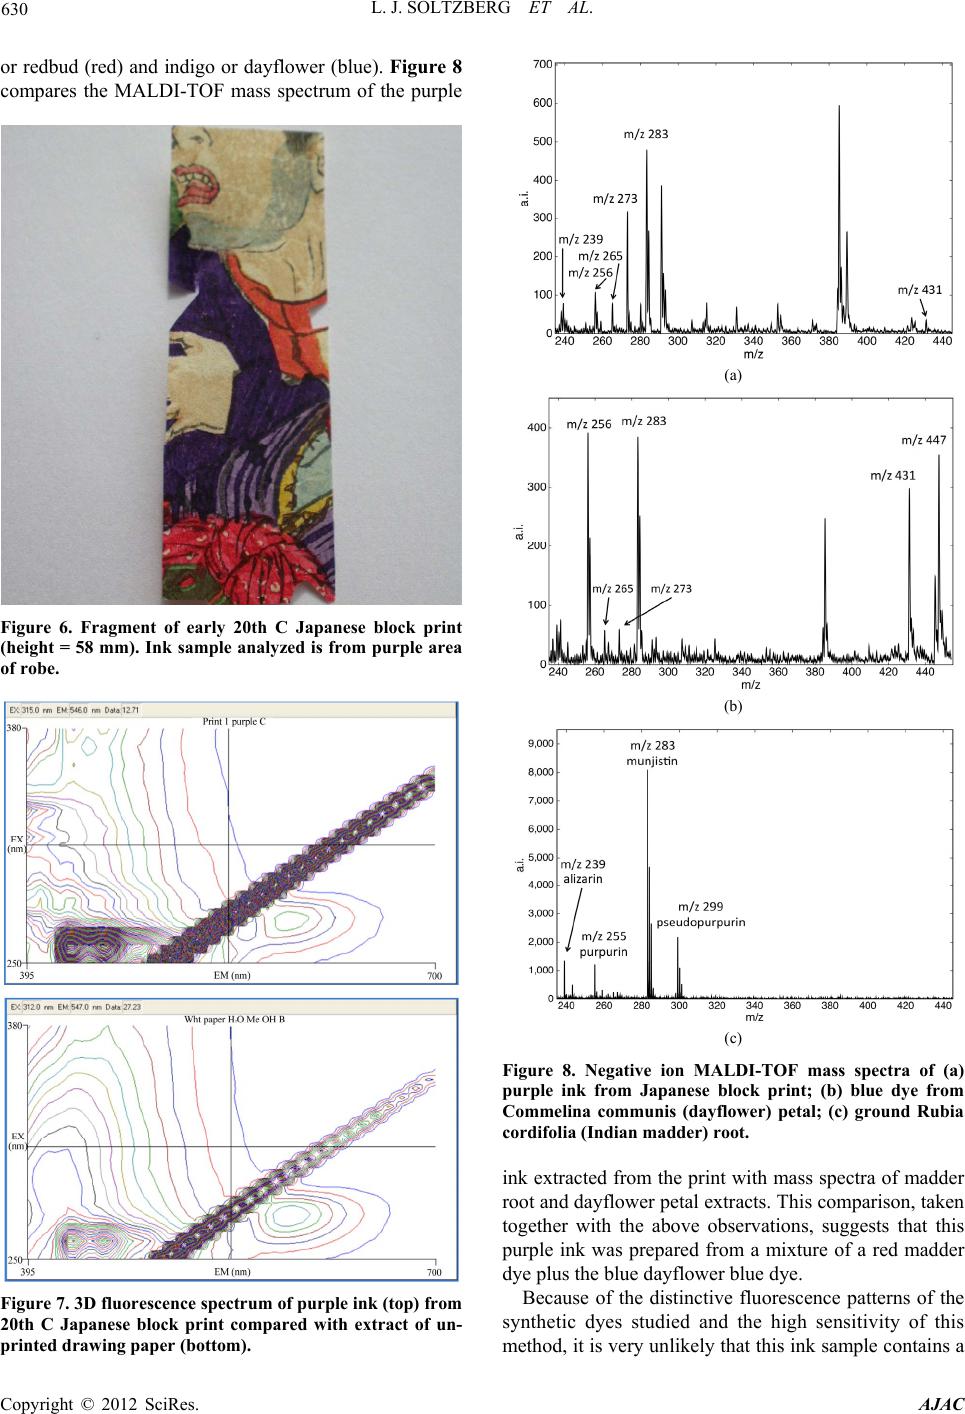
synthetic dye.
4. Conclusion
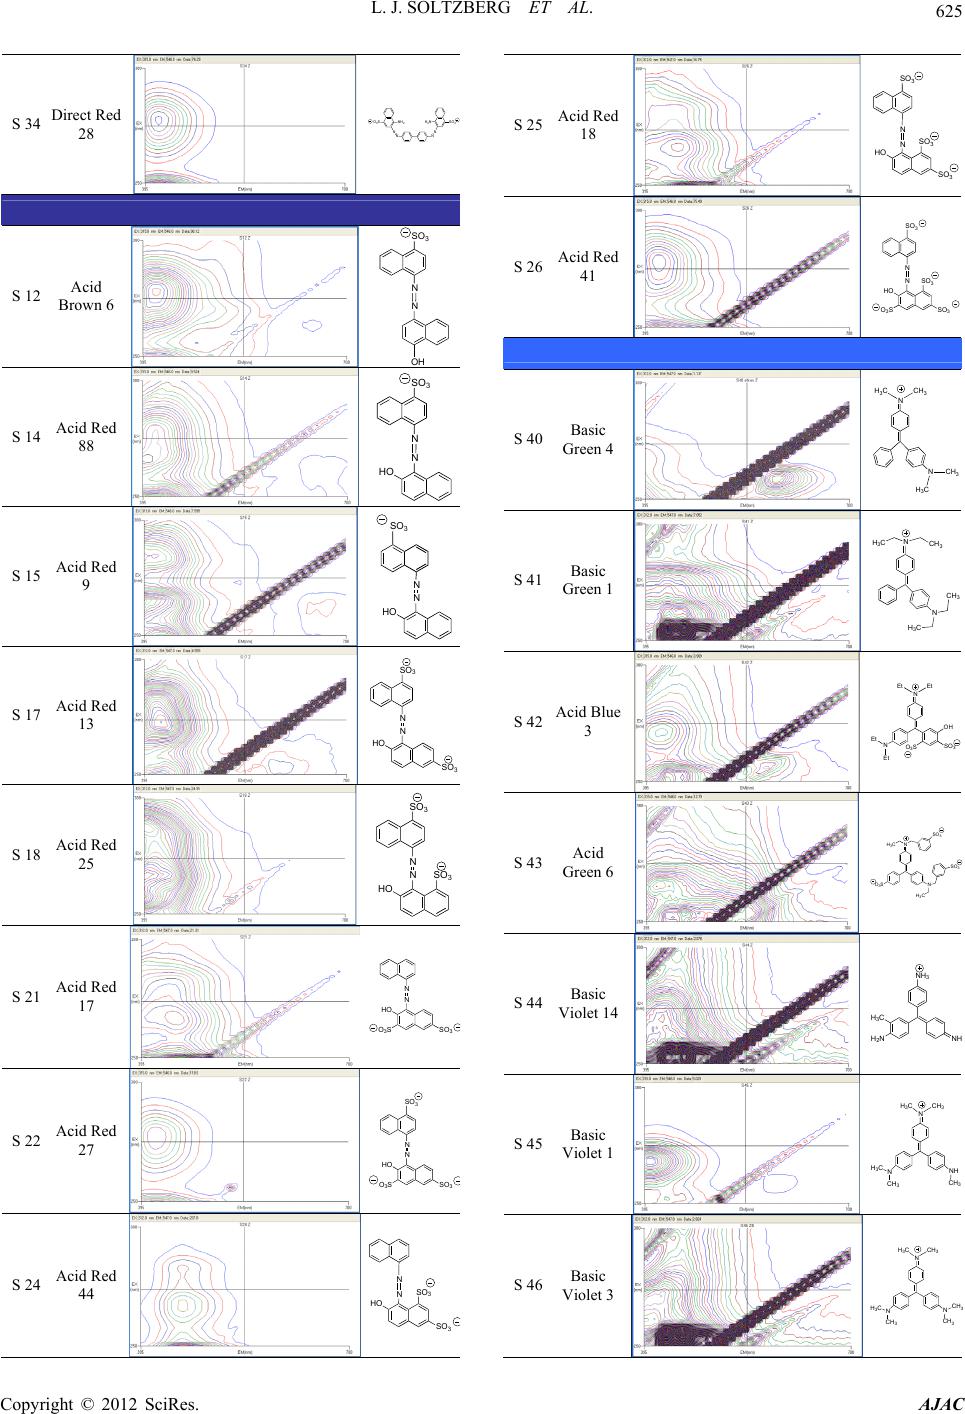
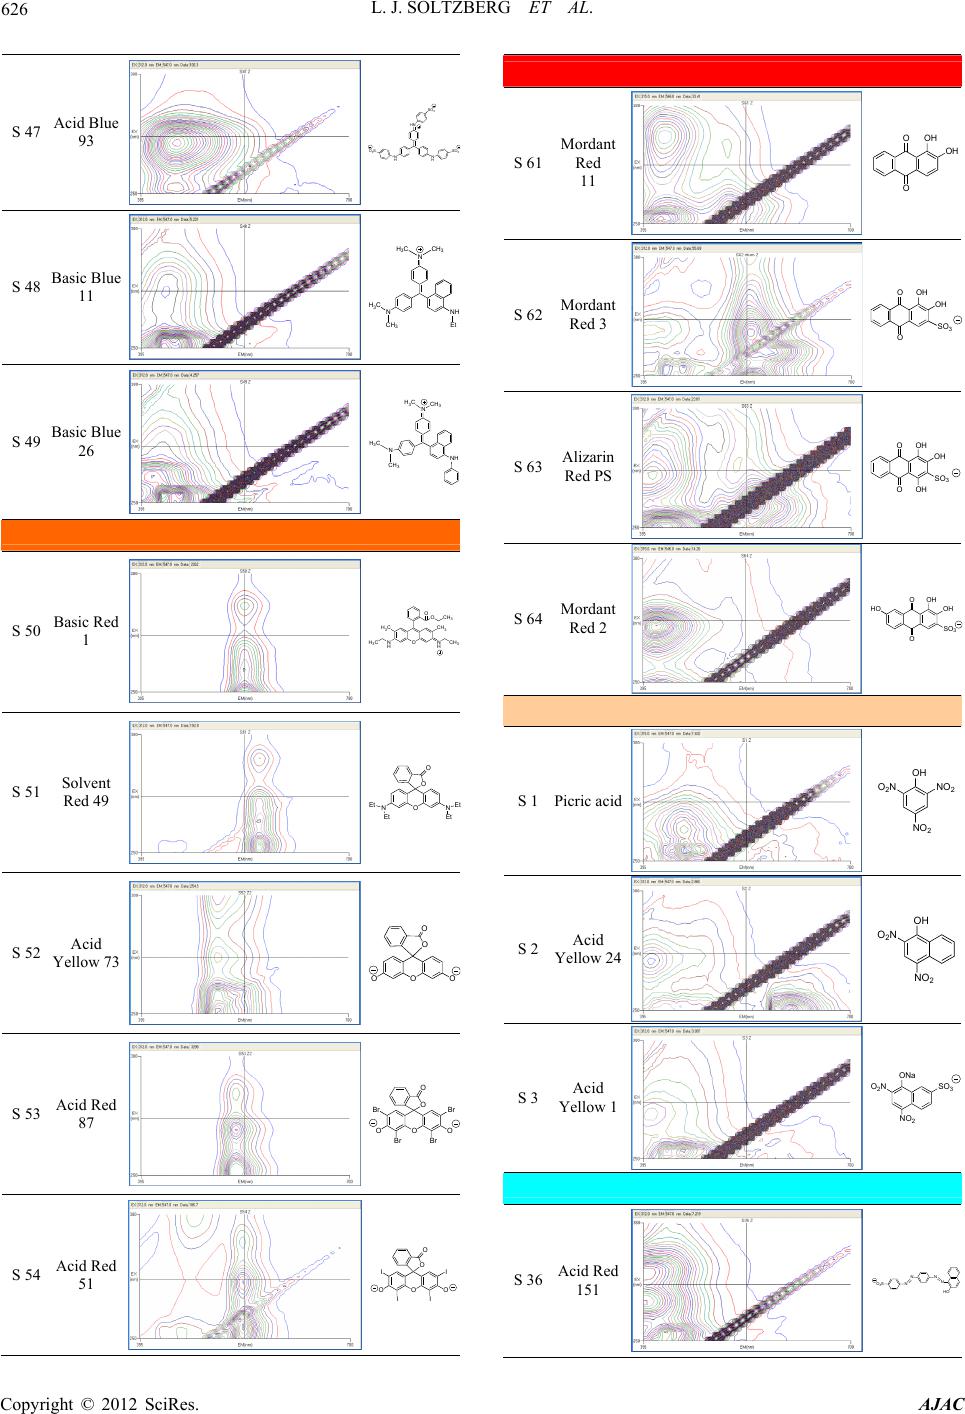
3D fluorescence spectra can provide an important tool for
the identification of dyes. These spectra serve as finger-
prints that are virtually unique, even among closely re-
lated dyes. The sensitivity of fluorescence spectrophotome-
try means that identification can be accomplished with
very small analyte samples. Supplemented by mass spec-
trometry when necessary, dye identification using 3D
fluorescence is a rapid and reliable analytical strategy.
5. Acknowledgements
We thank the Camille and Henry Dreyfus Foundation for
a Senior Faculty Mentor grant supporting the participa-
tion of Lor and Okey-Igwe. We also thank the National
Science Foundation for grant CHE-0216268. Mass spec-
tra in this manuscript were prepared using the application
mMass [14].
REFERENCES
[1] Boston Museum of Fine Arts, “Chilkat Dancing Blanket,”
Museum of Fine Arts, Boston, 2008.
[2] L. J. Soltzberg, A. Hagar, S. Kridaratikorn, A. Mattson
and R. Newman, “MALDI-TOF Mass Spectrometric
Identification of Dyes and Pigments,” Journal of the
American Society for Mass Spectrometry, Vol. 18, No. 11,
2007, pp. 2001-2006. doi:10.1016/j.jasms.2007.08.008
[3] M. Clarke, “A New Technique for the Non-Destructive
Identification of Organic Pigments, Dyes and Inks in-situ
on Early Mediaeval Manuscripts, Using 3-D Fluorescence
Reflectance Spectroscopy,” Proceedings of the 6th Inter-
national Conference on Non-Destructive Testing and Mi-
croanalysis for the Diagnostics and Conservation of the
Cultural and Environmental Heritage ART’99, Rome,
May 1999, pp. 1421-1436.
[4] M. R. van Bommel, I. Vanden Berghe, A. M. Wallert, R
Boitelle, J. Wouters, “High-Performance Liquid Chroma-
tography and Non-Destructive Three-Dimensional Fluo-
rescence Analysis of Early Synthetic Dyes,” Journal of
Chromatography A, Vol. 1157, No. 1-2, 2007, pp.
260-272. doi:10.1016/j.chroma.2007.05.017
[5] S. Shimoyama, Y. Noda and S. Kasuhara, “Non-Destruc-
tive Analysis of Ukiyo-E Prints,” In: P. W. Rogers, Ed.,
Dyes in History and Archaeology: 15, Textile Research
Associates, York, 1996.
[6] Schweppe Collection of Important Early Synthetic Dyes
(Getty Conservation Institute, Los Angeles, CA). “Prac-
tical Information for the Identification of Early Synthetic
Dyes,” Conservation Analytical Laboratory, Smithsonian
Institution, Washington DC, 1987.
[7] L. J. Soltzberg, J. D. Slinker, S. Flores-Torres, D. A.
Bernards, G. G. Malliaras, H. D. Abruna, J.-S. Kim, R. H.
Friend, M. D. Kaplan and V. Goldberg, “Identification of
a Quenching Species in Ruthenium Tris-Bipyridine Elec-
troluminescent Devices,” Journal of the American Che-
mical Society, Vol. 128, No. 24, 2006, pp. 7761-7764.
doi:10.1021/ja055782g
[8] F. J. Green, “The Sigma-Aldrich Handbook of Stains,
Dyes and Indicators,” Aldrich Chemical Company, Mil-
waukee, 1990.
[9] T. G. Adiks, A. F. Bunkin, V. A. Luk’yanchenko and S.
M. Pershin, “Variation in the Fluorescent Background in
Raman Spectra of Distilled Water Purified by Different
Methods,” Physics of Wave Phenomena, Vol. 16, 2008,
pp. 1-6.
[10] L. V. Belovolova, M. V. Glushkov, E. A. Vinogradov, V.
A. Babintsev and V. I. Golovanov, “Ultraviolet Fluores-
cence of Water and Highly Diluted Aqueous Media,”
Physics of Wave Phenomena, Vol. 17, No. 1, 2009, pp.
21-31. doi:10.3103/S1541308X0901004X
[11] “Hitachi High-Technologies Corporation Fluorescence
Spectrophotometer Instruction Manual-FL Solutions Pro-
gram-Operation,” 3rd Edition, Hitachi High-Technologies
Corporation, 24-14, Nishi-Shimbashi 1-Chome, Minatoku,
Tokyo, 2001.
[12] M. Clarke, “Limitations of Fluorescence Spectroscopy as
a Tool for Non-Destructive in situ Identification of Or-
ganic Pigments, Dyes and Inks,” Presented at 7th Inter-
national Conference on Non-Destructive Testing and Mi-
croanalysis for Diagnostics and Conservation of Cultural
and Environmental Heritage, Antwerp, 2-6 June 2002.
[13] R. L. Feller, M. Curran and C. Bailie, “Identification of
Traditional Organic Colorants in Japanese Prints and De-
termination of Their Rates of Fading,” In: R. S. Keyes,
Ed., Japanese Woodblock Prints: A Catalogue of the
Mary A. Ainsworth Collection, Allen Memorial Art Mu-
seum, Oberlin College, Oberlin, 1984.
[14] M. Strohalm, M Hassman, B. Košata, M. Kodíček,
“mMass Data Miner: An Open Source Alternative for
Mass Spectrometric Data Analysis,” Rapid Communica-
tions in Mass Spectrometry, Vol. 22, No. 6, 2008, pp.
905-908. doi:10.1002/rcm.3444