 Open Journal of Civil Engineering, 2012, 2, 183-192 http://dx.doi.org/10.4236/ojce.2012.23024 Published Online September 2012 (http://www.SciRP.org/journal/ojce) Changes in Land Use, Socioeconomic Indices, and the Transportation System in Gifu City and their Relevance during the Late 20th Century Min Guo1, Fumitaka Kurauchi2 1Graduate School of Engineering, Gifu University, Gifu, Japa n 2Department of Civil Engineering, Gifu University, Gifu, Japan Email: kurauchi@gifu-u.ac.jp Received July 31, 2012; revised August 30, 2012; accepted September 14, 2012 ABSTRACT History provides valuable lessons for the interplay of factors that shape urban growth and development. This study ex- amines changes in land use, socioeconomic indices, and the transportation system of Gifu City during the late 20th cen- tury using geographical information system (GIS) methods. The data for the study were historical maps and the popula- tion census and economic statistics data from 1950 to 2000, when Japan was in a period of high economic growth. The discussion focuses on the master plan, road construction, land use, the spatial distribution of the population, and socio- economic indices. It was possible to compare spatial distribution patterns o ver time using GIS. When policies were cre- ated that attached importance to construction of a road network due to the development of motorization and elimination of the city tram, the surrounding suburban area became the focus of land-use development. As a result, Gifu City is plagued by the doughnut phenomenon. It is important to identify the relationships among urban planning factors to pro- vide for future urban and transport a t i on planning. Keywords: Urban Planning; Land Use; Transportation System; Socioeconomic Indices; Geographical Information Systems 1. Introduction Rapid urbanization and growing economic prosperity have brought a higher rate of motorization to developed and developing countries. Motorization causes many problems such as exhaust pollution, traffic congestion, and an increase in the number of individuals who cannot drive. A shift to environmentally friendly and sustainable cities will require a reduction in the unnecessary car use and the use of public transportation and bicycles. History provides valuable lessons on the interplay of factors that shape urban growth and development. Many developed countries have experienced high economic growth and motorization. Willoughby [1] analyzed Sin- gapore’s motorization policies from 1960 to 2000, in- cluding fiscal policy, road pricing, transportation and land use, transportation externalities infrastructure, urban development, urban planning, and urban transportation to create a direction for further planning. It is important to identify the relationships among ur- ban planning factors to provide for future urban and transportation planning. Kishiue, Cal, Amano, and Li- dasan [2] adopted a historical approach to trace urban development in selected urban centers in Asia. In their study, they compared the planning patterns of each study area and conducted historical reviews of development in each area. Black, Cheung, Doust, and Shabtay [3] ana- lyzed spatial plans for Sydney from 1984-2031 focusing on metric changes in major employment centers. Computer methods have been used to analyze urban changes. Ho and Shibayama [4] studied the urban transi- tion in Hanoi in the late 20th century based on geo- graphic information sensing (GIS)/remote-sensing tech- nology. Because land-use changes are difficult to analyze by simply inspecting documents, we used a popular computer method (ArcGIS) to create spatial maps to compare urban changes with spatial-distribution patterns over time. 2. Data Overview and Outline 2.1. Data Overview The target area was Gifu City in Japan, a typical middle- sized city with a population of 402,185 (Table 1 [5]). With fewer bus users in the city, bus companies faced difficulties maintaining services, and three bus compa- nies merged into one. Furthermore, removal of the city C opyright © 2012 SciRes. OJCE  M. GUO, F. KURAUCHI 184 Table 1. Essential statistics of target city. Population 402,185 Schooling from the outside 11,772 [Central area] 74,531 Drivers license holders 247,607 [Surrounding area] 162,653 Car owners 279,177 [Suburban area] 165,001 Large size shops 64 Daytime population 426,865 Normal shops 7585 Families 153,336 Commercial sales [ten thousand yen] 18,918 Elderly persons 73,492 Business sites 25,382 Commuters 279,224 Workers 185,614 tram left buses as the only public transportation within most of the city. Thus, car use has been increasing gradually (Figure 1). Furthermore, motorization led to the dispersion of major urban facilities such as shops and public facilities, reducing access to such resources in the central area. As a result, the residential population and the number of shops and workplaces in the central area have declined over the past several years. Gifu City is in the center of Japan and is in the north of the third largest city in Japan (Nagoya) [6]. The primary access to Gifu is from the south. In this study, we used historical documents and maps from the past 40 years to review past urban-planning policies and transportation systems. We analyzed urban changes using the popula- tion census and economic statistics and examined changes in the transportation system using transporta- tion-use statistics. 2.2. Outline First, we will look at land use and socio economic indi- ces by reviewing the zone changes in population growth, industry, commerce and agriculture. Second, we will summarize the status of road construction an d public rail transportation. Lastly, we will show the spatial distribu- tion patterns over time to identify how changes in the transportatio n syste m aff ect land use and urban planning. 3. Land Use and Socio Economic Indices In this study, the city was divided into zones according to elementary school districts to analyze land use. Because it is difficult to find land-use info rmation from old maps, zone data were used to make a land-use map with GIS and to analyze the housing population, the number of industries and stores, and commercial and agricultural land use [7]. 3.1. Population Growth Population growth provides important information on the direction of urban development. The Gifu City popula- tion census from 1950 to 2005 was used to analyze population changes in this study. Figure 2 illustrates the population growth in the total, central, surrounding, and suburban areas. A significant increase in the total population occurred along with high economic growth in Japan from 1950 to the early 1960s, bu t during the 5 year s fro m 1970 to 197 5, the population increased just 6%. Then, population growth was almost stagnant, and the population has de- creased slightly since 1985. In contrast, the trends show large differences in the populations of particular areas. In 5.2% 4.6% 4.8% 4.4% 10.4% 7.3% 5.0% 3.3% 30.8% 40.3% 51.1% 60.1% 11.3% 18.1% 17.8% 15.6% 42.3% 29.7% 20.8% 16.6% 0.0%20.0% 40.0% 60.0% 80.0%100.0% 1971 1981 1991 2001 Rail Bus,Tram Car Bicycle Walk Figure 1. Mode share of trips in Gifu City. Population Growth 0 50,000 100,000 150,000 200,000 250,000 300,000 350,000 400,000 450,000 1950 1955 1960 19651970 1975 1980 1985 1990 19952000 2005 total centeral area surrounding area suburban area Legend Centr al area Surround ing area Suburban area Figure 2. Population growth of Gifu City. Copyright © 2012 SciRes. OJCE  M. GUO, F. KURAUCHI 185 the central area, including the heart of th e old city center and around the railway station, the population has de- clined from a peak in 1960-1965. Moreover, the popula- tion continues to decline even now. However, when population in this area was beginn ing to decrease around 1960, the population of the surrounding area increased remarkably. Furthermore, the population increased in the suburban area 10 years later. After 1985, the population in the suburban area became greater than that in the sur- rounding area, and the central area became depopulated. Based on these data, it appears that suburbanization in Gifu City began in 1965. This is also the period of start of high economic growth and motorization in Japan. Spatial population growth can be shown using GIS (Figure 3). This color-coded figure illustrates population growth by elementary school district every 5 years. The palest red means that the growth number is <0 and the population has decreased. The deepest red means that population in the zone increased significantly (>3000) during the 5 years. This figure shows that the population has moved from a central area to the surrounding and suburban areas. The rate of aging in the populatio n is shown in Figure 4. Aging has advanced around the central city. In 1985, the aged population rate was over 14% only in downtown and in two other zones, but in 2000, all of Gifu City could be considered an aging society, even a super-aging society. 1950~1955 1955~1960 1960~1965 1965~1970 1970~1975 1975~1980 1980~1985 1985~1990 1990~1995 Figure 3. Spatial population growth of Gifu City. Copyright © 2012 SciRes. OJCE  M. GUO, F. KURAUCHI 186 1985 1995 2000 Figure 4. Aged population rate of Gifu City. 3.2. Industry Figure 5 illustrates the distribution of industries in Gifu City. From 1960 to 1975, the number of enterprises in- creased in each area. However, since 1975, their number has declined continuously in the central and surrounding areas. This period coincides with the time when the ring road was constructed, particularly in the surrounding area to the south. Similar to the population change, the num- ber of enterp rises grew in the suburban area before 1995. But after 1995, the number of industrial enterprises has decreased, indicating that construction of the ring road influenced the change in industrial locations. This road also changed the population at the same time. Figure 6 shows the spatial an d te mporal chang es in the enterprise locatio ns in 1968, 1976, 1988, 19 99 using GIS. The figure shows that the main industrial zone has moved from the north central area to the south si nce 1970. 3.3. Commerce Figure 7 illustrates the distribution of stores in Gifu City, which represents the change in commercial activity. From 1966 to 1974, the number of stores increased continuously in all areas. From 1976 to 1979 , many small stores moved from the downtown area because a famous department store opened there, resulting in a rapid decrease in the number of stores during those 3 years. Until 1994, the number of stores was almost the same in all areas. Subsequently, the number of stores began to decrease in the central area year by year. New stores opening along the ring road were one reason that commerce outside the city increased. Figure 8 shows spatial and temporal changes in the number of Gifu City stores in 1968, 1976, 1988, 1999. From 1968 to 1976, the number of stores in the central area was constant, while the number increased in the surrounding areas. But after 1976, the number of stores in the central area clearly decreased, whereas the number of stores in the surrounding and suburban areas began to increase. 3.4. Agriculture Data on cultivated acreage were only found for 1975 to 1995. Figure 9 shows the spatial extent of cultivated acreage and illustrates the agriculture land-use situation. Cultivated acreage in the surrounding and suburban areas decreased during this time period. Thus, farmland conversion occurred in these areas due to changes in the population, industrial, and commerce zones. 4. Transportation System Next, we summarize the status of road construction and public rail transportation using historical maps and GIS- based documents [8-10]. Construction of the ring road had the largest impact on road maintenance in Gifu City (Figure 10). Figure 11 illustrates the road and rail net- works during years when major changes occurred: 1964, 1973, 1980, 1984, 1993, and 2005. Construction of the ring road was started in 1965 and completed in 2003. Since then, most of the through traffic within the city center has switched to using the ring road. Construction of the ring road has affected the formation of Gifu City, as commercial establishments such as restaurants and large shops are noticeable along this road, and most of the farmland has been replaced with personal houses. Figure 5. Distribution of enterprises of Gifu City. Copyright © 2012 SciRes. OJCE  M. GUO, F. KURAUCHI 187 1968 1976 1988 1999 Figure 6. Spatial enterprises number of Gifu City. Figure 7. Distribution of stores of Gifu City. 1968 1976 Copyright © 2012 SciRes. OJCE  M. GUO, F. KURAUCHI 188 1988 1999 Figure 8. Spatial stores number of Gifu City. 1975 1985 1995 Figure 9. Spatial cultivated acreage of Gifu City Figure 10. The ring road in Gifu City. 1964 1973 1980 Copyright © 2012 SciRes. OJCE 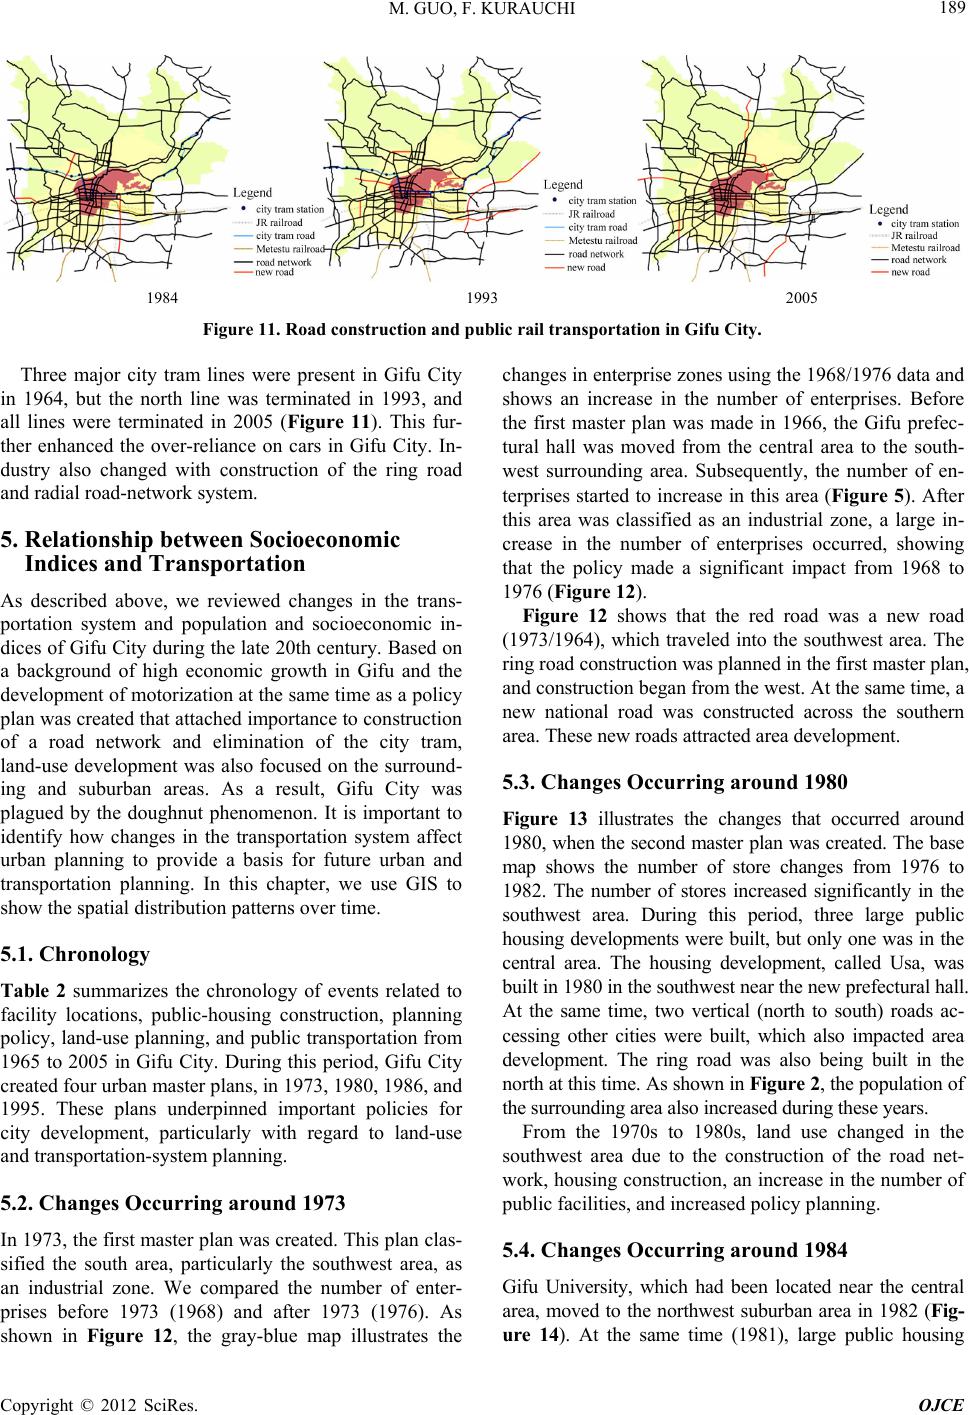 M. GUO, F. KURAUCHI Copyright © 2012 SciRes. OJCE 189 1984 1993 2005 Figure 11. Road construction and public rail transportation in Gifu City. Three major city tram lines were present in Gifu City in 1964, but the north line was terminated in 1993, and all lines were terminated in 2005 (Figure 11). This fur- ther enhanced the over-reliance on cars in Gifu City. In- dustry also changed with construction of the ring road and radial road-network system. 5. Relationship between Socioeconomic Indices and Transportation As described above, we reviewed changes in the trans- portation system and population and socioeconomic in- dices of Gifu City during the late 20th century. Based on a background of high economic growth in Gifu and the development of motorization at the same time as a policy plan was created that attached importance to construction of a road network and elimination of the city tram, land-use development was also focused on the surround- ing and suburban areas. As a result, Gifu City was plagued by the doughnut phenomenon. It is important to identify how changes in the transportation system affect urban planning to provide a basis for future urban and transportation planning. In this chapter, we use GIS to show the spatial distribution patterns over time. 5.1. Chronology Table 2 summarizes the chronology of events related to facility locations, public-housing construction, planning policy, land-use p lanning, and public transportation fro m 1965 to 2005 in Gifu City. During this period, Gifu City created four urban master plans, in 1973, 198 0, 1986, and 1995. These plans underpinned important policies for city development, particularly with regard to land-use and transportation-system planning. 5.2. Changes Occurring around 1973 In 1973, the first master plan was created. This plan clas- sified the south area, particularly the southwest area, as an industrial zone. We compared the number of enter- prises before 1973 (1968) and after 1973 (1976). As shown in Figure 12, the gray-blue map illustrates the changes in enterprise zones using the 1968/1976 data and shows an increase in the number of enterprises. Before the first master plan was made in 1966, the Gifu prefec- tural hall was moved from the central area to the south- west surrounding area. Subsequently, the number of en- terprises started to increase in this area (Figure 5). After this area was classified as an industrial zone, a large in- crease in the number of enterprises occurred, showing that the policy made a significant impact from 1968 to 1976 (Figure 12). Figure 12 shows that the red road was a new road (1973/1964), which traveled into the southwest area. The ring road construction was planned in the first master plan, and construction began from the west. At the same time, a new national road was constructed across the southern area. These new roads attracted area development. 5.3. Changes Occurring around 1980 Figure 13 illustrates the changes that occurred around 1980, when the second master plan was created. The base map shows the number of store changes from 1976 to 1982. The number of stores increased significantly in the southwest area. During this period, three large public housing developments were built, but only one was in the central area. The housing development, called Usa, was built in 1980 in the southwest near the new prefectural hall. At the same time, two vertical (north to south) roads ac- cessing other cities were built, which also impacted area development. The ring road was also being built in the north at th is ti me. As sh ow n in Figure 2 , the population of the surrounding area also increased during these years. From the 1970s to 1980s, land use changed in the southwest area due to the construction of the road net- work, housing construction , an increase in the number of public facilities, and increased policy planning. 5.4. Changes Occurring around 1984 Gifu University, which had been located near the central area, moved to the northwest suburban area in 1982 (Fig- ure 14). At the same time (1981), large public housing  M. GUO, F. KURAUCHI 190 Table 2. Chronological table of Gifu City urban development. Year Event (facility) Public Housing (over 100 households) Planning Policy, Land-use Planning City Tram 1966 Gifu Prefecture Office Hall was moved to the surrounding area 1970 Tagami Line opened 1971 Mitahora 1973 Ring-road construction was star ted 1975 Uekano 1976 Ohora 1977 A new department store was opened in the central area First mas ter pla n wa s cr eate d: Clarified land use through urban planning; Land use categorized into city center, industrial zone, housing zone, commercial zone, agriculture zone and green zone; Ring-road construction was planned [11]. 1980 Usa 1981 Kurono 1982 Gifu University was moved to a suburban area 1983 Second master plan was created: Land-use zones were fixed based on the first master plan; Regional highway network with access to other cities was planned; Public tra nspor tati on was c hange d to bus; Ring road was a focus [12] 1986 The new JR West Gifu stati on wa s op ene d Soden 1988 A new large shopping mall was opened in the surrounding area Nagara Line eliminated 1991 A new large sports studio was opened in the surrounding area Sakuragi 1993 Shima Third master plan was created: Radial ring network was planned to be the major facil- ity construction; Land use was zoned to seven zones such: city center, northeast, north, northwest, west, south, and east; each zone had a detailed delimited land-use class; Integrated transportation system was planned [13] 1995 Gifu Prefectural Library was moved to the surrounding area 1999 A department store in the central area closed 2002 Another department store closed in the central area Nagamori 2005 Fourth master plan was created: The central ar ea was the focus; Surrounding area was planned as industrial and com- mercial z ones ; Natural scenery became important; Road construction, such as the radial ring network, was also a focus An integrated t ransportation system was planned again based on a bus network [14] All elim inat e d Figure 12. Changes around 1973. Figure 13. Changes around 1980. Copyright © 2012 SciRes. OJCE 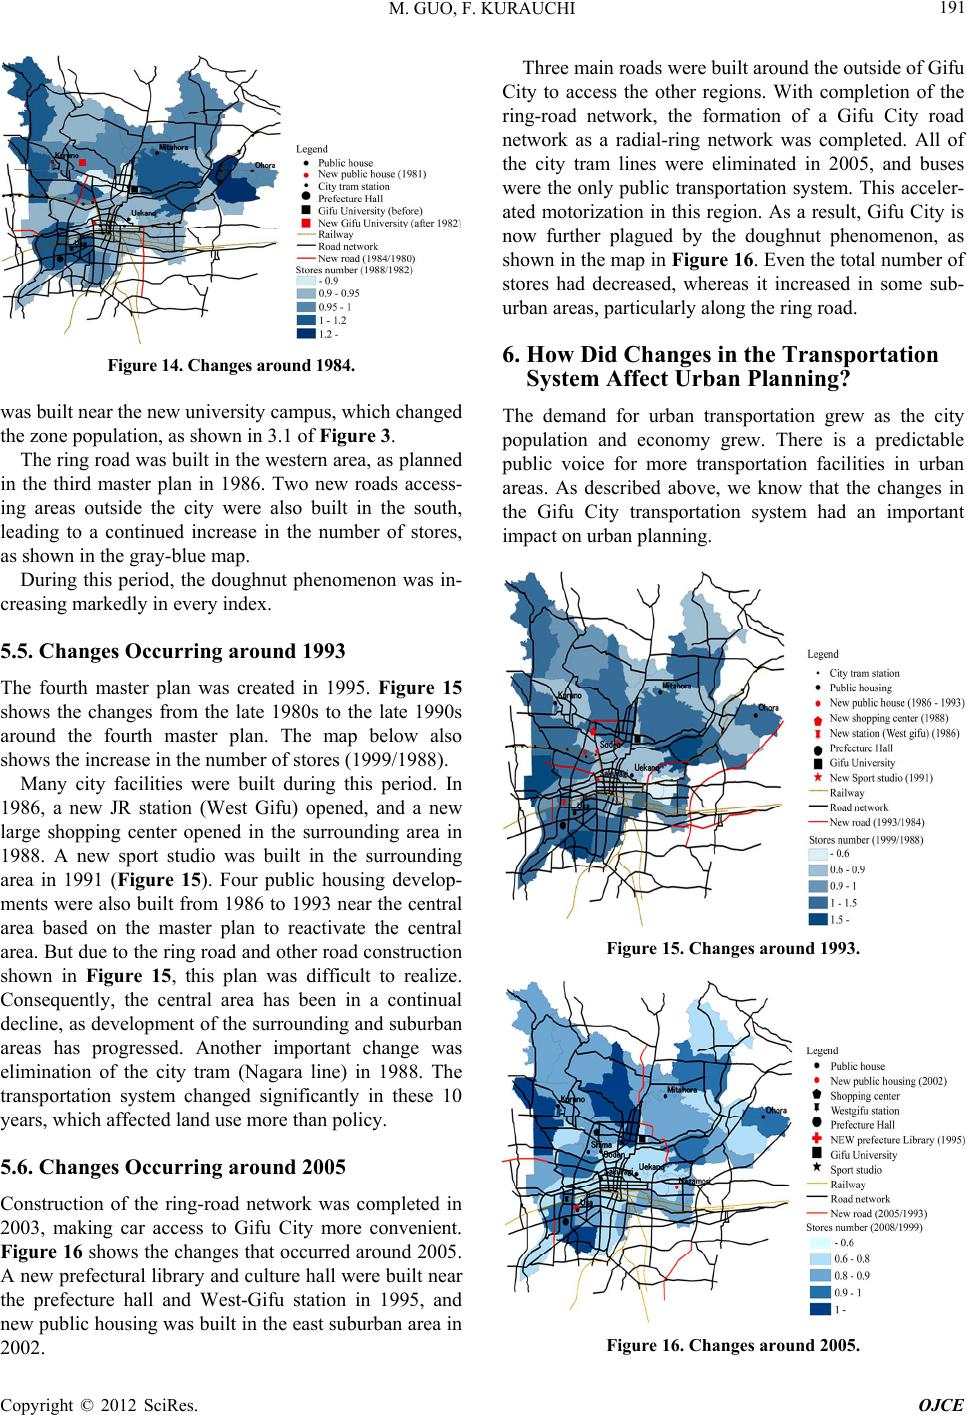 M. GUO, F. KURAUCHI 191 Figure 14. Changes around 1984. was built near the new university ca mpus, which changed the zone population, as shown in 3.1 of Figure 3. The ring road was built in the western area, as planned in the third master plan in 1986. Two new roads access- ing areas outside the city were also built in the south, leading to a continued increase in the number of stores, as shown in the gray-blue map. During this period, the doughnut phenomenon was in- creasing markedly in every index. 5.5. Changes Occurring around 1993 The fourth master plan was created in 1995. Figure 15 shows the changes from the late 1980s to the late 1990s around the fourth master plan. The map below also shows the increase in the number of stores (1999/1988). Many city facilities were built during this period. In 1986, a new JR station (West Gifu) opened, and a new large shopping center opened in the surrounding area in 1988. A new sport studio was built in the surrounding area in 1991 (Figure 15). Four public housing develop- ments were also built from 1986 to 199 3 near the central area based on the master plan to reactivate the central area. But due to the ring road and other road construction shown in Figure 15, this plan was difficult to realize. Consequently, the central area has been in a continual decline, as development of the surrounding and suburban areas has progressed. Another important change was elimination of the city tram (Nagara line) in 1988. The transportation system changed significantly in these 10 years, which affected land use more than policy. 5.6. Changes Occurring around 2005 Construction of the ring-road network was completed in 2003, making car access to Gifu City more convenient. Figure 16 shows the change s that occurred aroun d 2005. A new prefectural library and culture hall were built near the prefecture hall and West-Gifu station in 1995, and new public housing was built in the east subu rban area in 2002. Three main roads were built around the outside of Gifu City to access the other regions. With completion of the ring-road network, the formation of a Gifu City road network as a radial-ring network was completed. All of the city tram lines were eliminated in 2005, and buses were the only public transportation system. This acceler- ated motorization in this region. As a result, Gifu City is now further plagued by the doughnut phenomenon, as shown in the map in Figure 16. Even the total number of stores had decreased, whereas it increased in some sub- urban areas, particularly along the ring road. 6. How Did Changes in the Transportation System Affect Urban Planning? The demand for urban transportation grew as the city population and economy grew. There is a predictable public voice for more transportation facilities in urban areas. As described above, we know that the changes in the Gifu City transportation system had an important impact on u rb an plannin g. Figure 15. Changes around 1993. Figure 16. Changes around 2005. Copyright © 2012 SciRes. OJCE 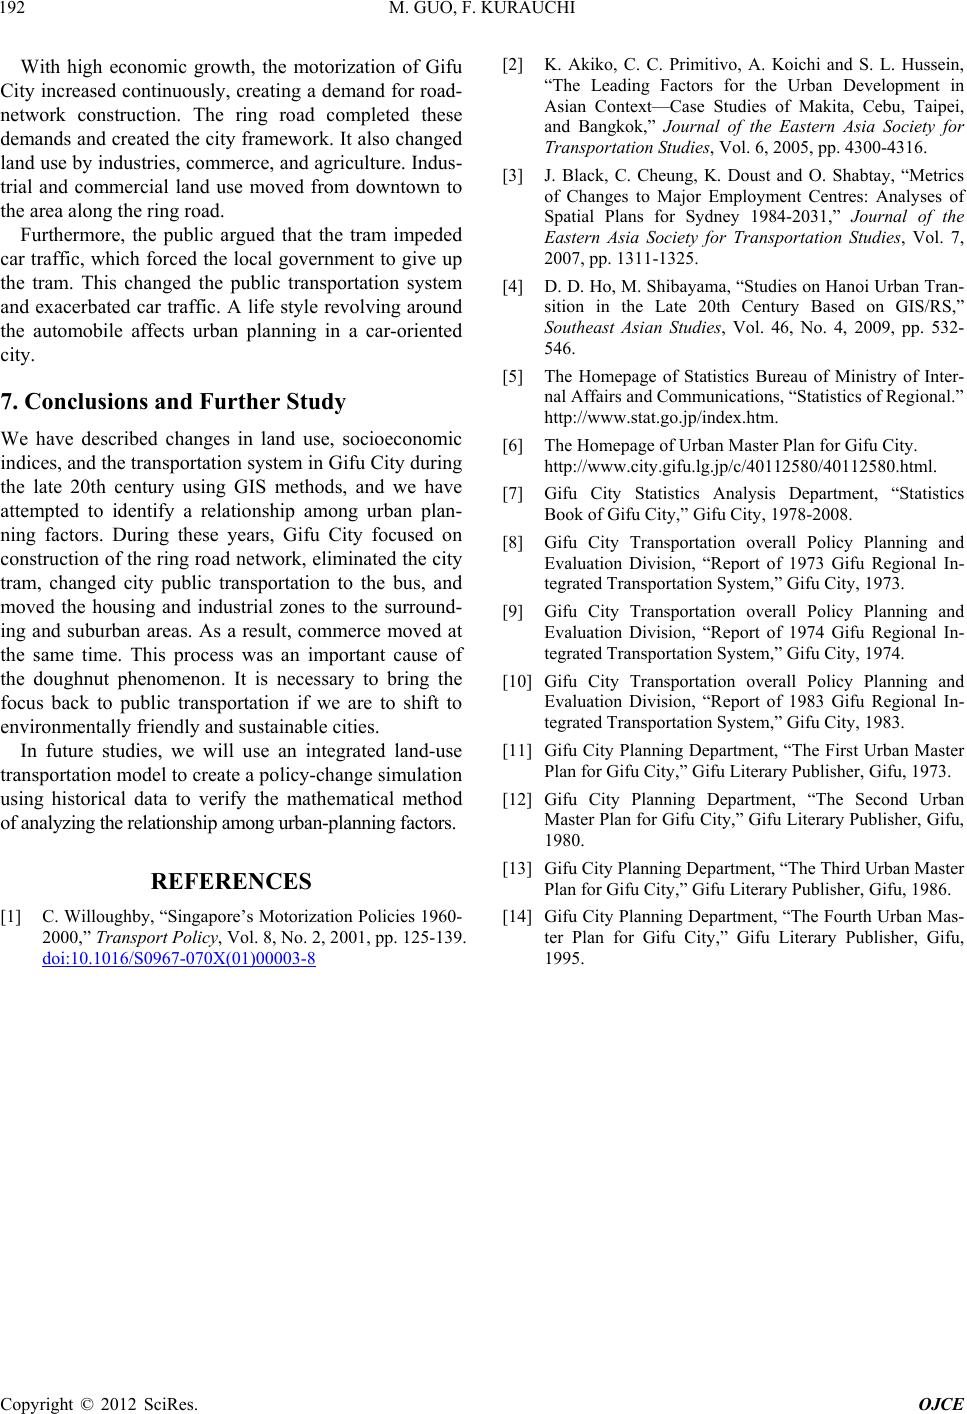 M. GUO, F. KURAUCHI Copyright © 2012 SciRes. OJCE 192 With high economic growth, the motorization of Gifu City increased continuously, creating a demand for road- network construction. The ring road completed these demands and created the city framework. It also changed land use by industries, commerce, and agriculture. Indus- trial and commercial land use moved from downtown to the area along the ring road. Furthermore, the public argued that the tram impeded car traffic, which forced the local government to give up the tram. This changed the public transportation system and exacerbated car traffic. A life style revolving around the automobile affects urban planning in a car-oriented city. 7. Conclusions and Further Study We have described changes in land use, socioeconomic indices, and the transportation system in Gifu City d uring the late 20th century using GIS methods, and we have attempted to identify a relationship among urban plan- ning factors. During these years, Gifu City focused on construction of th e ring road network, eliminated the city tram, changed city public transportation to the bus, and moved the housing and industrial zones to the surround- ing and suburban areas. As a result, commerce moved at the same time. This process was an important cause of the doughnut phenomenon. It is necessary to bring the focus back to public transportation if we are to shift to environmentally friendly and sustainable cities. In future studies, we will use an integrated land-use transportation model to create a p olicy-ch ang e simulation using historical data to verify the mathematical method of analyzing the relationship among urban-planning factors. REFERENCES [1] C. Willoughby, “Singapore’s Motorization Policies 1960- 2000,” Transport Policy, Vol. 8, No. 2, 2001, pp. 125-139. doi:10.1016/S0967-070X(01)00003-8 [2] K. Akiko, C. C. Primitivo, A. Koichi and S. L. Hussein, “The Leading Factors for the Urban Development in Asian Context—Case Studies of Makita, Cebu, Taipei, and Bangkok,” Journal of the Eastern Asia Society for Transportation Studies, Vol. 6, 2005, pp. 4300-4316. [3] J. Black, C. Cheung, K. Doust and O. Shabtay, “Metrics of Changes to Major Employment Centres: Analyses of Spatial Plans for Sydney 1984-2031,” Journal of the Eastern Asia Society for Transportation Studies, Vol. 7, 2007, pp. 1311-1325. [4] D. D. Ho, M. Shibayama, “Studies on Hanoi Urban Tran- sition in the Late 20th Century Based on GIS/RS,” Southeast Asian Studies, Vol. 46, No. 4, 2009, pp. 532- 546. [5] The Homepage of Statistics Bureau of Ministry of Inter- nal Affairs and Communications, “Statistics of Regional.” http://www.stat.go.jp/index.htm. [6] The Homepage of Urban Master Plan for Gifu City. http://www.city.gifu.lg.jp/c/40112580/40112580.html. [7] Gifu City Statistics Analysis Department, “Statistics Book of Gifu City,” Gifu City, 1978-2008. [8] Gifu City Transportation overall Policy Planning and Evaluation Division, “Report of 1973 Gifu Regional In- tegrated Transportation System,” Gifu City, 1973. [9] Gifu City Transportation overall Policy Planning and Evaluation Division, “Report of 1974 Gifu Regional In- tegrated Transportation System,” Gifu City, 1974. [10] Gifu City Transportation overall Policy Planning and Evaluation Division, “Report of 1983 Gifu Regional In- tegrated Transportation System,” Gifu City, 1983. [11] Gifu City Planning Department, “The First Urban Master Plan for Gifu City,” Gifu Literary Publisher, Gifu, 1973. [12] Gifu City Planning Department, “The Second Urban Master Plan for Gifu City,” Gifu Literary Publisher, Gifu, 1980. [13] Gifu City Planning Department, “The Third Urban Master Plan for Gifu City,” Gifu Literary Publisher, Gifu, 1986. [14] Gifu City Planning Department, “The Fourth Urban Mas- ter Plan for Gifu City,” Gifu Literary Publisher, Gifu, 1995.
|