Paper Menu >>
Journal Menu >>
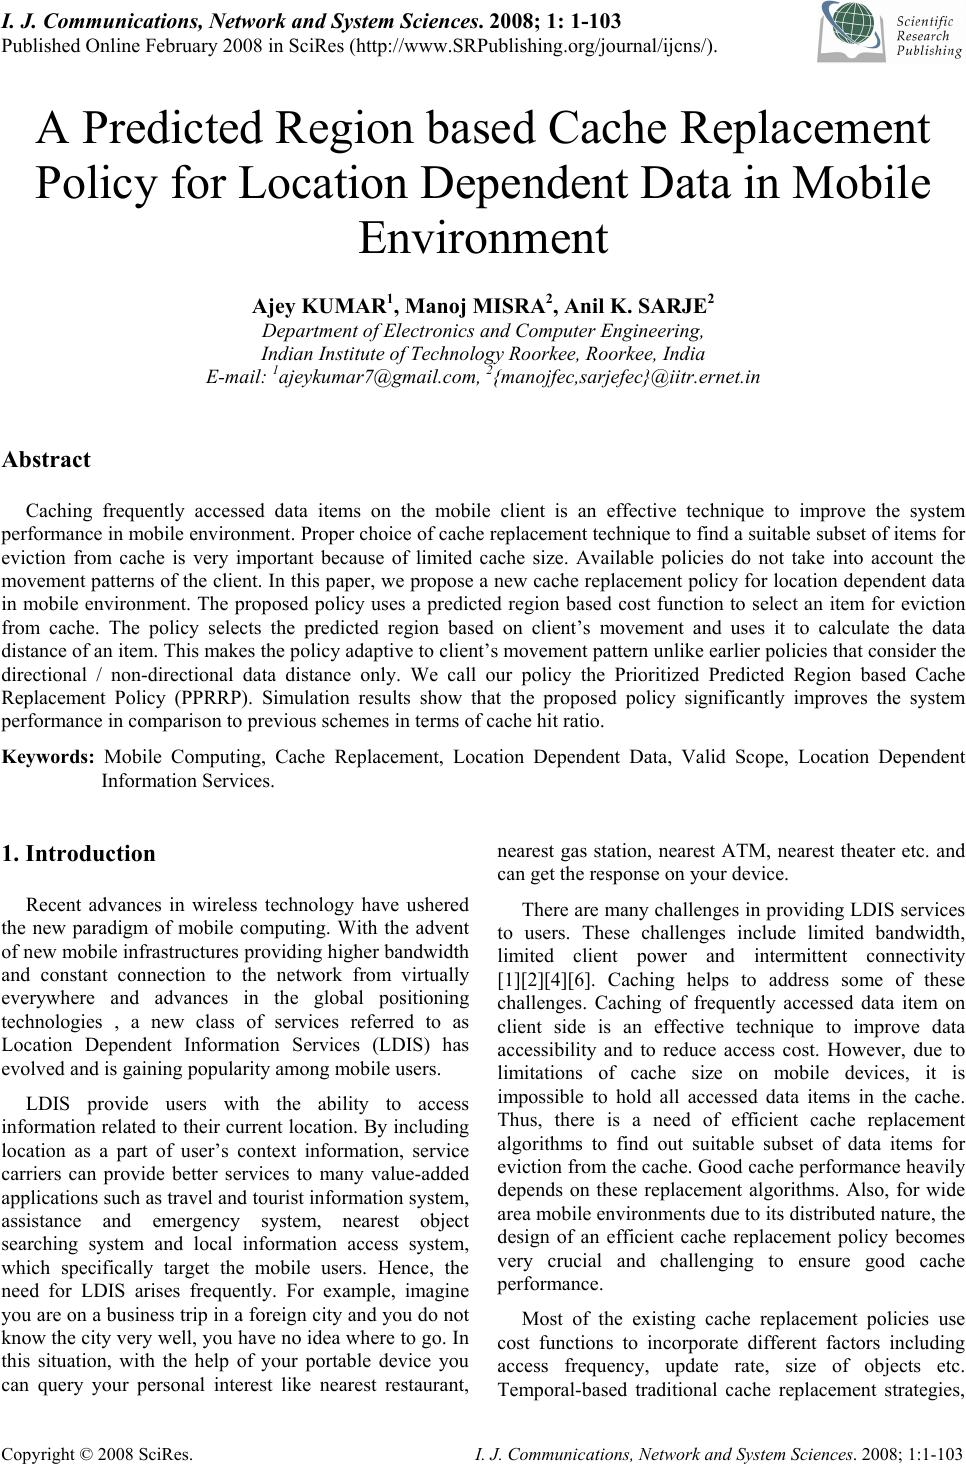 I. J. Communications, Network and System Sciences. 2008; 1: 1-103 Published Online February 2008 in SciRes (http://www.SRPublishing.org/journal/ijcns/). Copyright © 2008 SciRes. I. J. Communications, Network and System Sciences. 2008; 1:1-103 A Predicted Region based Cache Replacement Policy for Location Dependent Data in Mobile Environment Ajey KUMAR1, Manoj MISRA2, Anil K. SARJE2 Department of Electronics and Computer Engineering, Indian Institute of Technology Roorkee, Roorkee, India E-mail: 1ajeykumar7@gmail.com, 2{manojfec,sarjefec}@iitr.ernet.in Abstract Caching frequently accessed data items on the mobile client is an effective technique to improve the system performance in mobile environment. Proper choice of cache replacement technique to find a suitable subset of items for eviction from cache is very important because of limited cache size. Available policies do not take into account the movement patterns of the client. In this paper, we propose a new cache replacement policy for location dependent data in mobile environment. The proposed policy uses a predicted region based cost function to select an item for eviction from cache. The policy selects the predicted region based on client’s movement and uses it to calculate the data distance of an item. This makes the policy adaptive to client’s movement pattern unlike earlier policies that consider the directional / non-directional data distance only. We call our policy the Prioritized Predicted Region based Cache Replacement Policy (PPRRP). Simulation results show that the proposed policy significantly improves the system performance in comparison to previous schemes in terms of cache hit ratio. Keywords: Mobile Computing, Cache Replacement, Location Dependent Data, Valid Scope, Location Dependent Information Services. 1. Introduction Recent advances in wireless technology have ushered the new paradigm of mobile computing. With the advent of new mobile infrastructures providing higher bandwidth and constant connection to the network from virtually everywhere and advances in the global positioning technologies , a new class of services referred to as Location Dependent Information Services (LDIS) has evolved and is gaining popularity among mobile users. LDIS provide users with the ability to access information related to their current location. By including location as a part of user’s context information, service carriers can provide better services to many value-added applications such as travel and tourist information system, assistance and emergency system, nearest object searching system and local information access system, which specifically target the mobile users. Hence, the need for LDIS arises frequently. For example, imagine you are on a business trip in a foreign city and you do not know the city very well, you have no idea where to go. In this situation, with the help of your portable device you can query your personal interest like nearest restaurant, nearest gas station, nearest ATM, nearest theater etc. and can get the response on your device. There are many challenges in providing LDIS services to users. These challenges include limited bandwidth, limited client power and intermittent connectivity [1][2][4][6]. Caching helps to address some of these challenges. Caching of frequently accessed data item on client side is an effective technique to improve data accessibility and to reduce access cost. However, due to limitations of cache size on mobile devices, it is impossible to hold all accessed data items in the cache. Thus, there is a need of efficient cache replacement algorithms to find out suitable subset of data items for eviction from the cache. Good cache performance heavily depends on these replacement algorithms. Also, for wide area mobile environments due to its distributed nature, the design of an efficient cache replacement policy becomes very crucial and challenging to ensure good cache performance. Most of the existing cache replacement policies use cost functions to incorporate different factors including access frequency, update rate, size of objects etc. Temporal-based traditional cache replacement strategies, 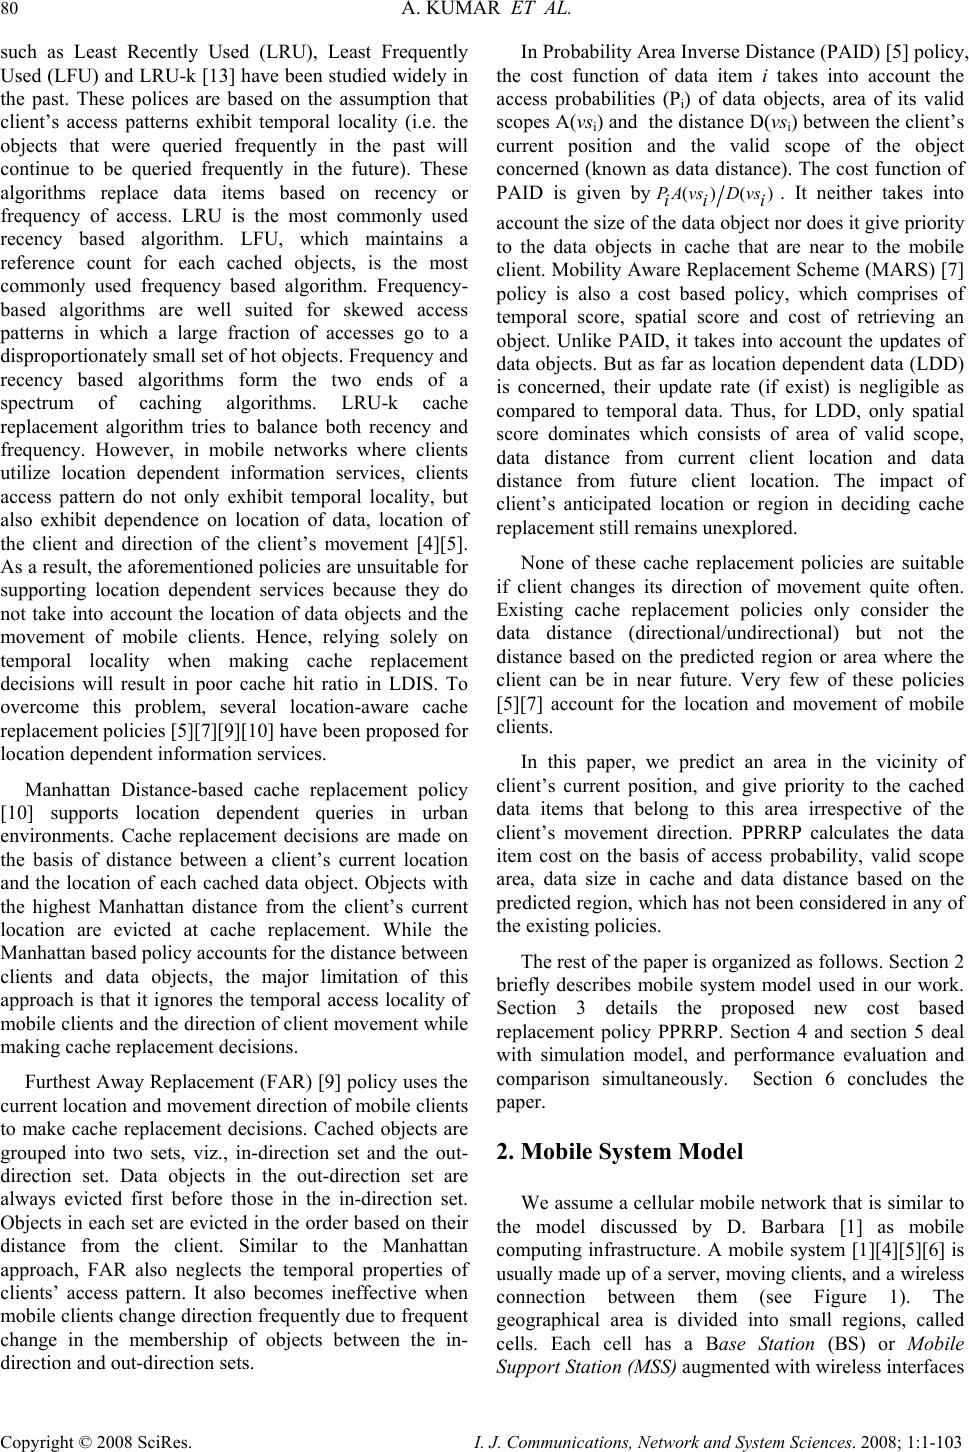 80 A. KUMAR ET AL. Copyright © 2008 SciRes. I. J. Communications, Network and System Sciences. 2008; 1:1-103 such as Least Recently Used (LRU), Least Frequently Used (LFU) and LRU-k [13] have been studied widely in the past. These polices are based on the assumption that client’s access patterns exhibit temporal locality (i.e. the objects that were queried frequently in the past will continue to be queried frequently in the future). These algorithms replace data items based on recency or frequency of access. LRU is the most commonly used recency based algorithm. LFU, which maintains a reference count for each cached objects, is the most commonly used frequency based algorithm. Frequency- based algorithms are well suited for skewed access patterns in which a large fraction of accesses go to a disproportionately small set of hot objects. Frequency and recency based algorithms form the two ends of a spectrum of caching algorithms. LRU-k cache replacement algorithm tries to balance both recency and frequency. However, in mobile networks where clients utilize location dependent information services, clients access pattern do not only exhibit temporal locality, but also exhibit dependence on location of data, location of the client and direction of the client’s movement [4][5]. As a result, the aforementioned policies are unsuitable for supporting location dependent services because they do not take into account the location of data objects and the movement of mobile clients. Hence, relying solely on temporal locality when making cache replacement decisions will result in poor cache hit ratio in LDIS. To overcome this problem, several location-aware cache replacement policies [5][7][9][10] have been proposed for location dependent information services. Manhattan Distance-based cache replacement policy [10] supports location dependent queries in urban environments. Cache replacement decisions are made on the basis of distance between a client’s current location and the location of each cached data object. Objects with the highest Manhattan distance from the client’s current location are evicted at cache replacement. While the Manhattan based policy accounts for the distance between clients and data objects, the major limitation of this approach is that it ignores the temporal access locality of mobile clients and the direction of client movement while making cache replacement decisions. Furthest Away Replacement (FAR) [9] policy uses the current location and movement direction of mobile clients to make cache replacement decisions. Cached objects are grouped into two sets, viz., in-direction set and the out- direction set. Data objects in the out-direction set are always evicted first before those in the in-direction set. Objects in each set are evicted in the order based on their distance from the client. Similar to the Manhattan approach, FAR also neglects the temporal properties of clients’ access pattern. It also becomes ineffective when mobile clients change direction frequently due to frequent change in the membership of objects between the in- direction and out-direction sets. In Probability Area Inverse Distance (PAID) [5] policy, the cost function of data item i takes into account the access probabilities (Pi) of data objects, area of its valid scopes A(vsi) and the distance D(vsi) between the client’s current position and the valid scope of the object concerned (known as data distance). The cost function of PAID is given by() ()PAvsD vs ii i . It neither takes into account the size of the data object nor does it give priority to the data objects in cache that are near to the mobile client. Mobility Aware Replacement Scheme (MARS) [7] policy is also a cost based policy, which comprises of temporal score, spatial score and cost of retrieving an object. Unlike PAID, it takes into account the updates of data objects. But as far as location dependent data (LDD) is concerned, their update rate (if exist) is negligible as compared to temporal data. Thus, for LDD, only spatial score dominates which consists of area of valid scope, data distance from current client location and data distance from future client location. The impact of client’s anticipated location or region in deciding cache replacement still remains unexplored. None of these cache replacement policies are suitable if client changes its direction of movement quite often. Existing cache replacement policies only consider the data distance (directional/undirectional) but not the distance based on the predicted region or area where the client can be in near future. Very few of these policies [5][7] account for the location and movement of mobile clients. In this paper, we predict an area in the vicinity of client’s current position, and give priority to the cached data items that belong to this area irrespective of the client’s movement direction. PPRRP calculates the data item cost on the basis of access probability, valid scope area, data size in cache and data distance based on the predicted region, which has not been considered in any of the existing policies. The rest of the paper is organized as follows. Section 2 briefly describes mobile system model used in our work. Section 3 details the proposed new cost based replacement policy PPRRP. Section 4 and section 5 deal with simulation model, and performance evaluation and comparison simultaneously. Section 6 concludes the paper. 2. Mobile System Model We assume a cellular mobile network that is similar to the model discussed by D. Barbara [1] as mobile computing infrastructure. A mobile system [1][4][5][6] is usually made up of a server, moving clients, and a wireless connection between them (see Figure 1). The geographical area is divided into small regions, called cells. Each cell has a Base Station (BS) or Mobile Support Station (MSS) augmented with wireless interfaces  A PREDICTED REGION BASED CACHE REPLACEMENT POLICY FOR LOCATION 81 DEPENDENT DATAIN MOBILE ENVIRONMENT Copyright © 2008 SciRes. I. J. Communications, Network and System Sciences. 2008; 1:1-103 and a number of Mobile Clients (MCs). Inter-cell and intra-cell communications are managed by the MSSs. The MCs communicate with the MSS by wireless links within its radio coverage area. An MC can move freely from one location to another within a cell or between cells while retaining its network connection. An MC can either connect to a MSS through a wireless communication channel or disconnect from the MSS by operating in the doze (power save) mode. The MC queries the database servers that are connected to a wired network. The wireless channel is logically separated into two sub channels: uplink channel and downlink channel. The uplink channel is used by MCs to submit queries to the server via an MSS, while the downlink channel is used by MSSs to disseminate information or to forward the answers from the server to the target client. The mobile computing platform can be effectively described under the client/server paradigm [19]. A data item is the basic unit for update and query. MCs only issue simple requests to read the most recent copy of a data item. There may be one or more processes running on an MC. These processes are referred to as clients (we use the terms MC and client/users interchangeably). In order to serve a request from a client, the MSS needs to communicate with the database server to retrieve the data items. Since the communication between the MSS and the database server is through wired links and is transparent to the clients (i.e., from the client’s point of view, the MSS is the same as the database server), we also use the terms MSS and server interchangeably. Fixed/wireline Network ( Internet,LAN: Mbps to Gbps ) Cellular Data ( CDPD,DataTae: 19.2 kbps ) Wireless LAN ( Aironet,Wavelan: 2.12 Mbps ) Mobile GSM ( 9.6 kbps ) Base Node Base Node Base Node Figure 1. Mobile computing system model The information system provides location dependent services to mobile clients. The geographical area covered by the information system is referred as the service area. In this paper, we assume a geometric location model, i.e., a location is specified as a two-dimensional coordinate. However, it can be easily extended to 3-dimension space by including the third dimension. Mobile clients can identify their locations using systems such as the Global Positioning System (GPS) [3]. The data item value is different from data item, i.e., data item value for a data item is an instance of the item valid for a certain geographical region. Moreover, the data item value is different from data item. Data item value for a data item is an instance of the item valid for a certain geographical region. So, a data item can show different values when clients at different locations query it. For example, “restaurant” is a data item, and the data values for this data item vary depending on the location of query i.e. point at which the query “ Tell me the nearest restaurant” was issued by a mobile client. The valid scope of a data item value is defined as the region within which the data item value is valid. In a two-dimensional space, a valid scope (vs) can be represented by a geometric polygon p (e1, …,en ), where e i 's are endpoints of the polygon. A mobile client can cache data on its local disk or in any storage system that survives power-off. In this paper, data values are assumed to be of fixed size and read–only so that we can omit the influence of data sizes and updates on cache performance and concentrate on the impact caused by the unique properties of location-dependent data. y-axis O x-axis (a) Abstract model 1 θ 2 θ 4 θ 3 θ MI 1 = t seconds O 1 v 2 v 3 v 4 v y-axis x-axis MI 2 = t seconds MI 3 = t seconds MI 4 = t seconds (b) Discrete model Figure 2. Client’s movement path We also assume an unconstrained network, where mobile clients move freely inside the geographical region covered by the mobile network (without any restrictions).In the abstract model, the path of a moving client is represented by a curve in 2-dimension (x-y plane), as shown in Figure 2(a). Though abstract model is  82 A. KUMAR ET AL. Copyright © 2008 SciRes. I. J. Communications, Network and System Sciences. 2008; 1:1-103 simple, from computer implementation point of view, discrete model is preferred [8]. In discrete model, the path traveled is modeled as a sequence of line segments, each associated with fixed velocity and direction, as shown in Figure 2 (b). Length of the line segment depends on the rate of change of direction and velocity. For random movement this duration between change in direction and velocity is small and for regular movement and highway users this duration is large. This duration is known as Moving Interval (MI) [5][7][17]. Figure 2(b) shows the discrete movement of a mobile user with MI of t seconds. The distance between any two locations or points is the length of a straight line connecting the two points (i.e. Euclidean distance). 3. Prioritized Predicted Region Based Cache Replacement Policy (PPRRP) 3.1. Motivation LDIS, being spatial in nature needs that the distance of data item from client’s current position and its valid scope area should also be taken into account for cache replacement. Greater the distance of valid scope of data from the user’s current position lower is the chance that client will enter in the valid scope area of the data in near future. Thus, it is better to eject the farthest data value when replacement takes place. Moreover, because the client is mobile, its position at the time of next query will be different from its current position. Therefore the client’s movement should also be taken into account. Locations in the opposite direction of client’s movement have very low chance of being revisited, though they may be very close to it. Based on this reasoning, existing cache replacement schemes like FAR and PAID (directional) assign higher priorities to data items in the client’s direction of movement giving very low priority to the items in the opposite direction of user’s movement. However, with random movement patterns of clients, it is not always necessary that client will continue moving in the same direction. Therefore, evicting data values which are in the opposite direction of client’s movement but are very close to client’s current position may degrade the overall performance. 3.2. Basic Idea When client movement pattern is random, retaining the data items in the direction of user movement and discarding the data items that are in the opposite direction of user movement may not improve the performance. Therefore, our cache replacement policy considers the predicted region of user presence in near future (rather than considering the direction of user movement only) while selecting an item for replacement. The predicted region is based on the client’s current movement pattern. We show that it is useful to calculate the data distance with respect to this region so that the data items in the vicinity of client’s current position are not purged from cache. Valid scope area of the data item and the amount of space required to store the data item in cache are also used to select an item for replacement. This is because the client has higher chance of being in large region rather than small regions and keeping smaller size data items in cache helps to accommodate a large number of data items in the cache. Hence, our cache replacement policy selects a victim with low access probability, small valid scope area falling outside the predicted region and large data size. 3.3. Approach We make use of discrete model for client’s movement path as described in Section 3.2 and used in [5][7][14]. Assuming a predefined path of mobile user or a predefined destination is generally not possible unless we are dealing with a case where the user is moving in a train or a ship and the entire path of the user is known well in advance. For discrete model, the direction and velocity of the user are known for current MI. At the end of each MI, direction is selected randomly between 0° to 360° degrees and the velocity between minimum (vmin) and maximum speed (vmax) of the client. This motivates us in predicting a region instead of predicting the path. MIc L (,) s s x y(,) ee x y Figure 3. Current moving interval MIc L (,) ss xy (,) ee xy Figure 4. Predicted region Let vc be the velocity in current moving interval MIc, LMIc be the length of MIc along direction θc and (xs, ys) and (xe, ye) be the starting and end point of MIc respectively (see Figure 3). Assuming that the velocity vc remains same (generally the mobile user does not changes its velocity significantly over a long period) in the next MI also, we can predict the region of user presence in near future by the circle with radius LMIc and centre (xe, ye) as shown in Figure 4. Our cache replacement policy uses 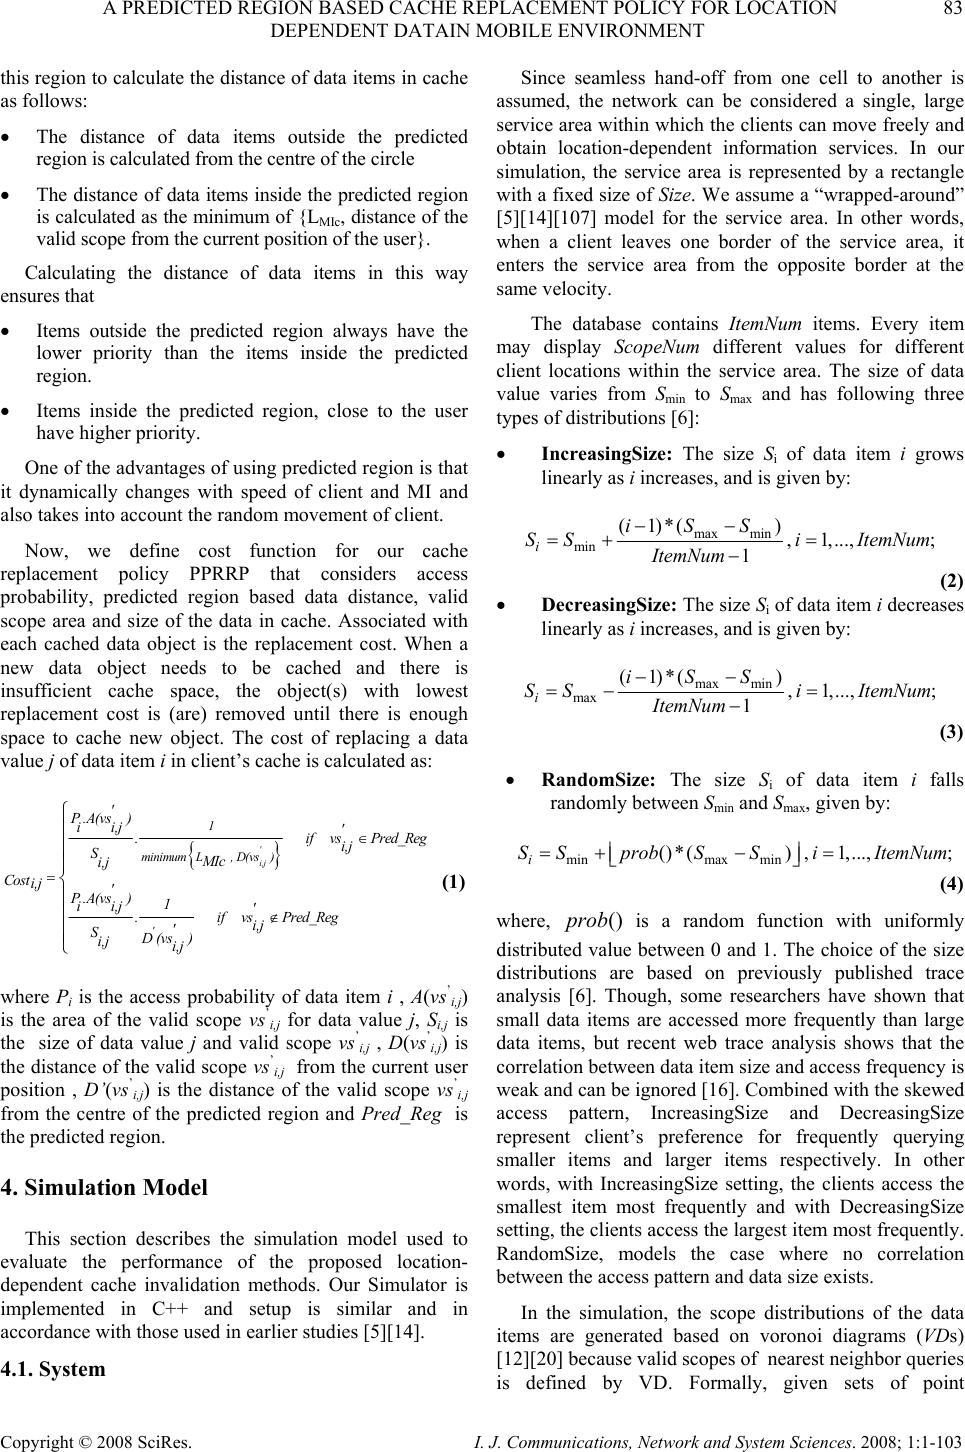 A PREDICTED REGION BASED CACHE REPLACEMENT POLICY FOR LOCATION 83 DEPENDENT DATAIN MOBILE ENVIRONMENT Copyright © 2008 SciRes. I. J. Communications, Network and System Sciences. 2008; 1:1-103 this region to calculate the distance of data items in cache as follows: • The distance of data items outside the predicted region is calculated from the centre of the circle • The distance of data items inside the predicted region is calculated as the minimum of {LMIc, distance of the valid scope from the current position of the user}. Calculating the distance of data items in this way ensures that • Items outside the predicted region always have the lower priority than the items inside the predicted region. • Items inside the predicted region, close to the user have higher priority. One of the advantages of using predicted region is that it dynamically changes with speed of client and MI and also takes into account the random movement of client. Now, we define cost function for our cache replacement policy PPRRP that considers access probability, predicted region based data distance, valid scope area and size of the data in cache. Associated with each cached data object is the replacement cost. When a new data object needs to be cached and there is insufficient cache space, the object(s) with lowest replacement cost is (are) removed until there is enough space to cache new object. The cost of replacing a data value j of data item i in client’s cache is calculated as: {} ' i,j ' 1 minimumL , D(vs) ' P.A(vs ) ii,j ' .ifvsPred_Reg i,j SMIc i,j Cos ti,j ' P.A(vs )1 ii,j ' .ifvsPred_Reg i,j ' SD(vs ) i,j i,j ∈ = ∉ ⎧ ⎪ ⎪ ⎪ ⎨ ⎪ ⎪ ⎪ ⎩ (1) where Pi is the access probability of data item i , A(vs’ i,j) is the area of the valid scope vs’ i,j for data value j, Si,j is the size of data value j and valid scope vs’ i,j , D(vs’ i,j) is the distance of the valid scope vs’ i,j from the current user position , D’(vs’ i,j) is the distance of the valid scope vs’ i,j from the centre of the predicted region and Pred_Reg is the predicted region. 4. Simulation Model This section describes the simulation model used to evaluate the performance of the proposed location- dependent cache invalidation methods. Our Simulator is implemented in C++ and setup is similar and in accordance with those used in earlier studies [5][14]. 4.1. System Since seamless hand-off from one cell to another is assumed, the network can be considered a single, large service area within which the clients can move freely and obtain location-dependent information services. In our simulation, the service area is represented by a rectangle with a fixed size of Size. We assume a “wrapped-around” [5][14][107] model for the service area. In other words, when a client leaves one border of the service area, it enters the service area from the opposite border at the same velocity. The database contains ItemNum items. Every item may display ScopeNum different values for different client locations within the service area. The size of data value varies from Smin to Smax and has following three types of distributions [6]: • IncreasingSize: The size S i of data item i grows linearly as i increases, and is given by: max min min (1)*( ) , 1,...,; 1 i iSS SSi ItemNum ItemNum −− =+ = − (2) • DecreasingSize: The size Si of data item i decreases linearly as i increases, and is given by: max min max (1)*( ) , 1,...,; 1 i iSS SSi ItemNum ItemNum −− =− = − (3) • RandomSize: The size S i of data item i falls randomly between Smin and Smax, given by: minmax min ()*() ,1,...,; i S SprobSSiItemNum=+− = ⎢⎥ ⎣⎦ (4) where, () p rob is a random function with uniformly distributed value between 0 and 1. The choice of the size distributions are based on previously published trace analysis [6]. Though, some researchers have shown that small data items are accessed more frequently than large data items, but recent web trace analysis shows that the correlation between data item size and access frequency is weak and can be ignored [16]. Combined with the skewed access pattern, IncreasingSize and DecreasingSize represent client’s preference for frequently querying smaller items and larger items respectively. In other words, with IncreasingSize setting, the clients access the smallest item most frequently and with DecreasingSize setting, the clients access the largest item most frequently. RandomSize, models the case where no correlation between the access pattern and data size exists. In the simulation, the scope distributions of the data items are generated based on voronoi diagrams (VDs) [12][20] because valid scopes of nearest neighbor queries is defined by VD. Formally, given sets of point 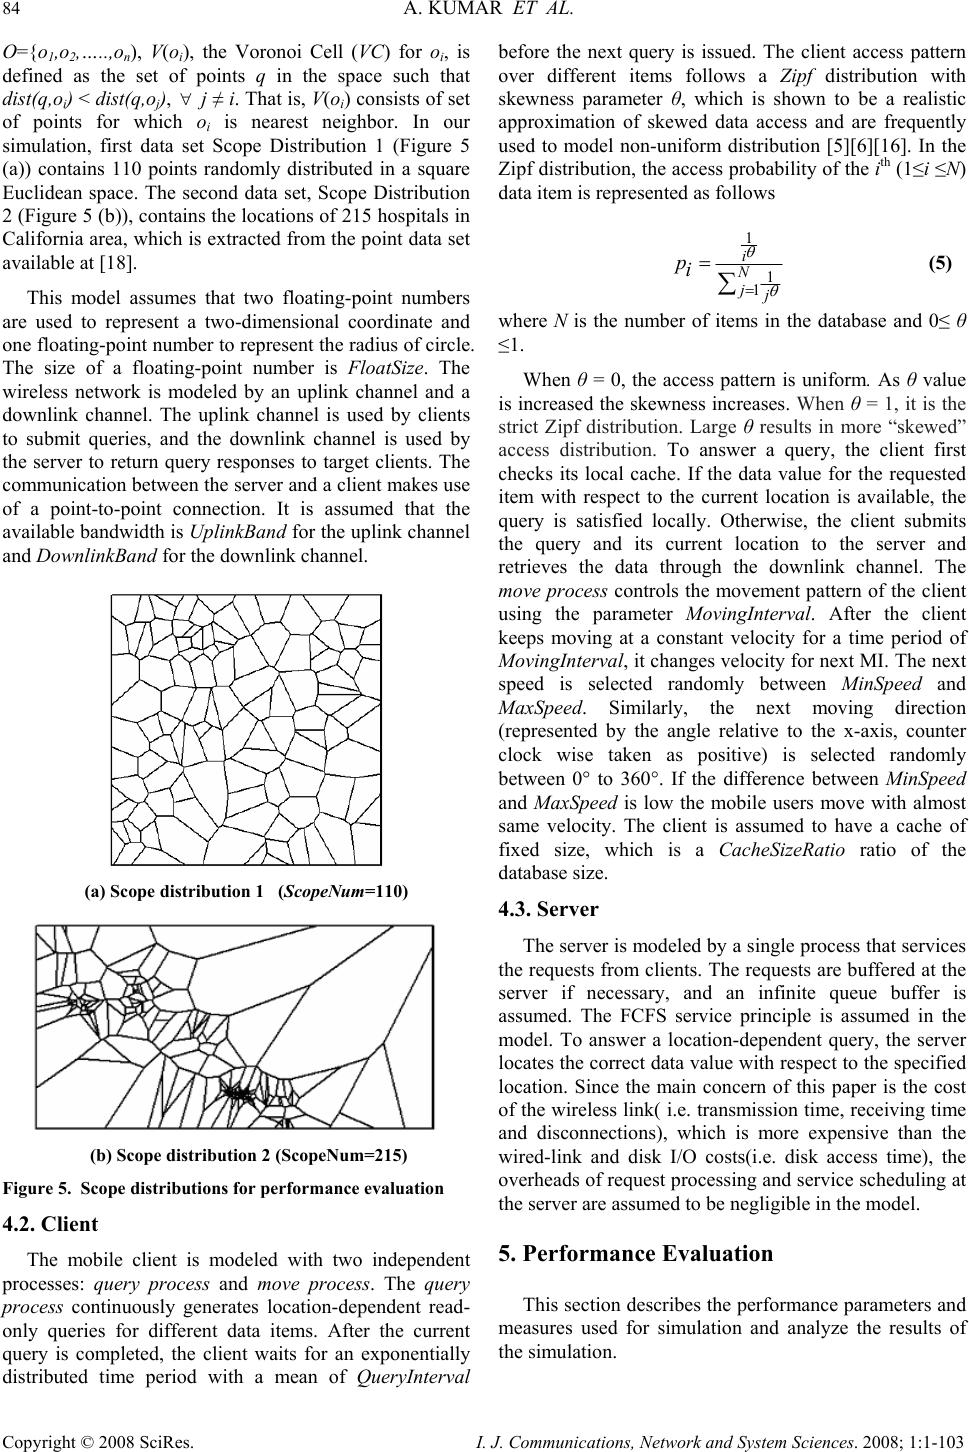 84 A. KUMAR ET AL. Copyright © 2008 SciRes. I. J. Communications, Network and System Sciences. 2008; 1:1-103 O={o1,o2,…..,on), V(oi), the Voronoi Cell (VC) for oi, is defined as the set of points q in the space such that dist(q,oi) < dist(q,oj), ∀ j ≠ i. That is, V(oi) consists of set of points for which oi is nearest neighbor. In our simulation, first data set Scope Distribution 1 (Figure 5 (a)) contains 110 points randomly distributed in a square Euclidean space. The second data set, Scope Distribution 2 (Figure 5 (b)), contains the locations of 215 hospitals in California area, which is extracted from the point data set available at [18]. This model assumes that two floating-point numbers are used to represent a two-dimensional coordinate and one floating-point number to represent the radius of circle. The size of a floating-point number is FloatSize. The wireless network is modeled by an uplink channel and a downlink channel. The uplink channel is used by clients to submit queries, and the downlink channel is used by the server to return query responses to target clients. The communication between the server and a client makes use of a point-to-point connection. It is assumed that the available bandwidth is UplinkBa nd for the uplink channel and DownlinkBand for the downlink channel. (a) Scope distribution 1 (ScopeNum=110) (b) Scope distribution 2 (ScopeNum=215) Figure 5. Scope distributions for performance evaluation 4.2. Client The mobile client is modeled with two independent processes: query process and move process. The query process continuously generates location-dependent read- only queries for different data items. After the current query is completed, the client waits for an exponentially distributed time period with a mean of QueryInterval before the next query is issued. The client access pattern over different items follows a Zipf distribution with skewness parameter θ, which is shown to be a realistic approximation of skewed data access and are frequently used to model non-uniform distribution [5][6][16]. In the Zipf distribution, the access probability of the ith (1≤i ≤N) data item is represented as follows 1 1 1 i N jj pi θ θ = =∑ (5) where N is the number of items in the database and 0≤ θ ≤1. When θ = 0, the access pattern is uniform. As θ value is increased the skewness increases. When θ = 1, it is the strict Zipf distribution. Large θ results in more “skewed” access distribution. To answer a query, the client first checks its local cache. If the data value for the requested item with respect to the current location is available, the query is satisfied locally. Otherwise, the client submits the query and its current location to the server and retrieves the data through the downlink channel. The move process controls the movement pattern of the client using the parameter MovingInterval. After the client keeps moving at a constant velocity for a time period of MovingInterval, it changes velocity for next MI. The next speed is selected randomly between MinSpeed and MaxSpeed. Similarly, the next moving direction (represented by the angle relative to the x-axis, counter clock wise taken as positive) is selected randomly between 0° to 360°. If the difference between MinSpeed and MaxSpeed is low the mobile users move with almost same velocity. The client is assumed to have a cache of fixed size, which is a CacheSizeRatio ratio of the database size. 4.3. Server The server is modeled by a single process that services the requests from clients. The requests are buffered at the server if necessary, and an infinite queue buffer is assumed. The FCFS service principle is assumed in the model. To answer a location-dependent query, the server locates the correct data value with respect to the specified location. Since the main concern of this paper is the cost of the wireless link( i.e. transmission time, receiving time and disconnections), which is more expensive than the wired-link and disk I/O costs(i.e. disk access time), the overheads of request processing and service scheduling at the server are assumed to be negligible in the model. 5. Performance Evaluation This section describes the performance parameters and measures used for simulation and analyze the results of the simulation. 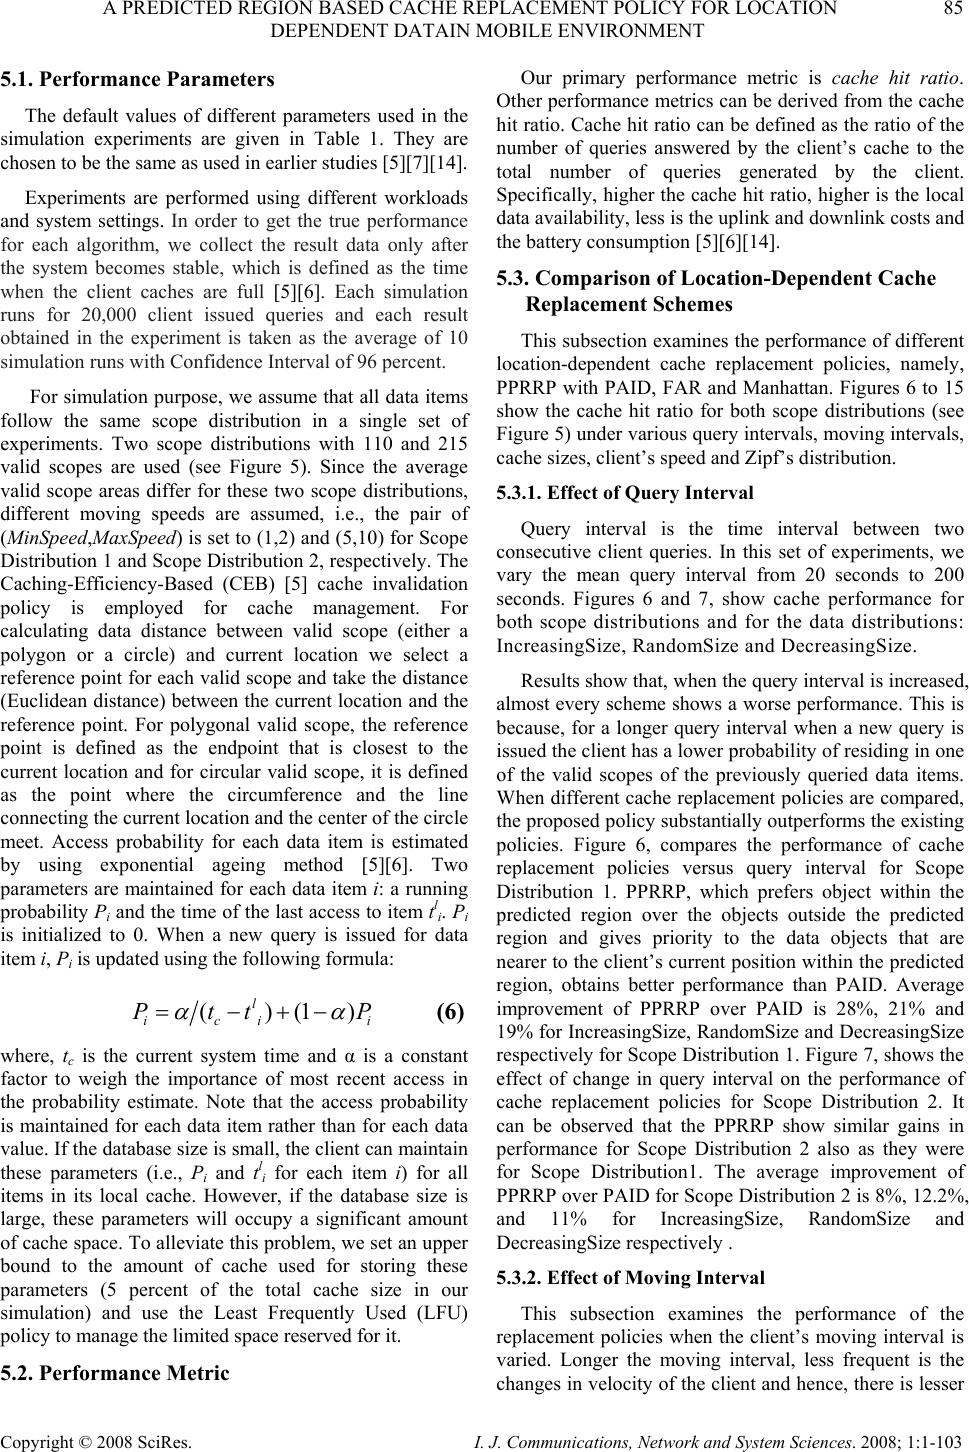 A PREDICTED REGION BASED CACHE REPLACEMENT POLICY FOR LOCATION 85 DEPENDENT DATAIN MOBILE ENVIRONMENT Copyright © 2008 SciRes. I. J. Communications, Network and System Sciences. 2008; 1:1-103 5.1. Performance Parameters The default values of different parameters used in the simulation experiments are given in Table 1. They are chosen to be the same as used in earlier studies [5][7][14]. Experiments are performed using different workloads and system settings. In order to get the true performance for each algorithm, we collect the result data only after the system becomes stable, which is defined as the time when the client caches are full [5][6]. Each simulation runs for 20,000 client issued queries and each result obtained in the experiment is taken as the average of 10 simulation runs with Confidence Interval of 96 percent. For simulation purpose, we assume that all data items follow the same scope distribution in a single set of experiments. Two scope distributions with 110 and 215 valid scopes are used (see Figure 5). Since the average valid scope areas differ for these two scope distributions, different moving speeds are assumed, i.e., the pair of (MinSpeed,MaxSpeed) is set to (1,2) and (5,10) for Scope Distribution 1 and Scope Distribution 2, respectively. The Caching-Efficiency-Based (CEB) [5] cache invalidation policy is employed for cache management. For calculating data distance between valid scope (either a polygon or a circle) and current location we select a reference point for each valid scope and take the distance (Euclidean distance) between the current location and the reference point. For polygonal valid scope, the reference point is defined as the endpoint that is closest to the current location and for circular valid scope, it is defined as the point where the circumference and the line connecting the current location and the center of the circle meet. Access probability for each data item is estimated by using exponential ageing method [5][6]. Two parameters are maintained for each data item i: a running probability Pi and the time of the last access to item tl i. Pi is initialized to 0. When a new query is issued for data item i, Pi is updated using the following formula: ()(1) l ici i Ptt P α α =−+− (6) where, t c is the current system time and α is a constant factor to weigh the importance of most recent access in the probability estimate. Note that the access probability is maintained for each data item rather than for each data value. If the database size is small, the client can maintain these parameters (i.e., Pi and tl i for each item i) for all items in its local cache. However, if the database size is large, these parameters will occupy a significant amount of cache space. To alleviate this problem, we set an upper bound to the amount of cache used for storing these parameters (5 percent of the total cache size in our simulation) and use the Least Frequently Used (LFU) policy to manage the limited space reserved for it. 5.2. Performance Metric Our primary performance metric is cache hit ratio. Other performance metrics can be derived from the cache hit ratio. Cache hit ratio can be defined as the ratio of the number of queries answered by the client’s cache to the total number of queries generated by the client. Specifically, higher the cache hit ratio, higher is the local data availability, less is the uplink and downlink costs and the battery consumption [5][6][14]. 5.3. Comparison of Location-Dependent Cache Replacement Schemes This subsection examines the performance of different location-dependent cache replacement policies, namely, PPRRP with PAID, FAR and Manhattan. Figures 6 to 15 show the cache hit ratio for both scope distributions (see Figure 5) under various query intervals, moving intervals, cache sizes, client’s speed and Zipf’s distribution. 5.3.1. Effect of Query Interval Query interval is the time interval between two consecutive client queries. In this set of experiments, we vary the mean query interval from 20 seconds to 200 seconds. Figures 6 and 7, show cache performance for both scope distributions and for the data distributions: IncreasingSize, RandomSize and DecreasingSize. Results show that, when the query interval is increased, almost every scheme shows a worse performance. This is because, for a longer query interval when a new query is issued the client has a lower probability of residing in one of the valid scopes of the previously queried data items. When different cache replacement policies are compared, the proposed policy substantially outperforms the existing policies. Figure 6, compares the performance of cache replacement policies versus query interval for Scope Distribution 1. PPRRP, which prefers object within the predicted region over the objects outside the predicted region and gives priority to the data objects that are nearer to the client’s current position within the predicted region, obtains better performance than PAID. Average improvement of PPRRP over PAID is 28%, 21% and 19% for IncreasingSize, RandomSize and DecreasingSize respectively for Scope Distribution 1. Figure 7, shows the effect of change in query interval on the performance of cache replacement policies for Scope Distribution 2. It can be observed that the PPRRP show similar gains in performance for Scope Distribution 2 also as they were for Scope Distribution1. The average improvement of PPRRP over PAID for Scope Distribution 2 is 8%, 12.2%, and 11% for IncreasingSize, RandomSize and DecreasingSize respectively . 5.3.2. Effect of Moving Interval This subsection examines the performance of the replacement policies when the client’s moving interval is varied. Longer the moving interval, less frequent is the changes in velocity of the client and hence, there is lesser 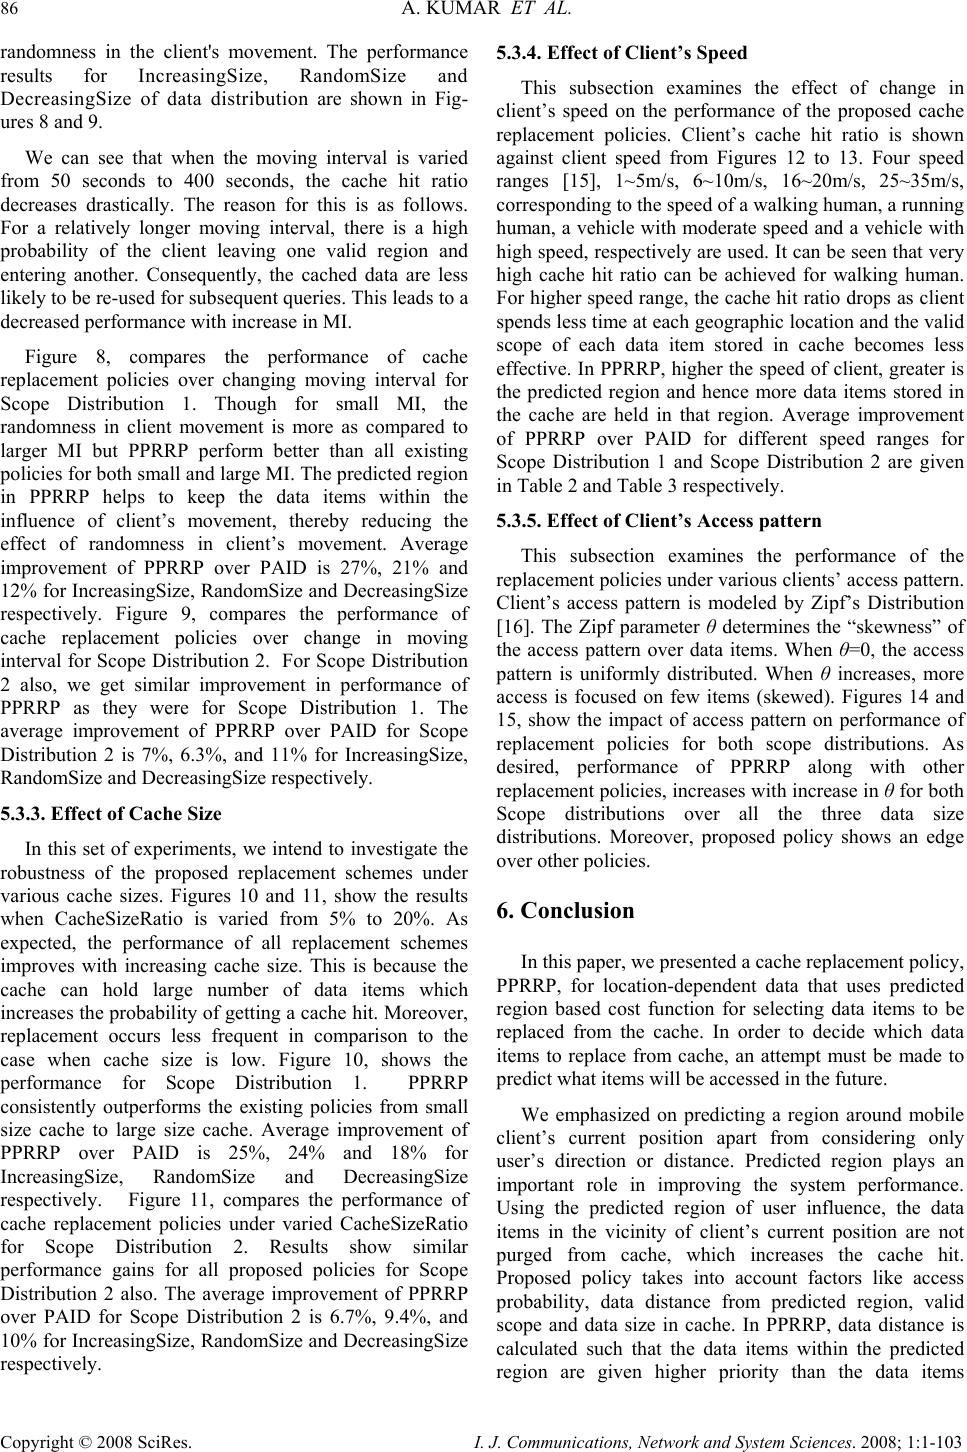 86 A. KUMAR ET AL. Copyright © 2008 SciRes. I. J. Communications, Network and System Sciences. 2008; 1:1-103 randomness in the client's movement. The performance results for IncreasingSize, RandomSize and DecreasingSize of data distribution are shown in Fig- ures 8 and 9. We can see that when the moving interval is varied from 50 seconds to 400 seconds, the cache hit ratio decreases drastically. The reason for this is as follows. For a relatively longer moving interval, there is a high probability of the client leaving one valid region and entering another. Consequently, the cached data are less likely to be re-used for subsequent queries. This leads to a decreased performance with increase in MI. Figure 8, compares the performance of cache replacement policies over changing moving interval for Scope Distribution 1. Though for small MI, the randomness in client movement is more as compared to larger MI but PPRRP perform better than all existing policies for both small and large MI. The predicted region in PPRRP helps to keep the data items within the influence of client’s movement, thereby reducing the effect of randomness in client’s movement. Average improvement of PPRRP over PAID is 27%, 21% and 12% for IncreasingSize, RandomSize and DecreasingSize respectively. Figure 9, compares the performance of cache replacement policies over change in moving interval for Scope Distribution 2. For Scope Distribution 2 also, we get similar improvement in performance of PPRRP as they were for Scope Distribution 1. The average improvement of PPRRP over PAID for Scope Distribution 2 is 7%, 6.3%, and 11% for IncreasingSize, RandomSize and DecreasingSize respectively. 5.3.3. Effect of Cache Size In this set of experiments, we intend to investigate the robustness of the proposed replacement schemes under various cache sizes. Figures 10 and 11, show the results when CacheSizeRatio is varied from 5% to 20%. As expected, the performance of all replacement schemes improves with increasing cache size. This is because the cache can hold large number of data items which increases the probability of getting a cache hit. Moreover, replacement occurs less frequent in comparison to the case when cache size is low. Figure 10, shows the performance for Scope Distribution 1. PPRRP consistently outperforms the existing policies from small size cache to large size cache. Average improvement of PPRRP over PAID is 25%, 24% and 18% for IncreasingSize, RandomSize and DecreasingSize respectively. Figure 11, compares the performance of cache replacement policies under varied CacheSizeRatio for Scope Distribution 2. Results show similar performance gains for all proposed policies for Scope Distribution 2 also. The average improvement of PPRRP over PAID for Scope Distribution 2 is 6.7%, 9.4%, and 10% for IncreasingSize, RandomSize and DecreasingSize respectively. 5.3.4. Effect of Client’s Speed This subsection examines the effect of change in client’s speed on the performance of the proposed cache replacement policies. Client’s cache hit ratio is shown against client speed from Figures 12 to 13. Four speed ranges [15], 1~5m/s, 6~10m/s, 16~20m/s, 25~35m/s, corresponding to the speed of a walking human, a running human, a vehicle with moderate speed and a vehicle with high speed, respectively are used. It can be seen that very high cache hit ratio can be achieved for walking human. For higher speed range, the cache hit ratio drops as client spends less time at each geographic location and the valid scope of each data item stored in cache becomes less effective. In PPRRP, higher the speed of client, greater is the predicted region and hence more data items stored in the cache are held in that region. Average improvement of PPRRP over PAID for different speed ranges for Scope Distribution 1 and Scope Distribution 2 are given in Table 2 and Table 3 respectively. 5.3.5. Effect of Client’s Access pattern This subsection examines the performance of the replacement policies under various clients’ access pattern. Client’s access pattern is modeled by Zipf’s Distribution [16]. The Zipf parameter θ determines the “skewness” of the access pattern over data items. When θ=0, the access pattern is uniformly distributed. When θ increases, more access is focused on few items (skewed). Figures 14 and 15, show the impact of access pattern on performance of replacement policies for both scope distributions. As desired, performance of PPRRP along with other replacement policies, increases with increase in θ for both Scope distributions over all the three data size distributions. Moreover, proposed policy shows an edge over other policies. 6. Conclusion In this paper, we presented a cache replacement policy, PPRRP, for location-dependent data that uses predicted region based cost function for selecting data items to be replaced from the cache. In order to decide which data items to replace from cache, an attempt must be made to predict what items will be accessed in the future. We emphasized on predicting a region around mobile client’s current position apart from considering only user’s direction or distance. Predicted region plays an important role in improving the system performance. Using the predicted region of user influence, the data items in the vicinity of client’s current position are not purged from cache, which increases the cache hit. Proposed policy takes into account factors like access probability, data distance from predicted region, valid scope and data size in cache. In PPRRP, data distance is calculated such that the data items within the predicted region are given higher priority than the data items  A PREDICTED REGION BASED CACHE REPLACEMENT POLICY FOR LOCATION 87 DEPENDENT DATAIN MOBILE ENVIRONMENT Copyright © 2008 SciRes. I. J. Communications, Network and System Sciences. 2008; 1:1-103 outside the predicted region. In addition to giving highest priority to the data items within the predicted region, data items nearer to the client’s current position are also favored over other data items in the same predicted region. A number of simulation experiments have been conducted to evaluate the performance of the PPRRP. The results show that PPRRP, with different system settings, give better performance (improves cache hit ratio) than PAID. PPRRP achieves an average improvement of more than 25% for Increasing Size, more than 20 % for Random Size and more than 15 % for DecreasingSize as compared to existing replacement policy PAID. We compared all policies under various system parameters and for two scope distributions. But in real- world, there can be lots of scope distributions varying from regions to countries. Moreover, we used Euclidean distance to calculate the distance between two points. However, in the real-world, this distance cannot represent the real distance that a user has to cover in order to reach to an object. For example, in City model the distance between two points is calculated using Manhattan distance. Hence, there is a need to explore proposed policies under different real-world conditions. Also, LDIS have been referred to as some of the most promising technological inventions that may impact consumer behavior over the next decade. User’s expectations from mobile networks are becoming more demanding and this trend is expected to intensify in the future. Hence, the user need/profile is essential to develop better cache replacement policies. Also, existing location dependent cache management schemes consider only location- dependent data. Investigation of location dependent cache management schemes, which includes temporal dependent update frequencies, is also required. Future schemes for cache management should consider the above facts to over come the challenges posed by LDIS. 7. References [1] D. Barbara, “Mobile Computing and Databases: A Survey,” IEEE Transactions on Knowledge and Data Engineering, Vol. 11, No. 1, pp. 108-117, January/February 1999. [2] D. Barbara and T. Imielinski, “Sleepers and Workaholics: Caching Strategies in Mobile Environments,” In the Proceedings of the ACM SIGMOD Conference on Management of Data, Minneapolis, USA, pp. 1-12, 1994. [3] I. A. Getting, “The Global Positioning System,” IEEE Spectrum, Vol. 30, No. 12, pp. 36-47, December 1993. [4] D. L. Lee, W.-C. Lee, J. Xu and B. Zheng, “Data Management in Location-Dependent Information Services,” IEEE Pervasive Computing, Vol. 1, No. 3, pp. 65-72, July 2002. [5] B. Zheng, J. Xu and D. L. Lee, “Cache Invalidation and Replacement Strategies for Location-Dependent Data in Mobile Environments,” IEEE Transactions on Computers, Vol. 51, No. 10, pp. 1141-1153, October 2002. [6] L. Yin, G. Cao and Y. Cai, “A Generalized Target- Driven Cache Replacement Policy for Mobile Environments,” In the Proceedings of the IEEE Symposium on Applications on the Internet, pp. 14- 21, January 2003. [7] K. Lai, Z. Tari and P. Bertok, “Location–Aware Cache Replacement for Mobile Environments,” IEEE Global Telecommunication Conference (GLOBECOM 04), Vol. 6, pp. 3441-3447, 29th November- 3rd December 2004. [8] M. Erwig, R. H. Guting, M. Schneider and M. Vazirgiannis, “Spatio-Temporal Data Types: An Approach to Modeling and Querying Moving Objects in Databases,” GeoInformatica, Vol. 3, No. 3, pp. 269-296, 1999. [9] Q. Ren and M. H. Dhunham, “Using Semantic Caching to Manage Location Dependent Data in Mobile Computing,” In the Proceedings of 6th ACM/IEEE Mobile Computing and Networking (MobiCom), Boston, USA, pp. 210-221, 2000. [10] S. Dar, M. J. Franklin, B. T. Jonsson, D. Srivastava and M. Tan, “Semantic Data Caching and Replacement,” In the Proceedings of the 22nd International Conference on Very Large Databases(VLDB), pp. 330-341,1996. [11] A. Balamash and M. Krunz, “An Overview of Web Caching Replacement Algorithms,” IEEE Communications Surveys & Tutorials, Vol. 6, No. 2, pp. 44-56, 2004. [12] J. O’ Rourke, Computational Geometry in C, chapter 5, Univ. of Cambridge Press, 1998. [13] E. O’Neil and P. O’Neil, “The LRU-k page replacement algorithm for database disk buffering”, In the Proceedings of the ACM SIGMOD, Vol. 22, No. 2, pp. 296-306, 1993. [14] Il-dong Jung, Young-ho You, Jong-hwan Lee and Kyungsok Kim, “Broadcasting and caching policies for location-dependent queries in urban areas,” In the Proceedings of the 2nd International Workshop on Mobile Commerce, Atlanta, USA, pp. 54-60, September 2002. [15] C. Lu, G. Xing, O. Chipara and C. L. Fok, “MobiQuery: A Spatio Temporal Data Service for Sensor Networks,” In the Proceedings of the 2nd  88 A. KUMAR ET AL. Copyright © 2008 SciRes. I. J. Communications, Network and System Sciences. 2008; 1:1-103 International Conference on Embedded Networked Sensor System (ACM SenSys’04), Baltimore, USA, pp. 320-334, 2004. [16] L. Breslau, P. Cao, L. Fan, G. Phillips and S. Shenker, “Web Caching and Zipf-like Distributions: Evidence and Implications,” In the Proceedings of the 18th Annual Joint Conference of the IEEE Computer and Communications Societies (INFOCOM’99), New York, USA, Vol. 1, pp. 126-134, March 1999. [17] T. Camp, J. Boleng and V. Davies, “A Survey of Mobility Model for Ad Hoc Network Research,” Wireless Communication & Mobile Computing (WCMC): Special Issue on Mobile AdHoc Networking: Research, Trends and Applications, Vol. 2, No. 5, pp. 483-502, 2002. [18] Spatial Datasets. Website at http://www.rtreeportal.org, 2005. [19] J. Jing, A. Helal and A. Elmagarmid, “Client-Server Computing in Mobile Environments,” In the Proceedings of the ACM Computing Surveys, Vol. 31, No. 2, pp. 117-157, June 1999. [20] M. Berg, M. Kreveld M. Overmars and O. Schwarzkopf, “Computational Geometry: Algorithms and Applications,” chapter 7, New York, NY, USA, Springer-Verlag, 1996. 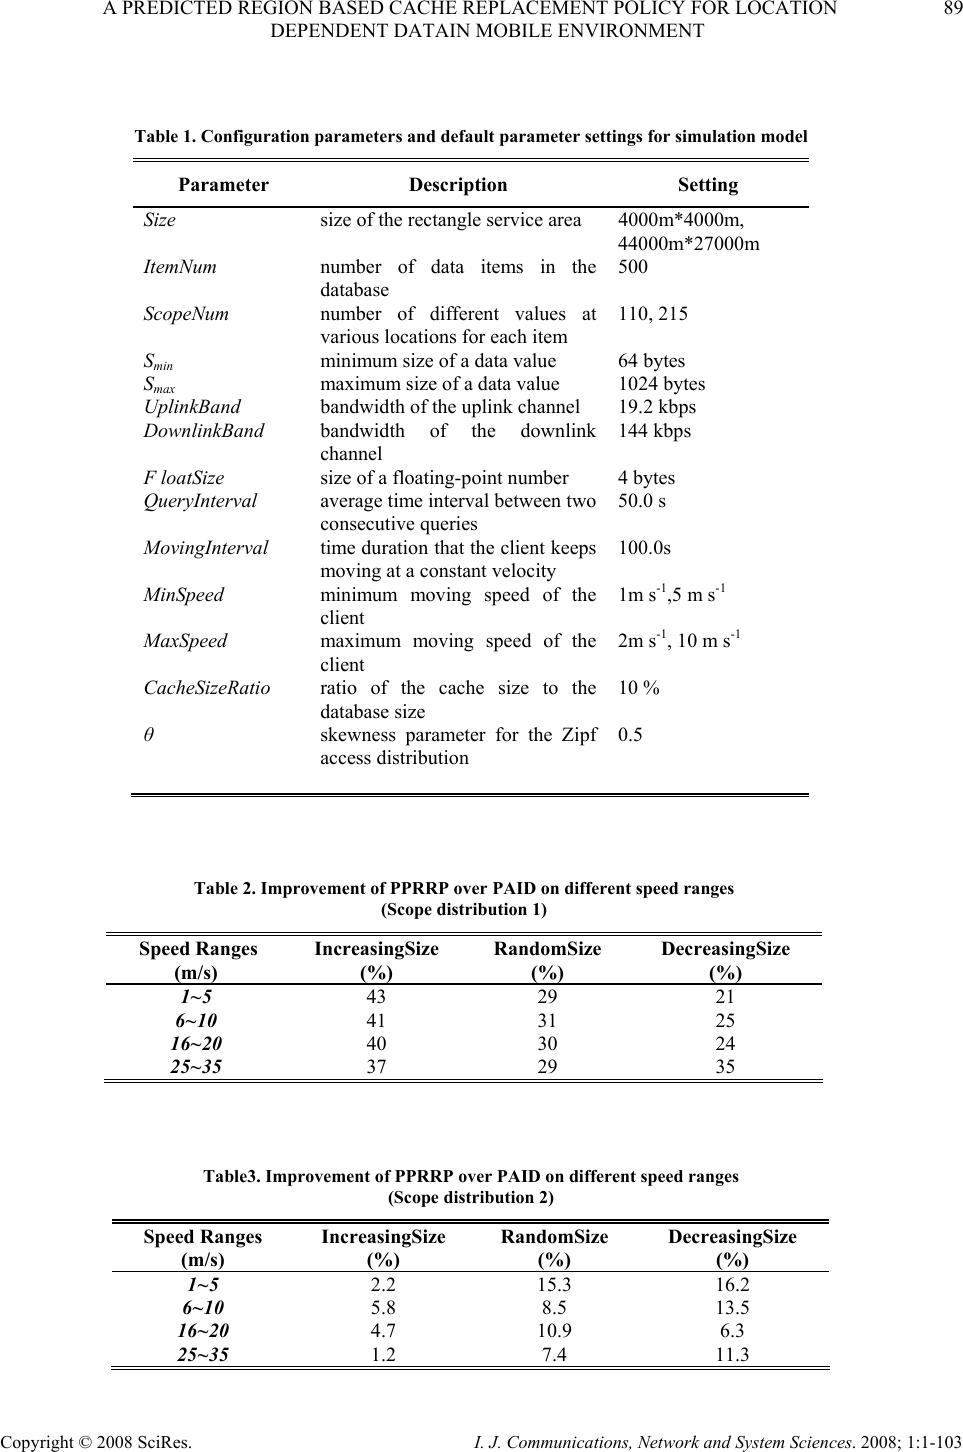 A PREDICTED REGION BASED CACHE REPLACEMENT POLICY FOR LOCATION 89 DEPENDENT DATAIN MOBILE ENVIRONMENT Copyright © 2008 SciRes. I. J. Communications, Network and System Sciences. 2008; 1:1-103 Table 2. Improvement of PPRRP over PAID on different speed ranges (Scope distribution 1) Speed Ranges (m/s) IncreasingSize (%) RandomSize (%) DecreasingSize (%) 1~5 43 29 21 6~10 41 31 25 16~20 40 30 24 25~35 37 29 35 Table 1. Configuration parameters and de fa ult parameter settings for simulation model Parameter Description Setting Size size of the rectangle service area 4000m*4000m, 44000m*27000m ItemNum number of data items in the database 500 ScopeNum number of different values at various locations for each item 110, 215 Smin minimum size of a data value 64 bytes Smax maximum size of a data value 1024 bytes UplinkBand bandwidth of the uplink channel 19.2 kbps DownlinkBand bandwidth of the downlink channel 144 kbps F loatSize size of a floating-point number 4 bytes QueryInterval average time interval between two consecutive queries 50.0 s MovingInterval time duration that the client keeps moving at a constant velocity 100.0s MinSpeed minimum moving speed of the client 1m s-1,5 m s-1 MaxSpeed maximum moving speed of the client 2m s-1, 10 m s-1 CacheSizeRatio ratio of the cache size to the database size 10 % θ skewness parameter for the Zipf access distribution 0.5 Table3. Improvement of PPRRP over PAID on different speed ranges (Scope distribution 2) Speed Ranges (m/s) IncreasingSize (%) RandomSize (%) DecreasingSize (%) 1~5 2.2 15.3 16.2 6~10 5.8 8.5 13.5 16~20 4.7 10.9 6.3 25~35 1.2 7.4 11.3 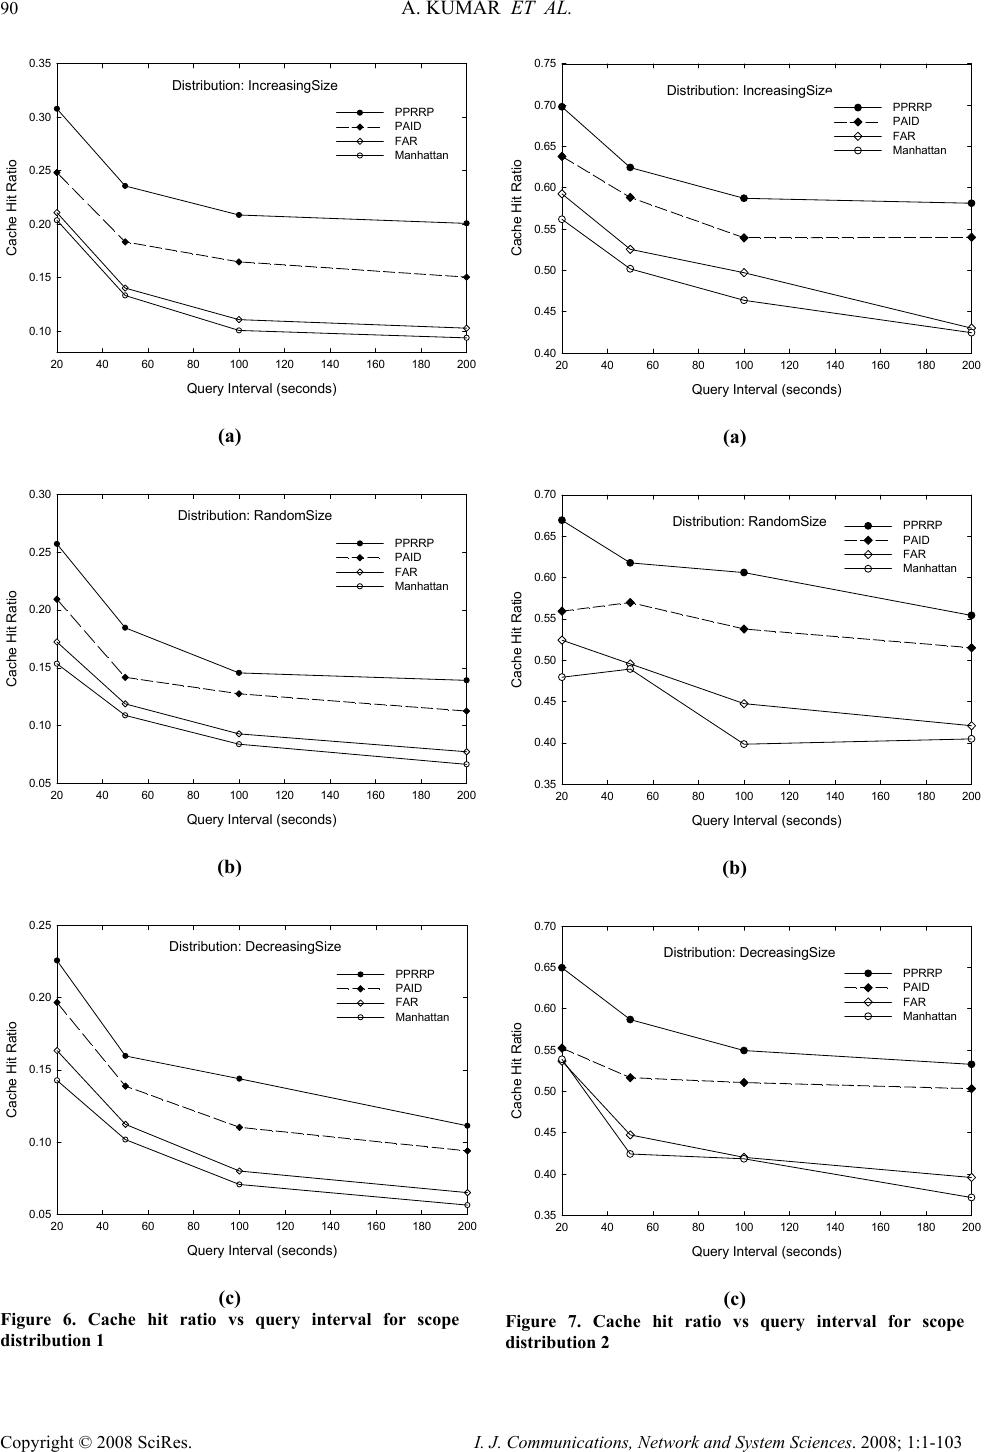 90 A. KUMAR ET AL. Copyright © 2008 SciRes. I. J. Communications, Network and System Sciences. 2008; 1:1-103 Distribution: IncreasingSize Query Interval (seconds) 20406080100 120 140 160180 200 Cache Hit Ratio 0.10 0.15 0.20 0.25 0.30 0.35 PPRRP PAID FAR Manhattan (a) Distribution: RandomSize Query Interval (seconds) 20406080100 120 140 160180 200 Cache Hit Ratio 0.05 0.10 0.15 0.20 0.25 0.30 PPRRP PAID FAR Manhattan (b) Distribution: DecreasingSize Query Interval (seconds) 20406080100 120 140 160 180200 Cache Hit Ratio 0.05 0.10 0.15 0.20 0.25 PPRRP PAID FAR Manhattan (c) Figure 6. Cache hit ratio vs query interval for scope distribution 1 Distribution: IncreasingSize Query Interval (seconds) 20406080100120 140160 180 200 Cache Hit Ratio 0.40 0.45 0.50 0.55 0.60 0.65 0.70 0.75 PPRRP PAID FAR Manhatt a n (a) Distribution: RandomSize Query Interval (seconds) 20406080100120 140160 180 200 Cache Hit Ratio 0.35 0.40 0.45 0.50 0.55 0.60 0.65 0.70 PPRRP PAID FAR Manhattan (b) Distribution: DecreasingSize Query Interval (seconds) 20406080100120 140160 180200 Cache Hit Ra tio 0.35 0.40 0.45 0.50 0.55 0.60 0.65 0.70 PPRRP PAID FAR Manhattan (c) Figure 7. Cache hit ratio vs query interval for scope distribution 2  A PREDICTED REGION BASED CACHE REPLACEMENT POLICY FOR LOCATION 91 DEPENDENT DATAIN MOBILE ENVIRONMENT Copyright © 2008 SciRes. I. J. Communications, Network and System Sciences. 2008; 1:1-103 Distribution: IncreasingSize Moving Interval (seconds) 50 100200400 Cache Hit Ratio 0.10 0.15 0.20 0.25 0.30 PPRRP PAID FAR Manhattan (a) Distribution: RandomSize Moving Interval (seconds) 50 100200400 Cache Hit Ratio 0.05 0.10 0.15 0.20 0.25 PPRRP PAID FAR Manhattan (b) Distribution: DecreasingSize Moving Interval (seconds) 50 100200400 Cache Hit Ratio 0.05 0.10 0.15 0.20 0.25 PPRRP PAID FAR Manhattan (c) Figure 8. Cache hit ratio vs moving interval for scope distribution 1 Distribution: IncreasingSize Moving Interval (seconds) 50 100200400 Cache Hit Ratio 0.40 0.45 0.50 0.55 0.60 0.65 0.70 PPRRP PAID FAR Manhattan (a) Distribution: Random Si ze Moving Interval (seconds) 50 100200400 Cache Hit Ratio 0.35 0.40 0.45 0.50 0.55 0.60 0.65 0.70 PPRRP PAID FAR Manhattan (b) Distribution: DecreasingSize Moving Interval (seconds) 50 100200400 Cache Hit Ratio 0.30 0.35 0.40 0.45 0.50 0.55 0.60 0.65 PPRRP PAID FAR Manhattan (c) Figure 9. Cache hit ratio vs moving interval for scope distribution 2  92 A. KUMAR ET AL. Copyright © 2008 SciRes. I. J. Communications, Network and System Sciences. 2008; 1:1-103 Distribution: IncreasingSize Cache Size (% of Database Size) 5 101520 Cache Hit Ratio 0.05 0.10 0.15 0.20 0.25 0.30 0.35 PPRRP PAID FAR Manhattan (a) Distribution: RandomSize Cache Size (% of Database Size) 5 101520 Cache Hit Ratio 0.06 0.08 0.10 0.12 0.14 0.16 0.18 0.20 0.22 0.24 0.26 PPRRP PAID FAR Manhattan (b) Distribution: DecreasingSize Cache Size (% of Database Size) 5 101520 Cache Hit Ratio 0.06 0.08 0.10 0.12 0.14 0.16 0.18 0.20 0.22 0.24 PPRRP PAID FAR Manhattan (c) Figure 10. Cache hit ratio vs cache size for scope distribution 1 Distribution: IncreasingSize Cache Size (% of Database Size) 5 101520 Cache Hit Ratio 0.40 0.45 0.50 0.55 0.60 0.65 0.70 PPRRP PAID FAR Manhattan (a) Distribution: Random Si ze Cache Size (% of Database Size) 5 101520 Cache Hit Ratio 0.35 0.40 0.45 0.50 0.55 0.60 0.65 0.70 PPRRP PAID FAR Manhattan (b) Distribution: DecreasingSize Cache Size (% of Database Size) 5 101520 Cache Hit Ratio 0.30 0.35 0.40 0.45 0.50 0.55 0.60 0.65 0.70 PPRRP PAID FAR Manhattan (c) Figure 11. Cache hit ratio vs cache size for scope distribution 2  A PREDICTED REGION BASED CACHE REPLACEMENT POLICY FOR LOCATION 93 DEPENDENT DATAIN MOBILE ENVIRONMENT Copyright © 2008 SciRes. I. J. Communications, Network and System Sciences. 2008; 1:1-103 Distribution: IncreasingSize Client Speed (m/s) 1-56-1016-20 25-35 Cache Hit Ratio 0.00 0.05 0.10 0.15 0.20 0.25 PPRRP PAID FAR Manhattan (a) Distribution: RandomSize Client Speed (m/s) 1-56-1016-20 25-35 Cache Hit Ratio 0.00 0.02 0.04 0.06 0.08 0.10 0.12 0.14 0.16 PPRRP PAID FAR Manhattan (b) Distribution: DecreasingSize Client Speed (m/s) 1-56-1016-20 25-35 Cache Hit Ratio 0.00 0.02 0.04 0.06 0.08 0.10 0.12 0.14 PPRRP PAID FAR Manhattan (c) Figure 12. Cache hit ratio vs client speed for scope distribution 1 Distribu tion: IncreasingSize Client Speed (m/s) 1-56-1016-20 25-35 Cache Hit Ratio 0.0 0.2 0.4 0.6 0.8 PPRRP PAID FAR Manhattan (a) Distribution: RandomSize Client Speed (m/s) 1-56-1016-20 25-35 Cache Hit Ratio 0.0 0.2 0.4 0.6 0.8 PPRRP PAID FAR Manhattan (b) Distribution: DecreasingSize Client Speed (m/s) 1-56-1016-20 25-35 Cache Hit Ratio 0.0 0.2 0.4 0.6 0.8 1.0 PPRRP PAID FAR Manhattan (c) Figure 13. Cache hit ratio vs client speed for scope distribution 2  94 A. KUMAR ET AL. Copyright © 2008 SciRes. I. J. Communications, Network and System Sciences. 2008; 1:1-103 Distribution: IncreasingSize Zipf parameter (θ) 0.0 0.2 0.4 0.6 0.8 1.0 Cache Hit Ratio 0.0 0.1 0.2 0.3 0.4 0.5 0.6 PPRRP PAID FAR Manhattan (a) Distribution: RandomSize Zipf parameter (θ) 0.0 0.2 0.4 0.6 0.8 1.0 Cache Hit Ratio 0.0 0.1 0.2 0.3 0.4 0.5 0.6 PPRRP PAID FAR Manhattan (b) Distribution: Decreas ingSize Zipf parameter (θ) 0.0 0.2 0.4 0.6 0.8 1.0 Cache Hit Ratio 0.0 0.1 0.2 0.3 0.4 0.5 PPRRP PAID FAR Manhattan (c) Figure 14. Cache hit ratio vs zipf parameter for scope distribution 1 Distribution: IncreasingSize Zipf parameter (θ) 0.0 0.2 0.4 0.6 0.8 1.0 Cache Hit Ratio 0.4 0.5 0.6 0.7 0.8 PPRRP PAID FAR Manhattan (a) Distribution: RandomSize Zipf parameter (θ) 0.0 0.2 0.4 0.6 0.8 1.0 Cache Hit Ratio 0.4 0.5 0.6 0.7 PPRRP PAID FAR Manhattan (b) Distribution: Decreas ingSize Zipf parameter (θ) 0.0 0.2 0.4 0.6 0.8 1.0 Cache Hit Ratio 0.3 0.4 0.5 0.6 0.7 PPRRP PAID FAR Manhattan (c) Figure 15. Cache hit ratio vs zipf parameter for scope distribution 2 |