World Journal of Engineering and Technology
Vol.04 No.02(2016), Article ID:66980,26 pages
10.4236/wjet.2016.42034
Influence of Macro-Topography on Damage Tolerance and Fracture Toughness of Monolithic Epoxy for Tribological Applications
Rasheed Atif, Fawad Inam*
Department of Mechanical and Construction Engineering, Faculty of Engineering and Environment, Northumbria University, Newcastle upon Tyne, UK

Copyright © 2016 by authors and Scientific Research Publishing Inc.
This work is licensed under the Creative Commons Attribution International License (CC BY).
http://creativecommons.org/licenses/by/4.0/


Received 18 March 2016; accepted 28 May 2016; published 31 May 2016
ABSTRACT
Influence of topographical features on mechanical properties of monolithic epoxy samples has been studied. The topographical features studied include waviness (Wa), roughness average (Ra), root mean square value (Rq), and maximum roughness height (Rmax or Rz). The Rz of as-cast monolithic epoxy samples was 13.93 µm. By treating with velvet cloth, the Rz value significantly decreased to 2.28 µm. The Rz value of monolithic epoxy sample treated with abrasive paper 1200P was 4.85 µm which was also lower than that of as-cast monolithic epoxy samples. However, Rz values significantly increased by treating with abrasive papers 320P and 60P and became 20.32 µm and 39.32 µm, respectively. It was interesting to note that although Ra, Wa, and Rq, all increased by treating the monolithic epoxy samples with abrasive paper 1200P, however, Rz decreased by abrasive paper 1200P. A weight loss of up to 17% was observed in monolithic epoxy samples after the treatment with the abrasive papers. Both V-shaped and U-shaped notches were produced on the surfaces of the samples. The mechanical properties were significantly degraded due to surface notches mainly because of the associated stress concentration effect. The topographical features also influenced the dynamic mechanical properties and fracture mode.
Keywords:
Topography, Fracture Toughness, Monolithic Epoxy, Mechanical Properties, Fractography

1. Introduction
The tribological protection of stiff technical polymers, such as epoxy, is finding proliferating interest to employ them in mechanical engineering applications [1] - [5] . To grasp phenomenological understanding of tribology and fracture mechanics, it is of foremost importance to study the interplay between topographical features and bulk properties [6] . To improve the wear resistance of monolithic polymers, surface coatings are applied. It is because the preferential growth of crystallites in subsequent deposition closes the cracks and gives the option to tailor the topographical features as per the design/service requirements [7] - [10] . Various coating techniques include galvanic/electrochemical deposition and plasma and thermal spraying that can yield thick coatings of high load support [11] .
Although efficient adhesion strength between coating and substrate may be achieved in as-coated samples, however, delamination takes place when subjected to external loading. It is because the coatings have too high stiffness and too low plastic deformability to follow the substrate deformation. This disparity may be exacerbated in the presence of thermal stresses or elevated temperatures due to disparate coefficient of thermal expansion (CTE) of coating and the substrate. For example, epoxy may show ten times more thermal expansion than most of the thin film materials studied [11] . Alternatively, polymer coatings on polymer substrate may have comparable stiffness and CTE; however, they fail in tribological applications. Therefore, even if coated, it is highly likely that the polymers will suffer from wear in applications where sliding contact is inevitable. Hence, it becomes essential to study the behavior of monolithic polymers for tribological applications. The tribology primarily deals with the surface condition and topography.
The various features of topography include: 1) surface roughness; 2) surface waviness; 3) surface form; 4) lay, as shown in Figure 1 [12] . As various factors influence topographical features, therefore it is conventional to study them separately during the analysis. In general, component performance related to topography (e.g., friction reflectivity, wear characteristics, lubrication properties, and resistance to stress failure) is studied evaluating the surface roughness parameter. And component performance related to abrasive tool (e.g., vibration or noise generation) is studied by analyzing the surface waviness parameter [12] .
The topography is not only important in monolithic polymers, but also in case of Polymer Matrix Composites (PMCs) [13] - [15] . Epoxy is an excellent matrix for composites because of its many features superior to that of competition including but not limited to handling characteristics, improvement in composite mechanical properties, acceptable cost, and processing flexibility [16] . A plethora of research has been dedicated to improve the performance of polymer nanocomposites. Gao et al. have shown that interfacial interactions and mechanical properties of carbon fiber-epoxy composites can be improved by increasing the surface roughness of the filler [17] . They also show that surface roughness in a few tens of nanometer scale does not contribute significantly in increasing the interfacial adhesion from the “mechanical interlocking” [17] . Surfaces can be made rough or porous to enhance the extent of mechanical interlocking [12] . Karger-Kocsis et al. have reported that hierarchical and hairy fillers have high surface area and capillary wetting by the polymers [18] . The textured fillers also exhibit mechanical interlocking with the polymers and cause local reinforcement of the fiber-matrix interphase [18] . Moon and Jang study the mechanical interlocking and wetting at the interface between argon plasma treated ultra-high modulus polyethylene (UHMPE) fiber reinforced vinylester resin composite [19] .
They observe a significant increase in interlaminar shear strength. It has been shown that plasma etching of UHMPE produces micro-pittings on fiber surface and this spongy surface structure helps improve mechanical interlocking with the polymer matrix and causes a significant increase in interlaminar shear strength [20] - [23] . The topography can be controlled during synthesis such as using a combination of UV lithography and electro- deposition [24] . The topographical features may also be tailored by texturing the mold surface when the production route is the casting.
Any regular or irregular spacing on the surface tend to form a texture or pattern [12] . The surface textures are formed during the casting, manufacturing, or machining processes. Another important factor is microstructure of the material as internal stresses, released after machining, can also contribute to surface deformation, and may form a specific topography. The machining processes can significantly influence the topography. A major factor is the action of the abrasive tool on the material. Elements such as tool speed, feed, shape, and cutting fluids can affect the topography. Other influential factors can be instability of the abrasive tool due to chatter or imbalance in the grinding wheel, and errors in the machine tool guideway [12] .
The primary reason to study the topographical features is to try to forecast the performance of the system. For
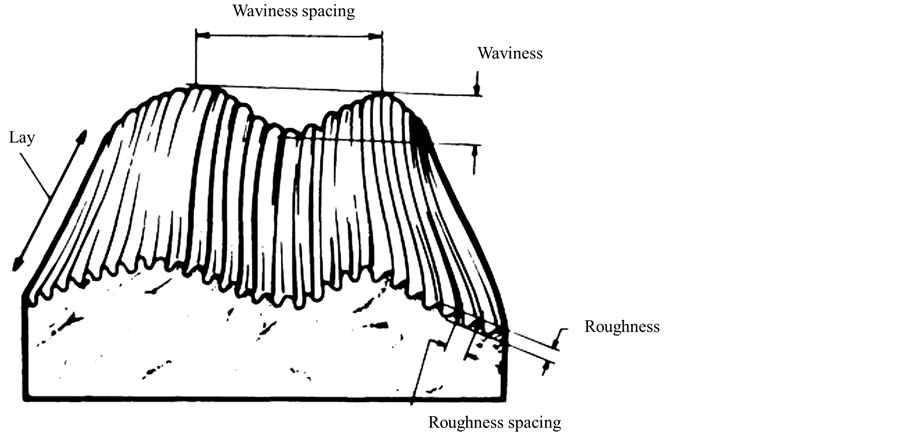
Figure 1. Illustration of the roughness, waviness, and general form of a surface [12] .
example, the surface of a bearing should be textured such that it allows lubricant to be retained in small pockets and at the same time allows the bearing movement with a minimum of friction. If the surface has high roughness, wear will be expedited; however, if the surface has low roughness, poor lubrication and seizure may take place. Therefore, a compromise between smoothness and roughness is essential to maintain. The other reason to measure the topographical features is to control the manufacturing process as the operator can detect variation in surface finish and adjust the controllables to ensure that the process remains in limit [12] .
A simple and common method to measure topographical features is the surface texture recorder whose principle is schematically shown in Figure 2 [12] . The stylus is moved across the surface with the help of a guiding mechanism to produce the “traced profile”, which is produced by the interaction of the stylus with the surface of the sample. The transducer generates a signal which is produced from the difference between a “reference profile” or “datum profile” and the traced profile. The transducer signal is converted into a digital signal using an analog-to-digital converter. At this point, the transducer contains only the vertical or Z-component of the profile. The traversing component generates the horizontal or X-component which is combined with the Z-component to acquire the “total profile”. The total profile is then filtered to omit unnecessary information which generates a “primary profile.”The filtering techniques can further be employed to separate the waviness, roughness, and form features of the surface [12] .
For effective analysis of topographical features, the obtained profile needs to be analyzed according to internationally recognized mathematical formulae which are called parameters. A certain number can be given to a certain aspect of topographical features to compare it with another pattern or reference and to remove the need for subjective operator assessment. A single parameter is not enough to characterize the topography completely. Therefore, multiple parameters are usually used.
The parameters can be divided into four basic types: 1) Amplitude parameters measure the vertical characteristics of topography. 2) Spacing parameters measure the irregularity spacings along the surface, regardless of the amplitude of these irregularities. 3) Hybrid parameters measure a combination of the spacing and amplitude of the surface irregularities. 4) Extended parameters are not only defined by the profile data and require further attributes or inputs [12] . The most common use of engineering surfaces is to provide a bearing surface for another component moving relative to it, resulting in wear. The material ratio (Figure 3) parameter Tp (in %) is commonly used to study the effect of wear on a surface [12] . Material ratio is defined as the ratio of the length of the surface to the evaluation length at a specified depth in the profile [12] . The parameter Tp can thus be used to control bearing surfaces as well as surfaces requiring lubrication [12] .
The damage tolerance is the ability of a critical structure to withstand a level of service or manufacturing-induced damage or flaws while maintaining its function [16] . The damage tolerance of aircraft components is necessarily studied to avoid any catastrophic in-flight failure. The damage tolerance tests ensure that the

Figure 2. Basic principle of a surface texture recorder.

Figure 3. Illustration showing the derivation of material ratio, Tp [12] .
component under inspection does not undergo functional impairment during its service life or within the duration between two scheduled maintenances. The functional impairment is defined as the presence of damage in a part that requires maintenance action [16] . The PMCs have found extensive applications in aerospace, automotive, and construction owing to ease of processing and high strength to weight ratio which is an important property required for aerospace applications [25] . Among different polymers, epoxy is the most commonly used thermosetting polymer matrix in PMCs [16] .
In current study, topography was modified by treating monolithic epoxy samples with abrasive papers of different surface roughness values. An Alicona optical microscope was used to study the topographical features of produced samples. The mechanical properties, dynamic mechanical properties, and fractography of produced samples were studied. The results showed that topographical features can significantly improve the above-stated properties of monolithic epoxy samples.
2. Experimental Section
2.1. Materials
Bisphenol A-epichlorohydrin based epoxy having density of ~1.3 g/cm3 and dimethyl benzylamine isophorone diamine based low viscosity fast curing hardener with ~1.1 g/cm3 density were used in current study. The epoxy matrix used consisted of EPOPHENTM EL5 bisphenolA based liquid epoxy and EPOPHENTM EHA57 diamine hardener, purchased from Polyfibre, UK. This epoxy system is a multi-purpose resin offering good all-round properties with the epoxy group content of 4.76 - 5.25 mol/kg. The viscosity of liquid epoxy and hardener are 12,000 - 15,000 cps and 45 cps at room temperature, respectively. To prepare monolithic epoxy samples, the mix proportions are 50 parts by weight of hardener to 100 parts by weight of liquid epoxy. The gelation time of the resin was 43 min at room temperature.
2.2. Samples Production
The epoxy and hardener were initially degassed separately for 1 h each. The epoxy and hardener were mixed using sonication that was carried out using tip sonicator of power 750 W and frequency 250 kHz (Vibra-cell model VC 750, USA). The operation mode was 70% power with 10 s vibration and 5 s break. Although the sonication was carried out at room temperature, however, temperature of the system rose due to high energy vibration produced by tip sonicator. Then, vacuum degassing was again carried out for 15 min. The resin was poured into silicone molds (without any release agent) and cured at room temperature for 6 h followed by post-curing at 150˚C for overnight to ensure completion of the crosslinking. The top and bottom surfaces of each sample were treated with abrasive papers for 1 min on rotating wheels at rotational speed of 150 rpm.
2.3. Characterization
The densification of samples was calculated according to ASTM Standard D792. The densities of epoxy, hardener, and water were, 1.3, 1.1, and 0.9975 g/cm3, respectively. Experimental density and densification were calculated using Equations (1) and (2), respectively.
 (1)
(1)
 (2)
(2)
Vickers microhardness test was conducted using Buehler Micromet II to determine the hardness values of the samples. The load applied was 200 g for 10 seconds. Tensile, three-point bending, and fracture toughness tests were conducted using Instron Universal Testing Machine (Model 3382). The displacement rate was kept 0.5 mm/min for tensile and fracture toughness tests and 1 mm/min for three-point bending test. Five specimens were tested for each composition. The schematics of the specimens are shown in Figure 4.
Tensile properties were measured according to ASTM D638 Type-V geometry with specimen thickness 4 mm. Three-point bending test was conducted according to ASTM D790 with specimen dimensions 3 × 12.7 × 48 mm. A single-edge-notch three-point bending (SEN-TPB) specimen was used to determine mode-I fracture toughness (K1C) according to ASTM D5045. The specimen dimensions were 3 × 6 × 36 mm with a crack of length 3 mm. The notch was made at the mid of sample and tapped to sharpen by a fresh razor blade. The K1C was calculated using Equation (3),
 (3)
(3)
where, Pmax is maximum load of load-displacement curve (N), f(a/w) is constant related to geometry of the sample and was calculated using Equation (4), B is sample thickness (mm), W is sample width (mm), and a is crack length (kept between 0.45 W and 0.55 W). The critical strain energy release rate (G1C) was calculated using Equation (5) where E is the Young’s modulus obtained from the tensile tests (MPa), and ν is the Poisson’s ratio of the polymer, taken to be 0.35.
 (4)
(4)
 (5)
(5)
Charpy impact toughness test was carried out according to ASTM D6110 using notched specimen with dimensions 3.2 × 12.7 × 64 mm. A V-notch (45˚) was made in the middle of the specimen whose depth was 2.5 mm and tip of radius 0.25 mm. The specimen was placed as simply supported beam and hit by hammer from behind the notch. The impact toughness was calculated using Equation (6),

Figure 4. Schematics of mechanical test specimens: (a) tensile, (b) three point bend, (c) fracture toughness, and (d) Charpy impact toughness test specimens.
 (6)
(6)
where, m is hammer mass (kg), g is standard gravity (9.8 m/s2), h is length of hammer arm (m), β is hammer swing up angle after test piece breaks (rad), α is hammer lifting up angle (rad), w is sample width (mm), and t is sample thickness (mm).
An Alicona Infinite Focus optical microscope (G4) was used to generate optical micrographs and measure topographical features. DMA (Model 8000, PerkinElmer) was used to determine dynamic storage modulus (E’), and loss modulus (E”) of the samples. The loss factor (Tanδ) was calculated as the ratio (E”/E’). Rectangular test specimens of dimensions 2.5 × 8 × 30 mm were used with a single cantilever clamp. All tests were carried out by temperature sweep method (temperature ramp from 30˚C to 180˚C at 5˚C/min) at a constant frequency of 1 Hz. The maximum force of DMA was 10 N and applied during all tests. The glass transition temperature (Tg) was taken as the temperature value at the peak of Tanδ curves. Scanning electron microscopy analysis using a SEM FEI Quanta 200, was carried out of the fractured surfaces of tensile specimens to evaluate the fracture modes in the samples. The fractured portions were cut from the specimens and a layer of gold was applied using Emscope sputter coater model SC500A.
3. Results and Discussion
The SEM images of abrasive papers are shown in Figure 5. SEM images of velvet cloth (Figures 5(a)-(c)) show that fibers are vertically aligned with localized intermingling of the fibers. The individual fiber consists of multiple small fibers stacked together (Figure 5(c)). The abrasive particles on abrasive paper 1200P (Figures 5(d)-(f)) are relatively smaller in size and nearly uniformly dispersed with small debris spread on the surface. The abrasive particles on abrasive paper 320P (Figures 5(g)-(i)) are relatively coarser in size than that of abrasive paper 1200P. The individual particles have rough geometry (Figure 5(i)). Therefore, surface roughness on the treated samples should be expected of very wide size distribution. The abrasive particles on abrasive paper 60P (Figures 5(j)-(k)) are the largest in size with sharp edges (Figure 5(k)) like a machining tool. Therefore, the coarsest surface roughness should be expected in samples treated with abrasive paper 60P.
The Energy Dispersive Spectroscopy (EDS) spectrum of abrasive paper is shown in Figure 6. The peak at 0 keV represents noise. The peak at 1.7 keV represents gold (Au) which comes due to the sputter coating of gold layer on the sample. The highest peaks are of C, Si, and O which show that the abrasive papers primarily consist
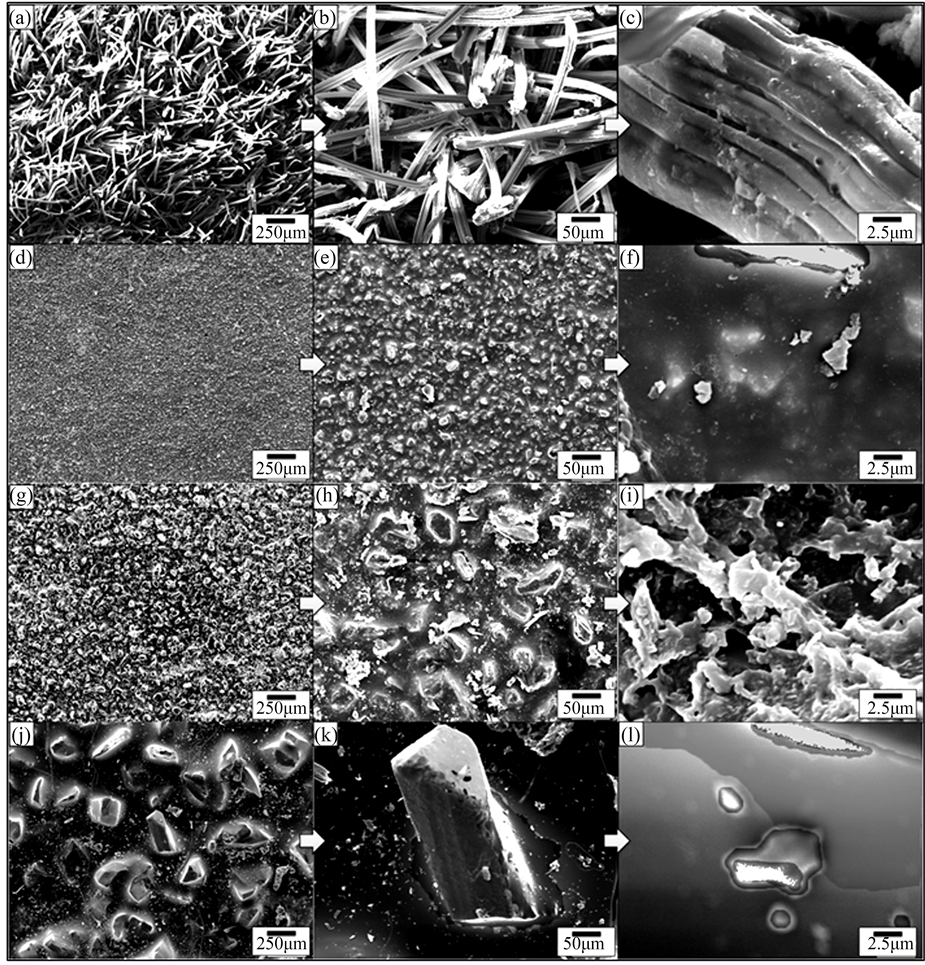
Figure 5. SEM images of abrasive papers: (a)-(c) Velvet cloth, (d)-(f) 1200P, (g)-(i) 320P, and (j)-(l) 60P.
of SiC and certain amount of oxides. The abrasive paper is produced by a high temperature reaction between SiO2 and C producing SiC and unreacted Si, C, and O. Besides, Ca and Cu peaks are also observed which may be the constituents of the glue used to fix the abrasive particles on the surface.
The variation in weight loss in monolithic epoxy samples when treated against abrasive surfaces of varying surface roughness values is shown in Figure 7(a). The weight loss significantly increased as the coarseness of the abrasive paper increased. The values shown are the average of 20 different samples. A relatively large standard deviation was observed. This scatter can be attributed to the non-uniform surface roughness of the abrasive paper. It is because the abrasive particles were of different morphology as schematically shown in Figure 7(b). This scatter would be helpful in producing some useful results as the in-service epoxy samples also come in contact with surfaces having non-uniform surface roughness. In addition, when the epoxy is cast in machined mold or cavity, the mold or cavity also contains corrugations of varying depth and shape due to machine vibrations and possible wobbling of the machining tool.

Figure 6. EDS spectrum of abrasive paper.

Figure 7. (a) Weight loss (%) in monolithic epoxy samples after treatment with abrasive papers. (b) Varying surface roughness of abrasive paper produces samples with varying topography.
The topographical features of the samples were measured using an Alicona optical microscope. The Alicona optical microscope is a non-contact method (focus-follow method) for topography measurement. The focus-follow method (Figure 8) involves the use of a moving lens which keeps a spot of light focused on the surface. The vertical movement of the lens is controlled by an electric motor and correlates to the surface profile [12] . The analog electrical signal is generated to drive the motor which is then digitized and processed in the same manner as a contact stylus. A separate transducer may also be used to monitor the position of the lens. Non-contact techniques are getting increasingly popular to measure topographical features, especially for surfaces that may be subject to damage using contact techniques. The results obtained are very similar to those of stylus techniques and can use the same parameter definitions. Some non-contact techniques, such as diffraction measurements, can measure topographical features easily and quickly and can potentially be used on abrasive tools at the point of manufacture. The non-contact methods have certain limitations. For example, in high slopesurfaces, an insufficient intensity of light reaches the detector and the focus lens begins to follow inaccurately. In addition, when the contaminated surfaces are studied, the contamination is measured as part of topographical features as there is no external agency to remove the contaminations from the surface [12] . Considering these

Figure 8. Focus-follow method for non-contact measurement of roughness [12] .
limitations, it was ensured that samples are placed flat and surface is clean to obviate any artefacts in topography profiles.
The 3D images of abrasive papers and their surface roughness values are shown in Figure 9. Surface roughness refers to high frequency irregularities which are produced when the sample is exposed to abrasive tool [12] . The surface roughness values significantly increased from abrasive paper 1200P to abrasive paper 60P. The surface roughness of velvet cloth is also very high. However, it should be noted that the velvet cloth is soft, and therefore, its impression on the sample will be the softest. Hence, minimum surface roughness is expected on the samples treated with the velvet cloth. The other three abrasive papers are hard and would leave the impression on the samples commensurate with the actual surface roughness of the abrasive papers.
The topographical features of monolithic epoxy samples are summed up in Figure 10. Surface waviness refers to the medium-frequency irregularities on the sample surface with wave-like structure comprising of seriesof crests and toughs [12] . Surface waviness is produced by errors in the machine tool guideway and/or the instability of the abrasive tool [12] . The waviness (Wa) of as-cast monolithic epoxy samples was 1.44 µm. By treating with velvet cloth, the Wa value decreased to 0.3 µm. The Wa value of monolithic epoxy samples treated with abrasive paper 1200P increased to 2.37 µm. The abrasive papers 320P and 60P further increased the Wa values to 5.68 µm and 7.13 µm, respectively.
A similar trend was observed in case of surface roughness (Ra). The Ra is defined as the mean height of the roughness profile and is superimposed on the surface waviness [12] . The Ra is one of the most commonly used roughness amplitude parameters. It assesses the coarseness of the surfaces such as those produced by turning, milling, and grinding operations. The Ra value of as-cast monolithic epoxy samples was 0.87 µm. By treating with velvet cloth, the Ra value decreased to 0.70 µm. The Ra value of monolithic epoxy samples treated with abrasive paper 1200P increased to 1.26 µm. The abrasive papers 320P and 60P further increased the Ra values to 2.84 µm and 5.78 µm, respectively.
As the averages of numbers 2 & 4 and 1 & 5 are the same, similarly, being an average value, Ra therefore cannot give accurate information about the topographical features. The disparate profiles can have the same Ra value and yet have very different performance characteristics [12] . Another average parameter, Rq states the root mean square of the profile and is more sensitive to surface variation [12] . The treatment of monolithic epoxy samples treated with abrasive papers also influenced the Rq values. The Rq value of as-cast monolithic epoxy

Figure 9. 3D images of abrasive papers: (a) Velvet cloth, (b) 1200P, (c) 320P, and (d) 60P, with corresponding surface roughness shown in (e)-(h), respectively.

Figure 10. Surface roughness parameters of monolithic epoxy samples.
samples was 1.0 µm. By treating with velvet cloth, the Rq value decreased to 0.88 µm. The Rq value of monolithic epoxy samples treated with abrasive paper 1200P increased to 2.67 µm. The abrasive papers 320P and 60P further increased the Rq values to 4.12 µm and 7.44 µm, respectively.
The maximum roughness height is another important parameter and was varied by treatment with abrasive papers. Sometimes, it becomes desirable to specify the maximum roughness height (Rmax) or peak-to-valley height (Rz), rather than using Ra [12] . The Rz parameter measures the highest and lowest points of the profile and is valuable when products are subject to elevated stresses. Any large peak-to-valley heights may be areas likely to suffer from crack propagation due to stress concentration and possible triaxial state of stress generated at the notch tip [12] . However, as Rz is very susceptible to scratches or dirt, it is an unstable parameter [12] . The Rz of as-cast monolithic epoxy samples was 13.93 µm. By treating with velvet cloth, the Rz value significantly decreased to 2.28 µm. The Rz value of monolithic epoxy sample treated with abrasive paper 1200P was 4.85 µm which is also lower than that of as-cast monolithic epoxy samples. However, Rz values significantly increased by treating with abrasive papers 320P and 60P and became 20.32 µm and 39.32 µm, respectively. It is interesting to note that although Ra, Wa, and Rq, all increased by treating the monolithic epoxy samples with abrasive paper 1200P, however, Rz decreased by abrasive paper 1200P.
The topographical details of abrasive papers are shown in Figure 11. Figure 11(ai) shows the optical micrograph of velvet cloth where protruded fibers can be observed. Any black spots are artefacts in the optical images as these regions are either above or below the focus range. The fiber structure is more prominent in Figure 9(a) with 3D image of the fibers. Due to the protruded fibers, the profile showed high waviness and surface roughness. The waviness of velvet cloth is shown in Figure 11(aii). Although roughness amplitude is very important parameter, the spacing (waviness) of the roughness peaks can be equally important [12] . The upper bound of Wais about 120 µm and lower bound is −130 µm that show that waviness of velvet cloth varies between 250 µm. The Ra of velvet cloth is shown in Figure 11(aiii). The surface roughness alters abruptly between 250 µm. It is because the fibers of velvet cloth are oriented in random orientations. The Gaussian distribution of surface roughness of velvet cloth is shown in Figure 11(aiv). The distribution shows typical bell-shaped curve that indicates that surface roughness is varied and most of the surface roughness values are concentrated between ±120 µm with the maximum extension up to ±400 µm. The roughness profile of complete velvet cloth sample, as shown in Figure 9(a), was determined and is shown in Figure 11(av). The distribution shows that Rz is about 1.4 mm.
The optical micrograph of abrasive paper 1200P is shown in Figure 11(bi). The abrasive particles are nearly uniformly distributed on the surface except a few rarefied regions. In addition, it was observed that the abrasive paper is not perfectly flat and contains waviness to a certain degree which is evident in Figure 11(bii). The waviness varies between ±20 µm. Apart from waviness, the abrasive particles are also of non-uniform size which affects the surface profile as shown in Figure 11(biii). The roughness alters sharply with distance and lies in the range of ±10 µm. The Gaussian distribution of surface roughness of abrasive paper 1200P is shown in Figure 11(biv). The roughness varies from −110 µm to 60 µm with most of the protruded particles concentrated between 10 µm to 40 µm. The roughness profile of abrasive paper 1200P is shown in Figure 11(bv). A major fraction of roughness is ±20 µm. As the optical micrograph (Figure 11(bi)) showed that 1200P is not perfectly flat, this is also evident in roughness profile (Figure 11(bv)).
The optical micrograph of abrasive paper 320P is shown in Figure 11(ci). The abrasive powder of relatively wide size distribution is nearly uniformly distributed over the surface. The waviness (Figure 11(cii)) varies between +20 µm to −15 µm and roughness varies between +30 µm to −20 µm. It can also be observed that certain roughness peaks (Figure 11(ciii)) are pointed and other are curved that show that certain particles are sharp and other angular. Using this roughness profile, samples can be produced containing V-shaped and U-shaped notches, simultaneously. As V-shaped notches have higher associated stress concentration effect at the notch tip than that of U-shaped notches, therefore, V-shaped notches will influence the mechanical properties more strongly than U-shaped notches. The Gaussian distribution of surface roughness of abrasive paper 320P is shown in Figure 11(civ). There is large size distribution and varies between −110 µm to 115 µm. The roughness profile of abrasive paper 320P is shown in Figure 11(cv). There is large variation of particle size with no domination of one particular size.
The optical micrograph of abrasive paper 60P is shown in Figure 11(di). The abrasive particles can clearly be seen being separated by a brown phase which can be the glue to adhere the particles with the surface. As the particle size is very large, large waviness and roughness are certain. The waviness varies between ±70 µm (Figure 11(dii)) and roughness varies between ±300 µm (Figure 11(diii)). The Gaussian distribution of surface roughness is shown in Figure 11(civ). A typical bell-shaped curve is obtained with ends at ±320 µm. The roughness profile of abrasive paper 60P is shown in Figure 11(dv). A coarse profile is obtained due to large particle size. The Rz value goes as high as 1 mm.
The topographical features of monolithic epoxy samples are shown in Figure 11. Figure 11(ei) shows the optical micrograph of as-cast monolithic epoxy sample. The waviness of the sample varies between ±15 µm


Figure 11. Topography profiles of abrasive papers and monolithic epoxy samples: (a) Velvet cloth, (b) 1200P, (c) 320P, (d) 60P, (e) as-cast monolithic epoxy, and (f) monolithic epoxy sample treated with velvet cloth, (g) 1200P, (h) 320P, and (i) 60P. In all the cases, (i) optical image, (ii) waviness, (iii) surface roughness of selected line, (iv) percentage vs. topographical dimensions, and (v) surface profile of selected rectangular specimen.
(Figure 11(eii)). The surface roughness (Figure 11(eiii)) also varies between ±15 µm. This surface roughness is coming from the mold surface. The surface roughness graph shows that pointed notches of about 20 µm are present on the as-cast monolithic epoxy sample. The Gaussian distribution (Figure 11(eiv)) shows that the roughness size is nearly uniformly distributed and varies between −40 µm to 60 µm. The roughness profile (Figure 11(ev)) shows that most of the roughness lies within 100 µm. The optical images of mold surfaces are shown in Figure 12.
Figure 11 (fi) shows the optical micrograph of monolithic epoxy sample treated with velvet cloth for 1 min (each side) on rotating wheels with rotational speed of 150 rpm. The waviness (Figure 11(fii)) varies between −5 µm to 2 µm which is much lower than that of as-cast monolithic epoxy. The surface roughness (Figure 11(fiii)) varies between ±4 µm which is again lower than that of monolithic epoxy. The Gaussian distribution (Figure 11(fiv)) shows that the roughness size is nearly uniformly distributed and varies between ±90 µm. This large range of surface roughness can be explained on the basis of diamond paste. The diamond paste had average particle size of 3 µm. Therefore, remnant dispersed and agglomerated diamond particles contributed toward surface roughness. The roughness profile (Figure 11(fv)) shows that most of the roughness lies within 40 µm.
Figure 11(gi) shows the optical micrograph of monolithic epoxy sample treated with abrasive paper 1200P. The waviness (Figure 11(gii)) varies between ±4 µm. The surface roughness (Figure 11(giii)) varies between

Figure 12. Mold photographs: (a) tensile, (b) K1C, (c) flexural, and (d) Charpy impact toughness molds, and magnified images shown in (e)-(h), respectively.
±3 µm. The surface roughness fluctuates more quickly than in as-cast and velvet treated samples. The Gaussian distribution (Figure 11(giv)) shows that a nearly uniform distribution of roughness was obtained and varies between ±90 µm. The roughness profile (Figure 11(gv)) shows that most of the roughness lies within 40 µm. The roughness values of samples treated with velvet cloth and abrasive paper 1200P are nearly similar.
Figure 11(hi) shows that the optical micrograph of monolithic epoxy sample treated with abrasive paper 320P. The scratches of different size and orientation can be observed. The waviness (Figure 11(hii)) varies between ±10 µm. The surface roughness (Figure 11(hiii)) varies between +10 µm to −20 µm. A deep pointed notch can be observed which can later influence the mechanical properties of the samples. The Gaussian distribution (Figure 11(hiv)) shows that the roughness is concentrated between −140 µm to −110 µm. The roughness profile (Figure 11(hv)) shows that coarse topography varies in 100 µm range.
Figure 11(ii) shows the optical micrograph of monolithic epoxy treated with abrasive paper 60P. A coarse topography can be observed. The waviness (Figure 11(iii)) varies between ±20 µm which is highest in all samples. The surface roughness (Figure 11(iiii)) varies abruptly between ±30 µm and pointed notches can be observed. The Gaussian distribution (Figure 11(iiv)) varies between −80 µm and 30 µm with typical bell-shaped curve. The surface profile of larger sample (Figure 11(iv)) shows that coarse topography is present with roughness up to 140 µm.
It can be observed from the topographical analysis above that the treatment of monolithic epoxy samples with abrasive papers produced topography with different size, shape, and orientation of notches and corrugations. It can be attributed to varying roughness and particle size distribution of abrasive papers used. Another important feasible mechanism could be the crater formation. When abrasive tool slides against the sample surface, elevated temperatures are produced at the contact surface due to frictional forces. The debris produced as a result of wear may coalesce at high temperature. This coalescence may result from diffusion, dissolution, cold-welding, and related possible chemical interactions [26] . The coalesced particles result in crater formation on the surface which may significantly deteriorate the mechanical properties as shown in Figure 13. If crater formation is part of the wear limit criterion, the topography can be analyzed by the depth of the crater or the projected area of the crater [26] .
Surfaces are not completely flat at the microscopic level. At high magnification, even the best polished surface will show ridges and valleys, asperities, and depressions. When two surfaces are brought together, they touch intimately only at the tips of a few asperities. At these points, the contact pressure may be close to the hardness of the softer material; plastic deformation takes place on a very local scale, and cold welding may form strongly bonded junctions between the two materials. When sliding begins, these junctions have to be broken by the friction force, and this provides the adhesive component of the friction. Some asperities may plow across the surface of the mating material, and the resulting plastic deformation or elastic hysteresis contributes to the friction force; additional contributions may be due to wear by debris particles that become trapped between the sliding surfaces [27] .

Figure 13. Debris coalescence and crater formation due to frictional forces between two sliding surfaces.
The topographical features influenced mechanical properties of monolithic epoxy samples as shown in Figure 14. The Young’s modulus (Figure 14(a)) increased from 749 MPa to 796 MPa (6% increase) when monolithic epoxy was treated with velvet cloth. The Young’s modulus of monolithic epoxy treated with 1200P also increased to 772 MPa (3% increase). However, the Young’s modulus of monolithic epoxy treated with 320P decreased to 742 MPa (0.9% decrease). The maximum decrease in Young’s modulus was observed when the samples were treated with abrasive paper 60P and decreased to 727 MPa (3% decrease). The values show that Young’s modulus can be increased by treatment with velvet cloth and abrasive paper 1200P and decreased by treatment with abrasive papers 320P and 60P.
The influence of topography on UTS is shown in Figure 14(b). The UTS of monolithic epoxy treated with velvet cloth increased from 50 MPa to 52 MPa (3% increase). The maximum increase in UTS of monolithic epoxy was observed when monolithic epoxy treated with abrasive paper 1200P and UTS increased to 55 MPa (4% increase). The UTS of monolithic epoxy treated with abrasive paper 60P decreased to 49 MPa (2% decrease). When treated with abrasive papers 60P, the UTS decreased to 47 MPa (5 % decrease).
The increase in Young’s modulus and UTS with velvet cloth and abrasive paper 1200P can be attributed to the smoothening of surfaces as as-cast specimens had surface roughness values between ±15 µm. In comparison, the surface roughness of monolithic epoxy treated with velvet cloth varied between ±4 µm and that of abrasive paper 1200P varied between ±3 µm. Therefore, strength and modulus can be increased by treatment with velvet cloth and abrasive paper 1200P. On the contrary, the surface roughness of monolithic epoxy samples treated with 320P varied between ±20 µm and that of abrasive paper 60P varied between ±30 µm. Therefore, it can be concluded that surface roughness beyond ±20 µm has detrimental effect on tensile strength and modulus of monolithic epoxy samples. Accordingly, the surface roughness below ±20 µm is benign for tensile properties of monolithic epoxy samples.
The influence of topography on tensile strain is shown in Figure 14(c). The tensile strain kept increasing with coarser topography which can be attributed to lower stiffness and strength values. The tensile strain did not change much with velvet cloth and slightly increased in case of abrasive paper 1200P. Therefore, overall better tensile properties can be achieved when samples are treated with velvet cloth and abrasive paper 1200P.
The influence of topography on flexural modulus of monolithic epoxy is shown in Figure 14(d). The flexural modulus of as-cast monolithic epoxy is 2.5 GPa. When treated with velvet cloth, the flexural modulus increases to 2.8 GPa (13% increase). The flexural modulus of monolithic epoxy sample treated with abrasive paper 1200P is 2.8 GPa (16% increase). Please note that the % change is calculated based on the actual values achieved rather than significant figures. In all the values, only two digits are shown as significant figures. The third digit may not be considered as significant figure due to the standard deviation and hence not reported. The flexural modulus of sample treated with 320P is 2.7 GPa (10% increase) and that of treated with 60P is 2 GPa which shows a decrease of 18%. The variation in flexural modulus is nearly in accordance with the variation in tensile modulus.
The influence of topography on flexural strength is shown in Figure 14(e). The flexural strength of as-cast monolithic epoxy sample is 53 MPa. When treated with velvet cloth, the flexural strength increases to 57 MPa (7% increase). The flexural strength of sample treated with abrasive paper 1200P is 66 MPa (25% increase). The flexural strength of sample treated with 320P remained high and was 65 MPa (22% increase). In comparison to tensile strength which increased only to 3%, an increase of 22% in flexural strength indicates that surface roughness up to ±20 µm is not detrimental to flexural strength. The flexural strength of sample treated with abrasive paper 60P is 54 MPa which is nearly equal to that of as-cast sample. In comparison to tensile strength which decreased by 2%, the flexural strength value of sample treated with 60P indicates that surface roughness up to ±30 µm has detrimental effect on tensile strength while flexural strength seems impervious. The influence of topography on flexural strain (%) is shown in Figure 14(f). The flexural strain nearly remained the same till abrasive paper 320P. However, it increased when sample was treated with abrasive paper 60P. This increase in flexural strain can be explained on the basis of decreased flexural modulus and strength.
The influence of topography on fracture toughness (K1C) is shown in Figure 14(g). No specific trend on K1C was observed and K1C remained nearly the same. One reason can be the orientation of topography with respect to notch and loading axis. The samples were treated with abrasive papers only along wider surfaces and not on the sides of the specimens. Therefore, when the samples were subjected to bending loading, the topographically treated surfaces were parallel to the axis of loading (Figure 15). The deformation and fracture takes place at the tip of notch whose size (3 mm) is much bigger than the surface roughness of topographically modified surfaces. These two reasons may contribute to topography (up to ±30 µm) having no influence on K1C. The values show
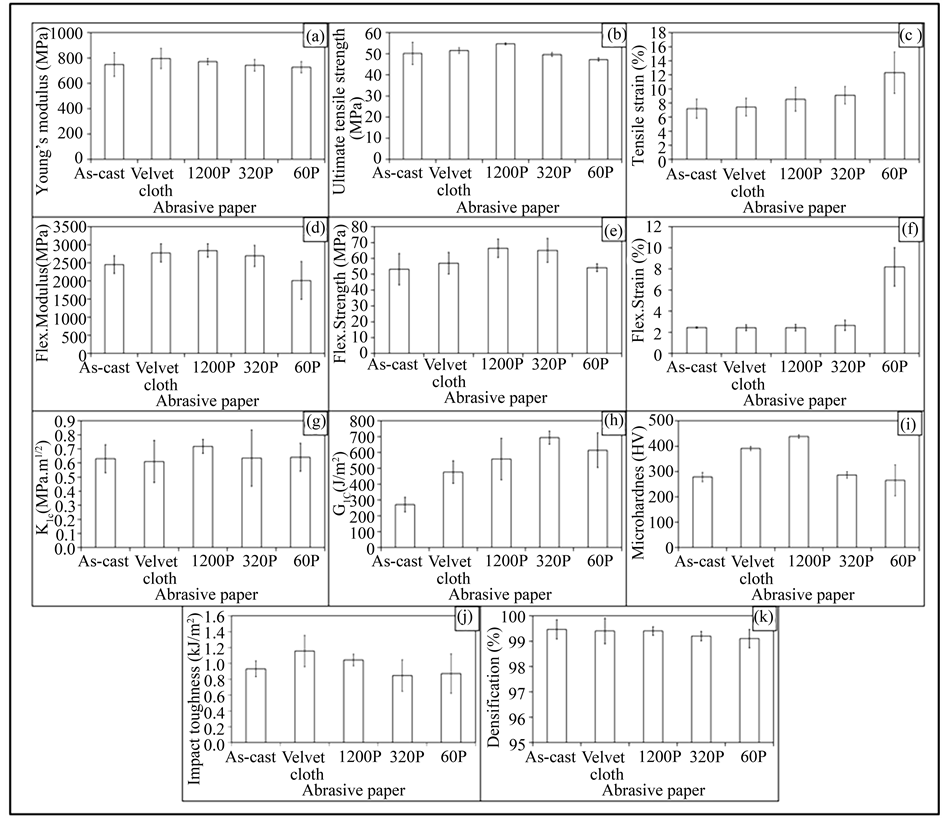
Figure 14. Mechanical properties of monolithic epoxy: (a) Young’s modulus (MPa), (b) UTS (MPa), (c) tensile strain (%), (d) flexural modulus (MPa), (e) flexural strength (MPa), (f) flexural strain (%), (g) K1C (MPa.m1/2), (h) G1C (J/m2), (i) microhardness (HV), (j) Charpy impact toughness, and (k) densification (%).
that standard deviation is different for different samples. It can be because the tip of notch was sharpened manually by a fresh razor blade which may not generate surfaces of equal length and curvature. In addition, the volume fraction, size, and distribution of porosity can be another factor which can influence the mechanical properties.
The variation in G1C of topographically modified monolithic epoxy samples is shown in Figure 14(h). The trend shows that G1C increases as the coarseness of topography increases. However, as topography did not show significant influence on K1C, the authors are skeptical in believing that this increase in G1C is directly coming from topography. In calculating G1C,  is divided by Young’s modulus. As Young’s modulus decreased with coarse topography, therefore the increase in G1C is possibly stemming from decreased Young’s modulus.
The variation in microhardness is shown in Figure 14(i). The hardness of as-cast sample is 278 HV. When treated with velvet cloth, the microhardness increases to 391 HV (41% increase). And when treated with abrasive paper 1200P, microhardness increases to 438 HV (58% increase). This increase in hardness can be attributed to the smoothness of surfaces. A roughness was observed in as-cast specimens. When specimen contains corrugated surface, the tip of the indenter may or may not sit perfectly on the micro-plateau as shown in Figure 16. When the indenter sits perfectly on the surface, resistance is offered by the surface underneath and high value of hardness is observed. On the contrary, when indenter sits on the edge, lower resistance is offered by the

Figure 15. (a) Topographically modified front and back surfaces. The sides were not treated with abrasive papers, (b) as-cast and (c) topographically modified K1C specimen under bending load.

Figure 16. Indenter pressed against (a) smooth and (b) rough surfaces.
edge, and therefore, lower value of hardness is observed. In samples treated with velvet cloth and abrasive paper 1200P, smoothness increased or at least sharp edges were removed. Therefore, an increase in hardness was observed. The hardness decreased in sample treated with abrasive papers 320P and 60P which shows that indenter faces less resistance due to corrugation of the surfaces. The hardness is also a function of applied load. It is known as indentation size effect according to which, “as load increases, the hardness decreases” [28] . It is also defined as, “as impression size decreases, the hardness increases”. Jiang et al. produced non-hydrogenated germanium carbide films by magnetron co-sputtering method in a discharge of Ar [29] . They observed that topography significantly influenced by temperature and both hardness and Young’s modulus increased with increasing temperature. The compressive stress on the surface increases with increasing temperature [29] . Guo et al. deposited hydrogenated nonocrystalline silicon thin films with high hydrogen dilution ratio by plasma enhanced chemical vapor deposition technique [30] . The surface roughness decreased with increasing hydrogen dilution ratio. The hardness and Young’s modulus increased with finer topography [30] . A similar trend was observed in current study where smooth surfaces (treated with velvet cloth and abrasive paper 1200P) caused increase in modulus and hardness values. On the contrary, the coarser surfaces (treated with abrasive papers 320P and 60P) resulted in decrease in modulus and hardness values. In metals, alloys, and ceramics, the indentation size effect may be attributed to grain size, orientation, and phases in the sample. In polymers, it may be because of degree of crosslinking, orientation of polymer chains, and size and distribution of porosity.
The Charpy impact toughness values are shown in Figure 14(j). The Charpy impact toughness value of as- cast monolithic epoxy sample is 0.9 kJ/m2. After treatment with velvet cloth, the monolithic epoxy sample increased to 1.2 kJ/m2 (33% increase). The values of samples treated with abrasive papers 1200P, 320P, and 60P are 1, 0.8, and 0.9 kJ/m2, respectively. Although there was no significant difference observed in fracture toughness values, however, treatment of monolithic epoxy samples with abrasive papers showed a significant impact on Charpy impact toughness values.
The densification of monolithic epoxy samples is shown in Figure 14(k). The densification of as-cast monolithic epoxy samples is 99.5% (mean value). The densification slightly decreased when the samples were treated with abrasive papers. The mean values of densification were 99.4%, 99.4%, 99.2%, and 99.1%, when treated with velvet cloth, 1200P, 320P, and 60P, respectively. This variation in densification may be either caused by the treatment with abrasive papers or the samples had already the same densification values as casting technique is not usually considered 100% reproducible like latex technology [31] .
The flexural stress vs. flexural strain response is shown in Figure 17. It should be noted that not all the samples showed the same response as shown in Figure 17. The average values should be considered from Figure 14. As shown in Figure 17, the as-cast monolithic epoxy sample showed a brittle fracture. It is because of the stiff structure of epoxy and presence of any surface notches and porosity. When sample was treated with velvet cloth and abrasive paper 1200P, both flexural strength and flexural modulus were increased. However, treatment with abrasive papers 320P and 60P had detrimental effect on flexural properties. A similar trend was observed for other mechanical properties as shown in Figure 14.
The images of monolithic epoxy samples are shown in Figure 18. The location of fracture in tensile specimens is different and away from the mid of the gage length. This difference in location of fracture can be attributed to the topographical features. The notches caused high localized stress concentration and fracture took place at plane with maximum stress concentration. In fracture toughness and Charpy impact toughness specimens, fracture took place from the notch tip in all cases. It indicates that stress concentration effect caused by surface roughness is very low with respect to stress concentration caused by the main notch.
The dynamic mechanical properties are shown in Figure 19. The treatment with abrasive papers has influenced dynamic mechanical properties of monolithic epoxy samples. The storage modulus (Figure 19(a)) of samples treated with velvet cloth showed marginal influence on storage modulus. It can be attributed to very less abrasion caused by velvet cloth. The sample treated with abrasive paper 1200P showed an increase in storagemodulus. It may be attributed to removal of any notches on the surface and any increase in the degree of crosslinking due to thermal stresses induced by the frictional forces. The storage moduli of samples treated with abrasive papers 320P and 60P slightly reduced. It may be attributed to surface notches caused by abrasive papers which lowered both Young’s and flexural moduli. A similar trend was observed in case of other mechanical properties (Figure 14). The loss modulus (Figure 19(b)) of samples treated with velvet cloth and abrasive paper 1200P decreased while of samples treated with abrasive papers 320P and 60P increased. It can be attributed to variation in stiffness of samples as shown in Figure 17 which is mainly stemming from surface notches. The samples treated with velvet cloth and abrasive paper 1200P showed a decrease in loss factor (Tanδ) while those treated with abrasive papers 320P and 60P showed an increase in loss factor. Apart from variation in loss factor, a bulge around 110˚C may be observed. It could possibly be coming from crosslinking or any phase transformation. One might suggest that observed variation in mechanical properties is coming from this possible phase transformation. However, a counter-argument is that this bulge is present in as-cast samples as well. In addition, the mechanical properties were tested at room temperature and temperature of 110˚C is far greater than the testing temperature (20˚C - 30˚C).
The topographical features influenced the Tg as well (Figure 19(d)). The Tg was taken as the peak value of Tanδ. An increase in Tg may be attributed to decrease in loss modulus due to surface notches produced by abrasive papers 320P and 60P, and increase in storage modulus due to removal of surface notches by velvet cloth and abrasive paper 1200P. Figure 19(d) also shows variation in storage modulus, loss modulus, and Tanδ cor-

Figure 17. Flex. Stress vs Flex. Strain curves of produced specimens.

Figure 18. Optical images of broken monolithic epoxy samples. Tensile specimens: (a) as-cast, treated with (b) velvet cloth, (c) 1200P, (d) 320P, and (e) 60P. Flexural specimens: (f) as-cast, treated with (g) velvet cloth, (h) 1200P, (i) 320P, and (j) 60P. Charpy impact toughness specimens: (k) as-cast, treated with (l) velvet cloth, (m) 1200P, (n) 320P, and (o) 60P.

Figure 19. Dynamic mechanical properties: (a) storage modulus, (b) loss modulus, (c) loss factor (Tanδ), and (d) glass transition temperature (Tg), storage modulus, loss modulus, and Tanδ values corresponding to Tg.
responding to Tg. The best combination of mechanical and dynamic mechanical properties is observed when the samples were treated with the abrasive paper 1200P.
The smooth surfaces are necessary in sliding contact. When the surfaces contain high roughness and are slid against each other, wear takes place. The pointed debris formed as a result of wear, if do not find a place to escape, may cause crater in the surface. The crater may act as high stress concentration site due to notch effect. This stress concentration may significantly deteriorate mechanical properties of the bulk material. This effect may be further pronounced in case of brittle polymers, such as epoxy, as there are no intrinsic mechanisms available to stop the crack advancement [11] . During sliding contact, thermal stresses are produced which can give rise to peculiar topographical features. In case of polymers, the thermal stresses may influence the degree of cross-linking. This altered degree of crosslinking at the surface may influence the overall mechanical properties of polymers [11] . In general, the mechanical properties improve with increasing crosslinking. However, it was shown that fracture toughness decreases with increasing crosslinking [32] .
The SEM images of fractured tensile specimens of as-cast monolithic epoxy are shown in Figures 20(a)-(c). Nearly flat surface was obtained with bamboo-like pattern which is typical brittle fracture pattern of monolithic epoxy [33] . A roughly similar but coarser pattern was observed in case of samples treated with velvet cloth Figures 20(d)-(f). The coarser fractured surface and increase in strength indicate that surface notches were partially removed by velvet cloth which was corroborated by surface profile (Figure 11(f)). It can be observed that the ravines formed are nearly parallel. However, in samples treated with abrasive paper 1200P (Figures 20(g)-(i)), not only coarser topography was observed, but also serrations in different orientation were observed within the ravines (Figure 20(h)). In the samples treated with abrasive paper 320P (Figures 20(j)-(l)), the fracture pattern is a combination of those observed in case of as-cast samples and the samples treated with abrasive paper 1200P. The fractured surface was partially rough and partially coarse with serrations in the ravines. It may be attributed to size, shape, and orientation of surface notches produced by abrasive paper.
The influence of topography was clearer in samples treated with abrasive paper 60P (Figures 20(m)-(o)). The fractured surface can be divided into three regions: 1) flat surface as observed in case of as-cast samples and

Figure 20. Fractography of monolithic epoxy samples: (a)-(c) as-cast, treated with: (d)-(f) velvet cloth, (g)-(i) 1200P, (j)-(l) 320P, (m)-(o) 60P, and (p)-(r) as-cast epoxy samples.
those treated with velvet cloth; 2) serrated region as observed in samples treated with abrasive paper 1200P; 3) coarse topography as observed in case of samples treated with abrasive paper 320P. As the abrasive paper 60P had wide size distribution with both pointed and angular edges, therefore it produced notches on the sample surface of various size, shape, and orientation which led to the formation of fracture pattern with disparate features.
Apart from topography, the porosity can also influence fracture behavior as shown in Figures 20(p)-(r). The images were taken from next to the edge of the as-cast monolithic epoxy sample. A very fine porosity can be observed (Figure 20(r)) which produced a kind of crater on the surface. It can further be observed that the porosity is concentrated with pores of varying sizes. The stress concentration is inevitable around the porosity. Therefore, this porous region acted as the epicenter of fracture and fracture lines disseminated in all directions forming an octopus-like fracture pattern. Therefore, it can be concluded that not only porosity deteriorated mechanical properties, but it also produces a specific fracture pattern which can be called as “octopus-like” fracture pattern caused by porosity. The fracture pattern caused by the porosity extends in all directions. Therefore, it can be more deleterious than surface notch which produces stress concentration along the axis of notch tip. In addition, the fracture lines emanating from the pores may accomplice the innate cracks and may expedite the fracture process.
Until now the fracture patterns were correlated with the topographical features of the samples. However, Figures 20(p)-(r) allude to another reason for observed difference in fracture pattern and mechanical properties, i.e. size and distribution of porosity. Because of lighter than epoxy, air bubbles and other volatiles move towards surface to get out of the bulk. However, if bubbles either do not have enough pressure to push epoxy away or the epoxy cures before the escape of air bubbles, the bubbles and volatiles are entrapped within the bulk. If this explanation is true, then it should also be true that air bubbles and volatiles should be concentrated in regions closer to the top surface of the sample exposed to air. In that case, treating the samples with fine abrasive papers may remove bubble-concentrated regions. A similar method is applied in metals and alloys. For example, forged and cast steels are machined to remove oxides, scale, and to achieve desired surface finish. Due to the removal of defect-concentrated regions, the overall stress concentration factor in the samples should decrease which should cause an improvement in the mechanical properties. The segregation of porosity on the sides of the polymer samples is in agreement with the literature [34] . Warrier et al. introduced CNTs in the glass fiber-epoxy system in three ways: 1) they added CNTs in the epoxy matrix; 2) in the sizing formulation of glass fibers; 3) combination of the two methods [34] . They produced nanocomposite laminate sheets using vacuum bagging. The voids were present at the borders of the sheet, probably because of entrapped air. The sheets containing CNTs had more voids at borders than that without CNTs. In that case, removing the material from the surface up to a few microns can be helpful in improving the mechanical properties of the samples.
4. Conclusion
The monolithic epoxy samples were treated with abrasive papers and influence of topographical features was studied on mechanical properties, dynamic mechanical properties, and fracture mode. The waviness (Wa) of as-cast monolithic epoxy samples was 1.44 µm. By treating with velvet cloth, the Wa value decreased to 0.3 µm. The Wa value of monolithic epoxy samples treated with abrasive paper 1200P increased to 2.37 µm. The abrasive papers 320P and 60P further increased the Wa values to 5.68 µm and 7.13 µm, respectively. The Ra value of as-cast monolithic epoxy samples was 0.87 µm. By treating with velvet cloth, the Ra value decreased to 0.70 µm. The Ra value of monolithic epoxy samples treated with abrasive paper 1200P increased to 1.26 µm. The abrasive papers 320P and 60P further increased the Ra values to 2.84 µm and 5.78 µm, respectively. The Rq value of as-cast monolithic epoxy samples was 1.0 µm. By treating with velvet cloth, the Rq value decreased to 0.88 µm. The Rq value of monolithic epoxy samples treated with abrasive paper 1200P increased to 2.67 µm. The abrasive papers 320P and 60P further increased the Rq values to 4.12 µm and 7.44 µm, respectively. The Rz of as-cast monolithic epoxy samples was 13.93 µm. By treating with velvet cloth, the Rz value significantly decreased to 2.28 µm. The Rz value of monolithic epoxy sample treated with abrasive paper 1200P was 4.85 µm that was also lower than that of as-cast monolithic epoxy samples. However, Rz values significantly increased by treating with abrasive papers 320P and 60P and became 20.32 µm and 39.32 µm, respectively. It was interesting to note that although Ra, Wa, and Rq, all increased by treating the monolithic epoxy samples with abrasive paper 1200P, however, Rz decreased by abrasive paper 1200P. It was observed that as-cast samples had surface roughness which was reduced by treatment with velvet cloth and abrasive paper 1200P and increased by abrasive papers 320P and 60P. The maximum improvement in mechanical properties was observed when samples were treated with abrasive paper 1200P. The mechanical properties were a function of topographical features and also on the orientation of roughness with respect to loading axis. It can also be concluded that the surface roughness beyond ±20 µm has detrimental effect on tensile strength and modulus of monolithic epoxy samples. Accordingly, the surface roughness below ±20 µm was benign for tensile properties of monolithic epoxy samples. It was further observed that tensile properties were more sensitive to topography than flexural properties.
Acknowledgements
The authors would like to thank the Department of Mechanical and Construction Engineering, Northumbria University, UK for the provision of research facilities, without which the analysis of relevant data was not possible.
Cite this paper
Rasheed Atif,Fawad Inam, (2016) Influence of Macro-Topography on Damage Tolerance and Fracture Toughness of Monolithic Epoxy for Tribological Applications. World Journal of Engineering and Technology,04,335-360. doi: 10.4236/wjet.2016.42034
References
- 1. Rider, A.N. and Arnott, D.R. (2001) The Influence of Adherend Topography on the Fracture Toughness of Aluminium-Epoxy Adhesive Joints in Humid Environments. The Journal of Adhesion, 75, 203-228.
http://dx.doi.org/10.1080/00218460108029601 - 2. Schuler, M., Kunzler, T.P., De Wild, M., Sprecher, C.M., Trentin, D., Brunette, D.M., et al. (2009) Fabrication of TiO2-Coated Epoxy Replicas with Identical Dual-Type Surface Topographies Used in Cell Culture Assays. Journal of Biomedical Materials Research Part A, 88, 12-22.
http://dx.doi.org/10.1002/jbm.a.31720 - 3. Lam, C.K. and Lau, K.T. (2007) Tribological Behavior of Nanoclay/Epoxy Composites. Materials Letters, 61, 3863-3866.
http://dx.doi.org/10.1016/j.matlet.2006.12.078 - 4. Yu, S., Hu, H., Ma, J. and Yin, J. (2008) Tribological Properties of Epoxy/Rubber Nanocomposites. Tribology Inter-national, 41, 1205-1211.
http://dx.doi.org/10.1016/j.triboint.2008.03.001 - 5. Xia, S., Liu, Y., Pei, F., Zhang, L., Gao, Q., Zou, W., et al. (2015) Identical Steady Tribological Performance of Graphene-Oxide-Strengthened Polyurethane/Epoxy Interpenetrating Polymer Networks Derived from Graphene Nanosheet. Polymer (Guildf), 64, 62-68.
http://dx.doi.org/10.1016/j.polymer.2015.03.036 - 6. Siegel, R., Hu, E. and Roco, M. Editors. (1999) Nanostructure Science and Technology. A Worldwide Study, Prepared under the Guidance of the IWGN, NSTC, WTEC.
- 7. Pan, G., Guo, Q., Ding, J., Zhang, W. and Wang, X. (2010) Tribological Behaviors of Graphite/Epoxy Two-Phase Composite Coatings. Tribology International, 43, 1318-1325.
http://dx.doi.org/10.1016/j.triboint.2009.12.068 - 8. Brostow, W., Dutta, M. and Rusek, P. (2010) Modified Epoxy Coatings on Mild Steel, Tribology and Surface Energy. European Polymer Journal, 46, 2181-2189.
http://dx.doi.org/10.1016/j.eurpolymj.2010.08.006 - 9. Zhang, W.H. and Hsieh, J.H. (2000) Tribological Behavior of TiN and CrN Coatings Sliding against an Epoxy Molding Compound. Surface and Coatings Technology, 130, 240-247.
http://dx.doi.org/10.1016/S0257-8972(00)00709-X - 10. Chang, L., Zhang, Z., Ye, L. and Friedrich, K. (2007) Tribological Properties of Epoxy Nanocomposites. III. Characteristics of Transfer Films. Wear, 262, 699-706.
http://dx.doi.org/10.1016/j.wear.2006.08.002 - 11. Lackner, J.M., Waldhauser, W., Ganser, C., Teichert, C., Kot, M. and Major, L. (2014) Mechanisms of Topography Formation of Magnetron-Sputtered Chromium-Based Coatings on Epoxy Polymer Composites. Surface and Coatings Technology, 241, 80-85.
http://dx.doi.org/10.1016/j.surfcoat.2013.07.040 - 12. Cotell, C.M., Sprague, J.A. and Smidth, F.A.J. Editors. (1994) ASM Handbook, Vol. 5: Surface Engineering. ASM International, Detroit.
- 13. Atif, R., Wei, J., Shyha, I. and Inam, F. (2016) Use of Morphological Features of Carbonaceous Materials for Improved Mechanical Properties of Epoxy Nanocomposites. RSC Advances, 6, 1351-1359.
http://dx.doi.org/10.1039/C5RA24039E - 14. Wei, J., Atif, R., Vo, T. and Inam, F. (2015) Graphene Nanoplatelets in Epoxy System, Dispersion, Reaggregation, and Mechanical Properties of Nanocomposites. Journal of Nanomaterials, 2015, Article ID: 561742.
http://dx.doi.org/10.1155/2015/561742 - 15. Saharudin, M.S., Atif, R., Shyha, I. and Inam, F. (2016) The Degradation of Mechanical Properties in Polymer Nano-Composites Exposed to Liquid Media—A Review. RSC Advances, 6, 1076-1089.
http://dx.doi.org/10.1039/C5RA22620A - 16. Miracle, D.B. and Donaldson, S.L. Editors. (2001) ASM Handbook, Vol. 21: Composites. ASM International, Detroit.
- 17. Gao, S.L., Mäder, E. and Zhandarov, S.F. (2004) Carbon Fibers and Composites with Epoxy Resins, Topography, Fractography and Interphases. Carbon (NY), 42, 515-529.
http://dx.doi.org/10.1016/j.carbon.2003.12.085 - 18. Karger-Kocsis, J., Mahmood, H. and Pegoretti, A. (2015) Recent Advances in Fiber/Matrix Interphase Engineering for Polymer Composites. Progress in Materials Science, 73, 1-43.
http://dx.doi.org/10.1016/j.pmatsci.2015.02.003 - 19. Moon, S.I. and Jang, J. (1999) Mechanical Interlocking and Wetting at the Interface between Argon Plasma Treated UHMPE Fiber and Vinylester Resin. Journal of Materials Science, 34, 4219-4224.
http://dx.doi.org/10.1023/A:1004642500738 - 20. Nardin, M. and Ward, I.M. (1987) Influence of Surface Treatment on Adhesion of Polyethylene Fibres. Materials Science and Technology, 3, 814-826.
http://dx.doi.org/10.1179/mst.1987.3.10.814 - 21. Ladizesky, N.H. and Ward, I.M. (1989) The Adhesion Behaviour of High Modulus Polyethylene Fibres Following Plasma and Chemical Treatment. Journal of Materials Science, 24, 3763-3773.
http://dx.doi.org/10.1007/BF02385768 - 22. Woods, D.W. and Ward, I.M. (1993) Study of the Oxygen Treatment of High-Modulus Polyethylene Fibres. Surface and Interface Analysis, 20, 385-392.
http://dx.doi.org/10.1002/sia.740200510 - 23. Tissington, B., Pollard, G. and Ward, I.M. (1991) A Study of the Influence of Fibre/Resin Adhesion on the Mechanical Behaviour of Ultra-High-Modulus Polyethylene Fibre Composites. Journal of Materials Science, 26, 82-92.
http://dx.doi.org/10.1007/BF00576036 - 24. Engelke, R., Engelmann, G., Gruetzner, G., Heinrich, M., Kubenz, M. and Mischke, H. (2004) Complete 3D UV Microfabrication Technology on Strongly Sloping Topography Substrates Using Epoxy Photoresist SU-8. Microelectronic Engineering, 73-74, 456-462.
http://dx.doi.org/10.1016/S0167-9317(04)00193-5 - 25. Carlson, R.L., Kardomateas, G.A. and Craig, J.I. (2012) Mechanics of Failure Mechanisms in Structures. Springer, Berlin.
http://dx.doi.org/10.1007/978-94-007-4252-9 - 26. Pitler, R.K. and Langer, E.L. Editors. (1995) ASM Handbook, Vol. 16: Machining. ASM International, Detroit.
- 27. Blau, P.J. Editor. (2001) ASM Handbook, Vol. 18: Friction, Lubrication, and Wear Technology. ASM International, Detroit
- 28. Rickerby Matthews, A.D.S. (1991) Advanced Surface Coatings: A Handbook of Surface Engineering. Chapman and Hall, Published in the USA.
- 29. Jiang, C., Zhu, J., Han, J. and Cao, W. (2014) The Surface Topography, Structural and Mechanical Properties of Ge1 – xCx Films Prepared by Magnetron Co-Sputtering. Journal of Non-Crystalline Solids, 383, 126-130.
http://dx.doi.org/10.1016/j.jnoncrysol.2013.04.011 - 30. Guo, L., Ding, J., Yang, J., Cheng, G. and Ling, Z. (2011) Effects of High Hydrogen Dilution Ratio on Surface Topography and Mechanical Properties of Hydrogenated Nanocrystalline Silicon Thin Films. Thin Solid Films, 519, 6039-6043.
http://dx.doi.org/10.1016/j.tsf.2011.04.117 - 31. Berger, M.A. and McCullough, R.L. (1985) Characterization and Analysis of the Electrical Properties of a Metal-Filled Polymer. Composites Science and Technology, 22, 81-106.
http://dx.doi.org/10.1016/0266-3538(85)90078-8 - 32. Wang, X., Jin, J. and Song, M. (2013) An Investigation of the Mechanism of Graphene Toughening Epoxy. Carbon (NY), 65, 324-333.
http://dx.doi.org/10.1016/j.carbon.2013.08.032 - 33. Tang, L.-C., Wan, Y.-J., Yan, D., Pei, Y.-B., Zhao, L., Li, Y.-B., et al. (2013) The Effect of Graphene Dispersion on the Mechanical Properties of Graphene/Epoxy Composites. Carbon (NY), 60, 16-27.
http://dx.doi.org/10.1016/j.carbon.2013.03.050 - 34. Warrier, A., Godara, A., Rochez, O., Mezzo, L., Luizi, F., Gorbatikh, L., et al. (2010) The Effect of Adding Carbon Nanotubes to Glass/Epoxy Composites in the Fibre Sizing and/or the Matrix. Composites Part A: Applied Science and Manufacturing, 41, 532-538.
http://dx.doi.org/10.1016/j.compositesa.2010.01.001
NOTES

*Corresponding author.