Theoretical Economics Letters
Vol.07 No.05(2017), Article ID:78350,15 pages
10.4236/tel.2017.75094
Speed Limit and Fatalities in the U.S.: Implication for Transportation Policy
Kashif Zaheer Malik1, Ammar Aftab2
1Department of Economics, Lahore University of Management Sciences, Lahore, Pakistan
2Department of Health Policy and Management, Texas A & M University, College Station, TX, USA

Copyright © 2017 by authors and Scientific Research Publishing Inc.
This work is licensed under the Creative Commons Attribution International License (CC BY 4.0).
http://creativecommons.org/licenses/by/4.0/


Received: January 18, 2017; Accepted: August 8, 2017; Published: August 11, 2017
ABSTRACT
The paper attempts to investigate into the prevalent notion that higher speed limits lead to increase in fatalities using Vector Auto Regressive (VAR) model for bivariate time series. The paper used Fatality Analysis Reporting System (FARS) time series data set from 1975 to 2010. The paper is the first one to make use of Vector Autoregressive Model (VAR) on this time series dataset to study the potential dual causality between speed and fatalities. The results of the paper partially support the causation between speed limit and fatalities, thus, complementing the results of the existing literature relating speed limits and fatalities such as “Influence of speed limits on roadway safety in Indiana” [1] , “Driver Speed Behavior on US Streets” [2] , and “Speed Limit Laws in America: Economics, Politics and Geography” [3] . However, instead of determining causation through various regression models, the paper establishes the causality by inducing a speed shock and analyses its impact upon fatalities. The paper concludes that in states with higher per capita automobiles and limited public transportation facilities such as Georgia, a sudden increase in speed limit has an immediate and higher impact upon accident related deaths, whereas, in states with lower per capita automobiles and higher public transportation services such as New York, the sudden increase of speed limit has minimal impact on accident related fatalities.
Keywords:
Transportation, Time-Series, SVAR, Speed Limit, Accidents

1. Introduction
In the United States, speed limit laws date back to 1901 and they have traditionally been under the jurisdiction of the states. On rural interstates, speed limits ranged between 65 mph to 75 mph, with the maximum limit set as 70 mph whereas, in urban regions, majority of the states had set up the speed limit of 55 mph. As a result of oil shortages in 1973, Congress directed the Department of Transportation to establish national maximum speed limit of 55 miles per hour and withheld state highway funds from the states. However, in 1987, U.S Congress permitted the states to increase the maximum speed limit on rural highways to 65 miles per hour. The National Highway System Designation Act of 1995 (4) deregulated the setting of speed limits to the states. Consequently, majority of the states chose to increase the speed limits.
Recently, the trend towards higher speed limits on highways has been increasing. Currently, the speed limit in twenty four states has been set at 70 mph. While, ten states including Colorado and Washington have set the maximum speed limit at 75 miles per hour whereas, in some of the states such as Texas and Nevada, some of the sections of interstate highways have set up speed limit of 80 mph.
Ever since the completion of interstate highway network, the number of accident related deaths in the United States has mostly remained high, peaking at approximately 54,000 in 1972 [4] .
Although, it is reasonable to assume that higher speed limits would cause a rise in fatalities, the drop-in fatalities despite states increasing speed limits from 2008 to 2015 presents a contradictory picture. The improvements in road infrastructure and better and safer model of automobiles are some of the reasons why states’ policy makers justify higher speed limits [5] . Proponents of higher speed limits believe that other factors such as drivers’ behavior, traffic laws, weather conditions vehicle type etc. are primary causes of accident related deaths rather than the speed itself.
Although, a lot of research has been conducted to identify the fundamental cause of accident related fatalities, most of the papers rely on simple Ordinary Least Squares regression model. This paper is the first one to utilize Vector Autoregressive Model (VAR) to address the potential causality between speed and accident related deaths in the nine states of United States of America.
Introduction is the first section of the paper. The following section looks into the rich amount of literature identifying relationship between speed limits and fatalities. The third section discusses the methodology of Vector Auto-Regressive (VAR) model including identification of restrictions and specification of the model. The fourth and last sections present the results in the form of Impulse Response Functions and conclusion respectively.
2. Literature Review
A rich amount of research is available linking speed limit and fatal accidents. The Insurance Institute of Highway Safety has summarized the effects of changing speed limits and number of fatalities over time in the United States. In 1987, as the states began to increase their speed limits from 55 to 65 miles per hour, deaths on rural interstates increased from 25 to 30 percent [6] . In 1989, approximately two-thirds of the total accident related deaths were attributed to over speeding. Later in 1999, the effects of the 1995 repeal of the national maximum speed limit indicated continuation of this trend. The Institute estimated a 15 percent increase in deaths on both interstates as well as highways in the states that had raised maximum speed bounds [6] . Later on, when the states set their own speed limits, a study in 2002, evaluated the impact of increased rural interstate speed limits by 5 or by 10 mph i.e. from 65 miles per hour to either 70 or 75 miles per hour. Fatalities increased by 38 percent, which set up the speed limit to 75 mph whereas, accident related fatalities increased by 35 percent in states which set up the speed limit to 70 mph. Finally, the latest study of the institute examined long-term changes of speed limits in 41 states during 1993-2013. The results indicated that with the 5 miles per hour increase caused an 8 percent increase in fatality rates on interstates and freeways. In short, 33,000 additional accident related deaths would have been prevented if the speed limits of 1993 had been maintained [7] .
In addition, Jian Xu, Kara and Wang in their paper, “Modeling Crash and Fatality in Texas” [8] , points to speed limit as the main contributor to fatal crashes after controlling factors such as automobile failures, inspection of motor vehicles, consumption of alcohol and the minimum legal drinking age. The model used cross-sectional regression and concluded that the coefficient associated with the vehicular speed variable is statistically significant implying that raising the average speed of vehicles would significantly increase fatality rates.
However, a number of studies have found insensitive relationship between speed and fatalities. Nataliya Malyshikna and Fred Mannering [9] conducted a study to assess the impact of increased speed limit on severities of injuries in accidents in the state of Indiana. The paper used multinomial, mixed and nested logit models. All the models yielded similar result i.e. the effect of a surge in speed limit was deemed to be insignificant on inter-state highways. The impact was significant but minimal on non-interstate highways.
Furthermore, Jianming Ma and Kara M. Kockelman researched the effect of changing speed limits on highways in Southern California utilizing the “Traffic Accident Surveillance and Analysis System” database, which included 744 crashes, out of which 55 proved to be fatal. After controlling for traffic and weather conditions ordinary least squares regression model yielded statistically insignificant impact of an increase in speed limit upon accident related fatalities [10] .
Moreover, Young-Jun Kweon and Kara Kockleman conducted an empirical study on safety effects of changing speed limit on high-speed roads, utilizing traffic detector and highway safety information system data gathered from 1993 to 1996. The paper used sequential modeling approach: average speed and speed variance models. The model yielded the unresponsiveness of fatality rates to speed limit changes. Hence, the paper did not cite speed as the main contributor to the fatal accidents and concluded that further research was needed to firmly establish the causality between speed limit and accident related fatalities [11] .
Other than that, using a paired-comparison approach and an ordered probit model, Renski, Khattak and Forrest Council analyzed the impact of speed limit on the severe occupant injuries in a vehicular crash on interstate highways in North Carolina. The findings suggest that increase in speed limit by 5 mph i.e. from 55 to 60 mph and from 55 to 65 mph augmented the likelihood of sustaining minor injuries; however, a further increase of 5 mph i.e. 65 to 70 mph did not affect crash injury severity significantly [12] .
In summary, a number of studies assessed the effect of speed limit on fatal accidents. And these studies report both sensitive and insensitive relationship between speed limits and fatalities. The diverse findings can be attributed to different methodologies used and the speed impact of change in speed limit upon accidents is still debated amongst policy makers, economists and researchers.
While inferences can be drawn and significance levels can be tested, this paper takes a leap forward and tests the use of vector auto regressive model in analyzing the effect of positive speed shock on fatalities. The highlight however, is that this paper uses the time series data from FARS, and attempts to treat speed limits and fatalities as endogenous variables by employing a VAR model. This methodology makes it easier to study interdependencies of both variables over time.
3. Methodology
3.1. Introduction to VAR Model
VAR is a general framework used to describe the dynamic relationship between stationary variables. The VAR model is used to capture linear interdependencies among multivariate time series. All variables in a VAR are treated symmetrically in a structural sense; the structure is that each variable is a linear function of lags values of itself and present and lags of the other variables.
A VAR is an n-equation, n-variable model in which each variable is in turn explained by its own lagged values, plus (current) and past values of the remaining n-1 variables. In other words, Vector Autoregressive Model is used whenever it is suspected that all the involved variables (two in this case); are simultaneously affected by external shocks. In econometric terms, the variables are treated as endogenous and the shocks given to the variables are treated as exogenous.
VAR models have become increasingly popular in recent decades especially for describing the dynamic behavior of economic and financial variables for forecasting. The models are estimated to provide empirical evidence on the response of relevant variables to various exogenous shocks. This simple framework provides a systematic way to study the impact of external (exogenous) shocks on the variables included in the model over the period of time. The casual relationships are usually summarized with impulse response functions and historical variance decompositions i.e. how much of the variation in the variable is being attributable to a particular exogenous shock. In addition, VARs also provides a coherent and credible approach to data description, forecasting, structural inference and policy analysis.
3.2. Data Description
The paper used Fatality Analysis Reporting System (FARS) time series data set for forty-eight continental US states and District of Columbia, from 1975 to 2010. FARS is a census of fatal motor vehicle crashes with a set of data files documenting all qualifying fatalities that occurred within the 50 States, the District of Columbia, and Puerto Rico. The data has been compiled by the U.S. Department of Transportation, National Highway Traffic Safety Administration (NHTSA) and The National Center for Statistics and Analysis Washington D.C.
Given the daily frequency of the dataset, it was collapsed to monthly dataset on the basis of unique ID of the accident occurred. Nine States representing major regions of the United States were specifically chosen for the analysis.
Two primary variables were selected to study the possible interdependencies i.e. “Speed Limit” and “Fatalities”. Speed Limit is defined as the recorded speed of the car during the accident. It ranges between 45 and 65 miles per hour. Whereas, “Fatalities” is defined as the number of people killed during the accident.
Estimation of VAR model requires that each variable entered in the VAR model must be stationary. The Series that are non-stationary must be transformed accordingly prior to the estimation of VAR model. A stationary time series is one that has meaningful sample statistics, i.e. constant mean and variance over time.
To check for stationarity, unit root test was computed. Afterwards, to correct for serial correlation in errors, Augmented Dickey Fuller Test (ADF) was run for each of the time series. The data from nine states produced a Durbin-Watson statistic of 1.9 implying no serial correlation. Furthermore, Augmented Dickey Fuller (ADF) with 1 lag produced the result that FTL (Fatalities) is I (0) stationary. SPL (Speed Limit) is also I (0) stationary.
To address the issue of co-integration, Engle-Granger Co-Integration Test was also conducted and the values obtained from all the nine states was above −3.92 (Higher than critical value), implying no co-integration. In order to determine the number of lags in the model, Akaike Information Criterion (AIC) and Schwarz Bayesian Criteria (SBC) is used. Both criterion recommended lag length up to 5 lags.
3.3. Identification of VAR Model
The variables Fatalities (FTL) and speed limits (SPL) are said to be endogenous. Fatalities are affected by current and past values of speed limits and lag values of fatalities. Similarly speed limits are affected by current and past values of fatalities and lag values of fatalities. In addition is shock of fatalities and is the shock of speed respectively.
The first restriction that has been used is universal assumption in VAR that shocks are orthogonal (uncorrelated). This restriction is particularly important because if the shocks are correlated, it does not make sense to look at the unit impulse since both shocks come at the same time. Hence, to obtain impulse response functions, two separate shocks were generated. Fatalities shock includes an unexpected sudden increase in accident related fatalities.
Meanwhile, a speed shock includes any exogenous unexpected increase in the state-imposed speed limit. It must be noted that the shock is peculiar to nine selected states. For example: a speed shock in the state of California refers to an unexpected and exogenous increase in inter-state speed limit in the California only.
3.4. Identifying Restrictions
In the short-run, it is expected that accident related fatalities will not be affected by a speed shock. According to United States Department of Transportation, it usually takes 3 - 4 lags for the people to adjust to the newly defined speed limits. According to “The Transport Institute, University of Michigan”, it took 15 months for the fatalities to get affected primarily due to increase in speed limit from 55 to 65 miles per hour. The restriction is further complemented by the adaptability lag issue. As a joint research paper produced by Turner-Fair Bank Highway Research Centre and Federal Highway Administration, in the short- term, within a span of 1 - 2 lags, raising speed limit by 5, 10, 15 and 20 miles per hour had little or no significant impact upon the fatal accidents [13] .
Fatalities is also affected by non-speed shock such as drivers’ behavior, traffic controls, safety laws and other non-speed factors, however this is outside the scope of this study.
In the long run, both shocks are allowed to have an impact upon accident fatalities and upon the speed itself. As it has been established by number of research papers that in the long-run, speed limits effect fatalities, hence, there are no restrictions imposed on model in the long-run.
4. Results
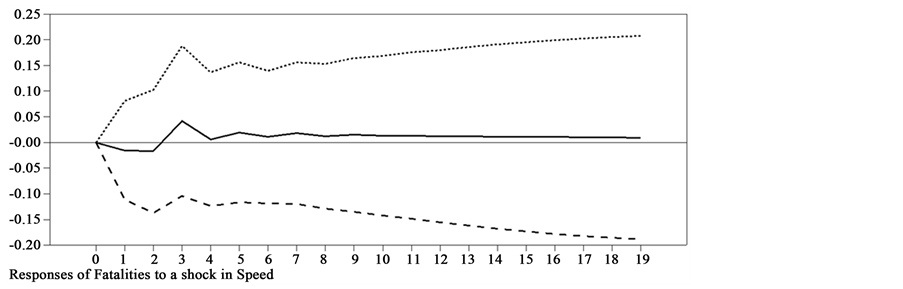
This section discusses results. Results are reported in terms of impulse response functions of an exogenous speed shock to speed limit and analyze its effect on fatalities in nine states divided in four regions of United States of America.
4.1. Impulse Responses to Average Speed―Northeast (New York, Pennsylvania, Massachusetts)
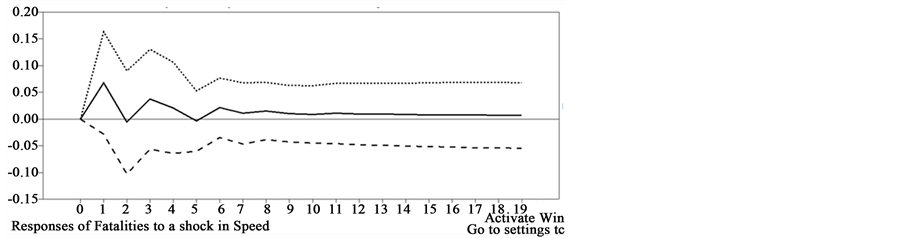
4.1.1. New York
Impulse Response Function―New York

The Impulse Response Function of response to increasing speed limit in the state of New York has marginal impact upon the accident fatalities. Because of a one standard deviation positive speed shock, the accident fatalities increase by less than 5%.1 The increase in fatalities due to a speed shock is at most 1% over the following lags (months), which subsides later. The result shows that speed limit is not the main cause of fatal accidents in New York. This further implies that there are other significant factors besides speed limit, contributing to the accident-related fatalities in the state. The result complement the study conducted by “New York State Department of Motor Vehicle’s Accidents”, which has complied annual reports on the causes of accidents in the state. In 2014, 78.5% of the total 254,000 crashes were caused by human factors which included road ragging, failure to yield to R.O.W i.e. right of way, driver inattention/dis- traction and following too closely. Out of which, 17% were caused by tailgating whereas around 15% were caused by failure of the driver to provide the right of way. Not complying to the traffic rules caused more than 12% of the human factor related accidents. Excessive speeding caused only10.7% of the human related causalities [14] . Other factors contributing to the accidents in the State were drivers’ intoxication, vehicular factors and environmental factors such as animals’ crossing. The primary reason for speed not contributing highly to accidents could be due to a well-established urban transit system in the state. As compared to the other states, New York has one of the lowest vehicles per capita in the country; 540 vehicles per 1000 people, limiting the ability of a speed shock to contribute significantly to accident-related deaths.
4.1.2. Pennsylvania
Impulse Response Function―Pennsylvania
Located in the North East of the country, Pennsylvania has one of the largest mass transit systems, comprising of bus service, light rail, subway and elevated rail, known as Southeastern Pennsylvania Transportation Authority (SEPTA). With an annual average ridership of 100 million passengers, it is the sixth most utilized transit system in America.
Moreover, per Pennsylvania Crash Facts and Statistics Report, drunk driving is widespread in the state and is the leading cause of fatal accidents. In 2014, nearly 45,000 people were arrested for driving under influence. Approximately, a third of the fatal accidents were attributable to drunk driving.
Other than having SEPTA and widespread drunk driving behavior, distracted driving was the second major contributor to the fatal crashes occurred in the state. In Monroe country, incidents of distracted driving increased over 200 percent during the past three years [15] .
The factors imply that an increase in speed limit would have limited or no significant impact upon the fatalities in Pennsylvania. The hypothesis is complimented by the Impulse Response Function. A speed shock only lasts for a month before quickly subsiding within 2 lags. The initial increase could be due to the time taken by the commuters to adjust to the new speed limit.
4.1.3. Massachusetts
Impulse Response Function―Massachusetts
Despite having one of the highest vehicles per capita in the country, i.e. 840 per 1000 and having mass transit facilities such as Boston Metro, the impulse response function implies that no big variation in the fatalities is being explained by speed shock. The results, however, can be confirmed by Massachusetts Department of Transportation report which cites failure to wear a seatbelt, use of marijuana, bad weather and seizures as the most common reasons for accidents. The other possible reason for speed not being a major contributor to accidents could be the quality of road network of the state [16] . Per the American Society of Civil Engineers, the state of Massachusetts is ranked as having one of the best road infrastructures in the country, which is evident by the one of the lowest fatal crash rates in the country i.e. 4.79 deaths per 100,000 people.
Apart from other significant factors and having quality road network, the state has one of the strict traffic safety and speed enforcement laws, limiting the potential of overspeeding and hence speed-related fatal crashes [17] . Therefore, speed is not the primary determinant of accident related fatalities.
4.2. Impulse Responses to Average Speed―Midwest (Illinois, Michigan)
4.2.1. Illinois
Impulse Response Function―Illinois
With 7.22 deaths per 100,000 people, Illinois has one of the lowest accident related deaths in the country. Having access to mass transit system and having low per capita automobiles than states such as Georgia and California i.e. 720, the impact of speed on accident related fatalities is expected to be of insignificance, as demonstrated by the impulse response function. The trend of the impulse response function compliments the study conducted by the Illinois Department of Transportation, which cites distracted driving as one of the primary causes traffic accidents. Illinois, having the worst road infrastructure and with the relative weak traffic enforcement laws, over speeding is not the primary reason for accidents in the state. The report cites driver fatigue, failure to follow road safety laws and whether conditions as the main factors contributing to the fatal crashes (USDT). Thus, the Impulse response function confirms the results produced by Illinois Crash and Traffic Report [18] .
4.2.2. Michigan
Impulse Response Function―Michigan
Michigan has one of the highest rates of per capita automobiles in the country i.e. 870 cars per 1000 people, implying the lack of availability of mass transit facilities (Michigan Department of Transportation). The state has one of highly ranked and widespread road infrastructure in the country and hence it is expected that a sudden increase in the speed limit would have a higher impact upon the fatal accidents, owing to a high per capita automobiles and widespread road network [19] . However, per Michigan State Police, out of 297,023 crashes, 29,896 were attributable to over-speeding, whereas, 54,000 were attributable to disregard of traffic rules and careless driving. Other significant factors contributing to the fatal crashes in the state included making an improper turn, wrong lane use and driving under the influence of drugs, both legal and illegal [20] .
The fundamental reason for the speed shock to affect the fatalities only till a period of 1 lag or month can be understood by the significant reasons for fatal crashes in the state of Michigan. The quick subsiding of the impact of the speed shock supports the findings by Michigan Traffic Crash Facts and Michigan State Police that speed is not the primary determinant of vehicle crashes in the state.
4.3. Impulse Responses to Average Speed―South (Florida, Georgia)
4.3.1. Florida
Impulse Response Function―Florida
With 12.98 deaths per 100,000 populations and with 2262 vehicle related fatalities, the state of Florida tops the list of one of the deadliest regions for motorists, while the national average is 7.72 deaths per 100,000 people. Per Florida Traffic Engineering and Operations Office, drunk driving plays an important role in car related accidents, accounting for nearly 30% of the accident related fatalities. In 2010, out of 2262 fatal crashes, 660 were attributed to drunk driving.
As far as the role of speeding is concerned, the impact of an increased speed limit is highly marginal and insignificant upon the fatalities. The impact only begins after the third lag or month and quickly subsides within a month. The trend compliments the findings by Florida Department of Motor Vehicles that Florida already has one of the highest maximum speed limits in the country i.e. 70 miles per hour for rural and urban freeways as compared to 65 mph for rural and 40 mph for urban in New York and 60 mph for rural and 45 mph for urban in Michigan (NHTS). Therefore, any effect of increased speed limit is marginal [21] .
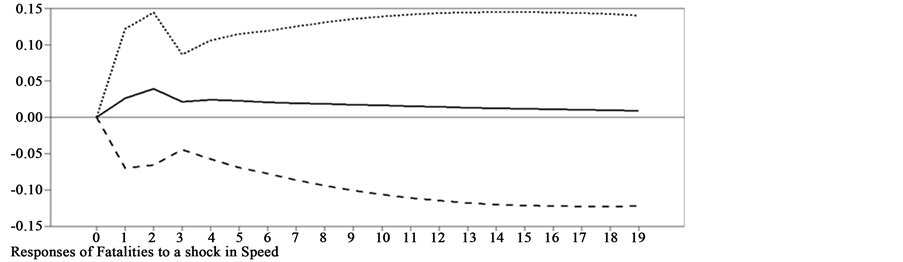
4.3.2. Georgia
Impulse Response Function―Georgia
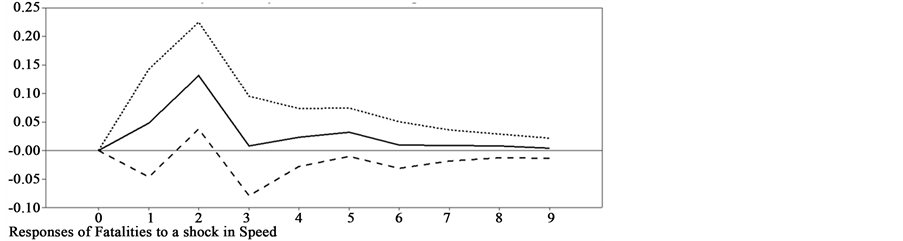
With 820 vehicles per 1000 people, coupled with a dense network of interstate high ways, Georgia is one of the transportation hubs of United States. Per Georgia Governor’s office of Highway Safety, in 2013, 22% of the fatal crashes occurred in the state were caused by over speeding. Thus, the role of speed can be expected to be of significance. As far as the impulse response function is concerned, a sudden increase in the speed limit in the state causes fatalities to increase by 5% within a lag or month and continues to increase in the second lag or month as well, reaching its peak at approximately 13%, implying a significant role of speed in accident-related fatalities in the state. The impact eventually subsides after 6 lags or months, longer than any other state involved in the analysis [22] .
Other factors contributing to accident fatalities are drunken driving, failure to comply with seatbelts and driving in the wrong lane. Moreover, Georgia has low compliance rate when it comes to following drivers’ safety practices like wearing seat belts, following speed limits, not texting while driving and, maintaining lanes therefore it tops the list when it comes to distracted and impaired driving.
4.4. Impulse Responses to Average Speed―West (Colorado, California)
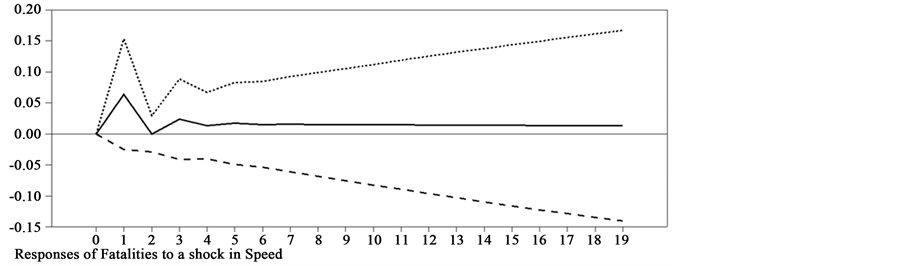
4.4.1. Colorado
Impulse Response Function―Colorado

With 340 automobiles per 1000 people, Colorado ranks the lowest amongst U.S states. However, the fatal accident rate is 8.87 per 100,000 people, slightly above the national average. Per Colorado Department of Transportation, the key determinant of fatal accidents in the state is inattentive driving, aggressive driving behavior and improper use of lanes. It did not cite over speeding as a significant factor contributing to fatalities. Hence, a limited impact of a speed shock on the fatalities can be expected [23] .
A sudden increase in speed limit causes fatalities to rise by approximately 5% and subsides quickly within one lag or a month. Speed related fatalities decline in the second month by approximately 10%. The declining trend can be explained by the behavior of commuters substituting private automobiles to mass transit facilities. Since, commuters expect an increase in congestion due to increased speed limit; they substitute to the transit facilities. Traffic congestion is the norm in Colorado. In 2007, the mass transit utilization in Boulder, Colorado Springs and Denver saved approximately 5 million hours in traffic stays. Also, in 2008, about 74 percent more Coloradans travelled through transit than in 1991. In areas, such as Denver, the number of commuter miles traveled via transit almost doubled between 1998 and 2008, implying an increase in transit ridership and hence, limiting or even decreasing speed related fatalities in the state (Division of Transit and Rail). Due to reasons, a speed shock does not have a long-lasting impact upon fatal accidents in the state of Colorado [24] .
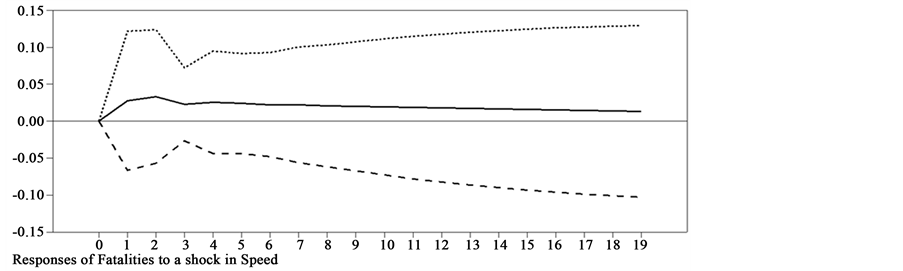
4.4.2. California
Impulse Response Function―California

In California, accident related fatalities after inducing a positive speed shock, tend to increase till the following three lags, reaching the peak at 7%. However, after the third lag, fatalities begin to decrease. The sudden increase in fatalities followed by a sharp dip compliments the yearly findings of California Office of Traffic Safety, which stated that it takes time for the drivers to adjust to the newly introduced speed limits in the state, usually about 2 months. The report also stated that driving under influence of drugs rather than excessive speeding is the primary reason for fatal car crashes in the state. In 2013, 32% of all the fatal crashes were attributable to the use of legal/illegal drugs by the driver [25] .
The initial increase in fatalities due to speed shock is also explained by the time it takes to disseminate information regarding the change in speeds. Per “National Highway Traffic Safety Administration”, historically, increases in speed limits have always been followed by sudden increases in fatalities in California at least in the short run i.e. up to 5 months. As more people become aware of the changed speed limit, they adjust their behaviors accordingly and hence the shock subsides in 5 months.
Over speeding is one of the primary causes of accidents in the state of California, but the impact of an increased speed limit becomes insignificant after 5 lags, thus, allowing other factors to explain the car crashes. Factors, other than drug impaired driving, which are attributable to fatal accidents in the state include improper turning, failure to obey traffic signs or signals and distracted driving.
5. Conclusions
The purpose of this research is to investigate the effect of positive speed shocks on fatalities in United States of America. Using identified Vector Auto-regressive model (VAR), and by giving positive speed shock to fatalities in various states, the study concludes that it varies a lot among different states. Broadly categorizing, the impact of an unexpected increase in the speed limit is immediate and higher in states such as Georgia, where the number of per capita automobiles is higher, mass transit facilities are limited while other factors such as driving under influence, failure to comply to traffic safety laws, whether conditions etc. do not play a significant role in fatal car crashes. In similar states, increasing the maximum speed limit does play a crucial role in fatal crashes. Alternatively, the impact of a speed shock is marginal in states such as Florida and New York, where per capita automobiles are lower than the national average, transit facilities are widespread and the road infrastructure is of high quality. Here, factors such as safety regulations, drunk driving, driving in the wrong lane etc. play a dominant role in fatal crashes. Thus, increasing the speed limit does not play a fundamental role in fatal crashes in these states.
The results of the model as demonstrated by the impulse response functions are corroborated by number of research findings, such as, Georgia’s Department of Transportation’s citing speed as the primary contributor to the fatalities in the state in the past decade. New York’s State Department of Transportation’s research also concluded drivers’ behavior as the main determinant of the accident related deaths in the region for the past two decades. However, in other states such as California, Colorado and Pennsylvania, the impact of a speed shock decreases for some lags and then increases until finally subsiding. In these states, a combination of speed as well as other factors such as distracted driving, failure to provide right of way, weather conditions etc. are contributors of fatal accidents.
The singularity that this paper provides is that it targets areas of negligence in all the nine particular states. It strictly clarifies each aspect to consider for every respective state. This paper would serve as an aide to the NHTSA and relevant authorities such as the U.S. Department for Transportation to aim at the root cause of fatal accidents in the listed states. Such directed measures would establish a cost saving structure in which valuable resources can be deployed to minimize aggregate accidents. At its best, the paper has analyzed nine of the representative states, the FARS dataset could be used in all autonomy to analyze the rest of the states. Hence, it can be concluded that further research is needed by controlling for other important factors such as drunk driving, safety features, vehicle manufacturer, road network quality, licensing requirements and seat belt regulation etc.
Acknowledgements
We thank our research assistants Muhammad Umar Zahid and Mohammad Uzair Akram for assisting us in data cleaning and data analysis and writing. We also thank Dr. Syed Zahid Ali Associate professor LUMS for his valuable comments that greatly improved the manuscript.
Cite this paper
Malik, K.Z. and Aftab, A. (2017) Speed Limit and Fatalities in the U.S.: Implication for Transportation Policy. Theoretical Economics Letters, 7, 1398-1412. https://doi.org/10.4236/tel.2017.75094
References
- 1. Mannering, F.M., Nataliya, V. and Labi, S.A. (2007) Influence of Speed Limits on Roadway. Joint Transportation Research Program, West Lafayette, 18-26.
- 2. Tignor, S.C. and Warren, D. (1990) Driver Speed Behavior on U.S. Streets and Highways. Institute of Transport Engineers, London.
- 3. Albalate, D. and Bel, G. (2010) Speed Limit Laws in America: Economics, Politics. Research Institute of Applied Economics, Brasília, 13-18.
- 4. U.S. Department of Transportation (2010) An Analysis of the Significant Decline in Motor Vehicle Traffic Fatalities in 2008.
- 5. Boyles, S. (2015) Roads Are Better. Cars Are Safer. Let’s Raise the Speed Limit. The University of Texas at Austin, Austin.
- 6. Farmer, C., Lund, A. and Retting, R. (1996) Effect of 1996 Speed Limit Changes. Insurance Institute for Highway Safety, Arlington, 4-6.
- 7. Farmer, C.M. (2016) Relationship of Traffic Fatality Rates to Maximum State Speed Limits. Traffic Injury Prevention, 1, 1-14.
- 8. Xu, J., Kockelman, K.M. and Wang, Y.Y. (2014) Modeling Crash and Fatality Counts along Mainlanes and Frontage Roads across Texas: The roles of Design, the Built, Environment and Weather. Proceedings of 93rd Annual Meetings of the Transportation Research Board, Washington DC, 12-16 January 2014.
http://www.caee.utexas.edu/prof/kockelman/public_html/TRB14ZINBcrashesTX.pdf - 9. Malyshkina, N.V. and Mannering, F.L. (2008) Analysis of the Effect of Speed Limit Increases on Accident-Injury Severities. Transportation Research Record, 2083, 123-126.
https://doi.org/10.3141/2083-14 - 10. Kockelman, K.M. and Ma, J. (2007) Freeway Speeds and Speed Variations Precedings Crashes, within and across Lanes. Journal of Transportation Research Forum, 6-19, 8-19.
- 11. Kweon, Y.J. and Kockelman, K.M. (2005) Safety Effects of Speed Limit Changes: Use of Panel Models, Including Speed, Use, and Design Variables. Transport Research Record, 1908, 148-158.
https://doi.org/10.3141/1908-18 - 12. Renski, H., Khattak, A.J. and Council, F. (1999) Impact of Speed Limit Increases on Crash Injury Severity: Analysis of Single-Vehicle Crashes on North Carolina Interstate Highways. Transportation Research Record, 1665, 100-108.
https://doi.org/10.3141/1665-14 - 13. Parker, M.R.J. (1997) Effects of Raising and Lowering Speed Limits on Selected Roadway Sections. Turner-Fairbank Highway Research Center and U.S. Department of Transportation, McLean and Washington DC, 83-87.
- 14. New York State Department of Motor Vehicles (2014) 2014 Statewide Statistical Summary. New York State Department of Motor Vehicles, New York, 1-6.
- 15. Pennsylvania Department of Transportation (2014) Pennsylvania Crash Facts and Statistics. Pennsylvania Department of Transportation, Harrisburg, 23-24
- 16. Massachusetts Department of Transportation (2012) Massachusetts Travel Survey. Massachusetts Department of Transportation, Boston.
- 17. Boston Society of Civil Engineers Section and American Society of Civil Engineers (2012) Raising the Grade in Massachusetts. Boston Society of Civil Engineers Section and American Society of Civil Engineers, Boston, 1-4.
- 18. Illinois Department of Transportation (2011) Illinois Crash and Traffic Report. Illinois Department of Transportation, Springfield, 17-20, 30-38.
- 19. Traffic Crash Reporting Unit (2016) Michigan Traffic Crash Decade-at-a-Glance. Michigan State Police, Dimondale, 1.
- 20. Michigan Department of State Police (2010) UD-10 Traffic Crash Report Manual. Michigan Department of State Police, Dimondale, 10-16.
- 21. Florida Department of Transportation (2015) Highway Safety Manual. Florida Department of Transportation, Tallahassee.
- 22. Georgia Governor’s Office of Highway Safety (2013) Georgia Crashes, Injuries & Fatalities Statistics. Georgia Governor’s Office of Highway Safety, Atlanta.
- 23. Colorado Department of Transportation (2016) Colorado Annual Report. Colorado Department of Transportation, Denver, 13.
- 24. Colorado Department of Transportation, Division of Transit and Rail (2014) Annual Report. Colorado Department of Transportation, Denver, 3-4.
- 25. California Office of Traffic Safety (2014) California Traffic Safety Quick Stats. California Office of Traffic Safety, Elk Grove.
NOTES
1Dotted lines are confidence error bands of the impulse response function. Where dark line is the impulse response function.