Q. Zhang et al. / Natural Science 2 (2010) 681-687
Copyright © 2010 SciRes. OPEN ACCESS
685
685
4. DISTRIBUTION OF ATMOSPHERIC
INVERSE HUMIDITY AND NEGATIVE
WATER VAPOR FLUX AS WELL AS
COUNTER-GRADIENT TRANSFER
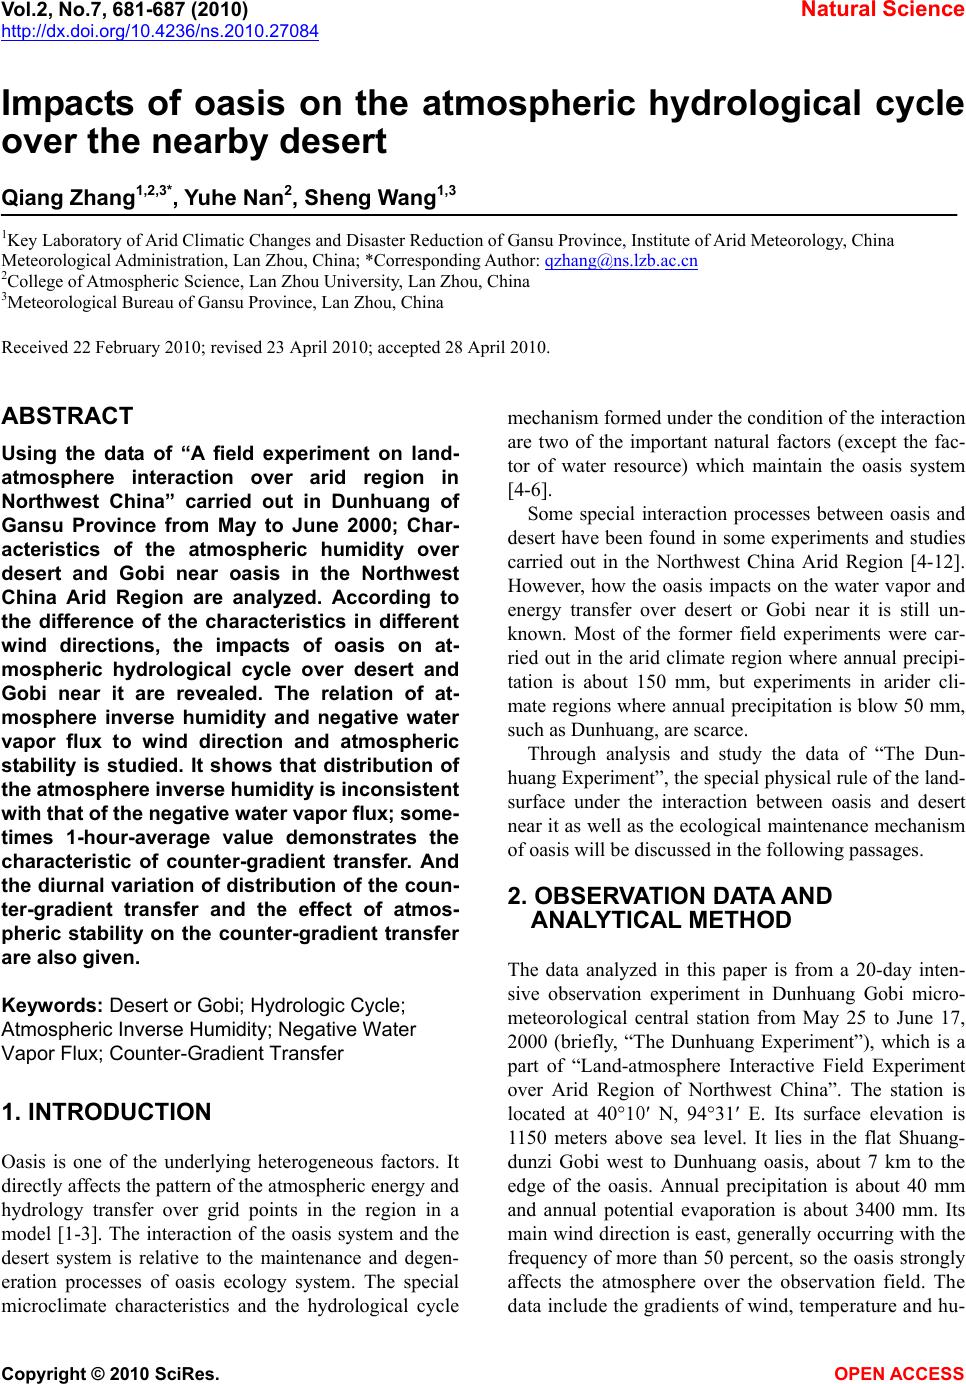
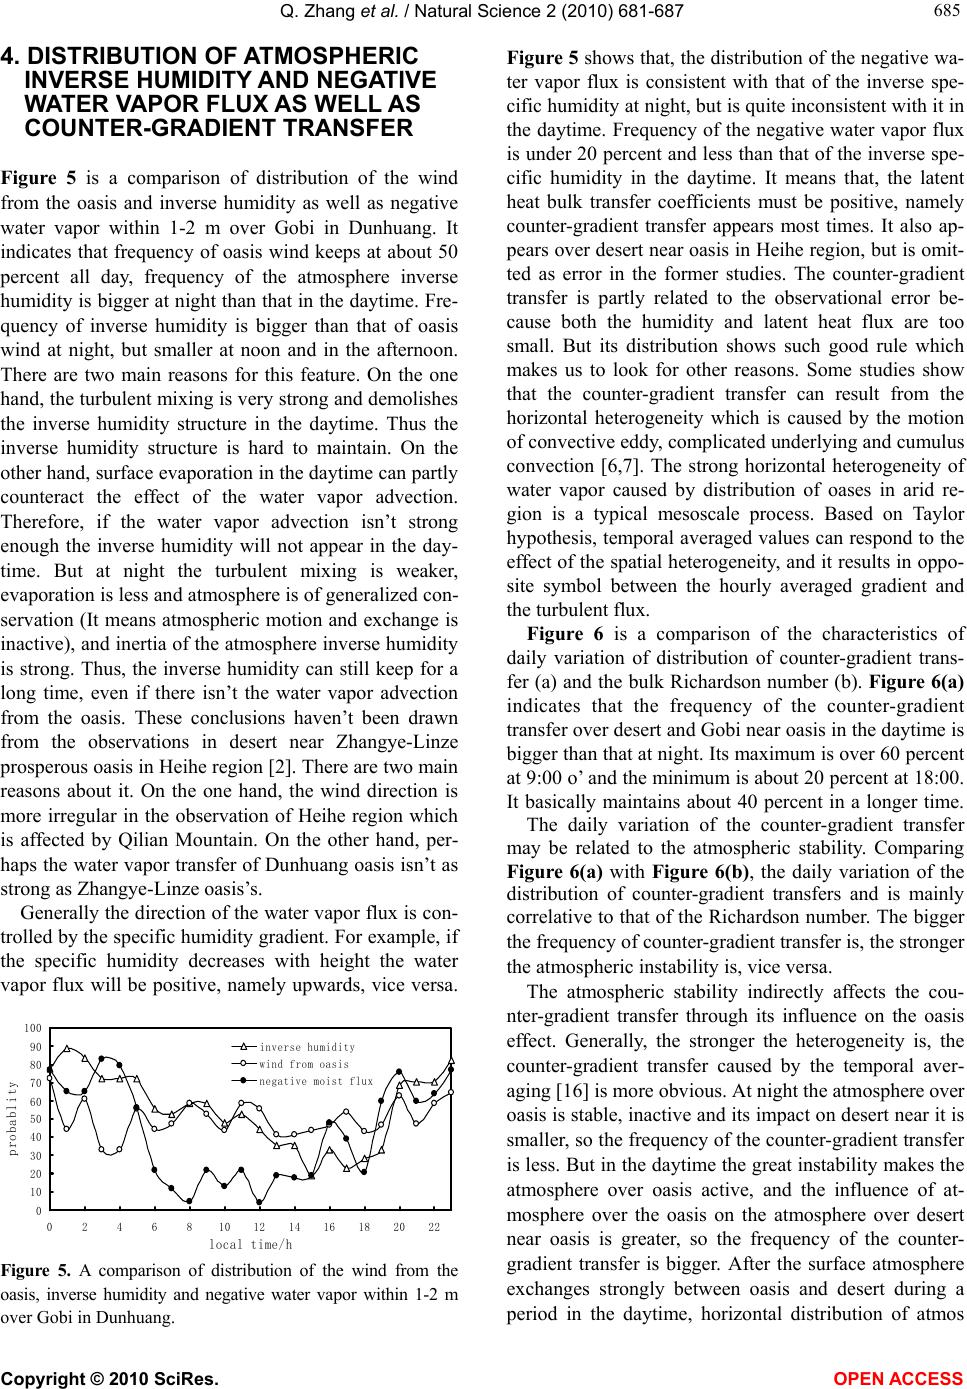
Figure 5 is a comparison of distribution of the wind
from the oasis and inverse humidity as well as negative
water vapor within 1-2 m over Gobi in Dunhuang. It
indicates that frequency of oasis wind keeps at about 50
percent all day, frequency of the atmosphere inverse
humidity is bigger at night than that in the daytime. Fre-
quency of inverse humidity is bigger than that of oasis
wind at night, but smaller at noon and in the afternoon.
There are two main reasons for this feature. On the one
hand, the turbulent mixing is very strong and demolishes
the inverse humidity structure in the daytime. Thus the
inverse humidity structure is hard to maintain. On the
other hand, surface evaporation in the daytime can partly
counteract the effect of the water vapor advection.
Therefore, if the water vapor advection isn’t strong
enough the inverse humidity will not appear in the day-
time. But at night the turbulent mixing is weaker,
evaporation is less and atmosphere is of generalized con-
servation (It means atmospheric motion and exchange is
inactive), and inertia of the atmosphere inverse humidity
is strong. Thus, the inverse humidity can still keep for a
long time, even if there isn’t the water vapor advection
from the oasis. These conclusions haven’t been drawn
from the observations in desert near Zhangye-Linze
prosperous oasis in Heihe region [2]. There are two main
reasons about it. On the one hand, the wind direction is
more irregular in the observation of Heihe region which
is affected by Qilian Mountain. On the other hand, per-
haps the water vapor transfer of Dunhuang oasis isn’t as
strong as Zhangye-Linze oasis’s.
Generally the direction of the water vapor flux is con-
trolled by the specific humidity gradient. For example, if
the specific humidity decreases with height the water
vapor flux will be positive, namely upwards, vice versa.
0
10
20
30
40
50
60
70
80
90
100
0 2 4 6 810121416182022
local time/h
probablity
inverse humidity
wind from oasis
ne
ative moist flux
Figure 5. A comparison of distribution of the wind from the
oasis, inverse humidity and negative water vapor within 1-2 m
over Gobi in Dunhuang.
Figure 5 shows that, the distribution of the negative wa-
ter vapor flux is consistent with that of the inverse spe-
cific humidity at night, but is quite inconsistent with it in
the daytime. Frequency of the negative water vapor flux
is under 20 percent and less than that of the inverse spe-
cific humidity in the daytime. It means that, the latent
heat bulk transfer coefficients must be positive, namely
counter-gradient transfer appears most times. It also ap-
pears over desert near oasis in Heihe region, but is omit-
ted as error in the former studies. The counter-gradient
transfer is partly related to the observational error be-
cause both the humidity and latent heat flux are too
small. But its distribution shows such good rule which
makes us to look for other reasons. Some studies show
that the counter-gradient transfer can result from the
horizontal heterogeneity which is caused by the motion
of convective eddy, complicated underlying and cumulus
convection [6,7]. The strong horizontal heterogeneity of
water vapor caused by distribution of oases in arid re-
gion is a typical mesoscale process. Based on Taylor
hypothesis, temporal averaged values can respond to the
effect of the spatial heterogeneity, and it results in oppo-
site symbol between the hourly averaged gradient and
the turbulent flux.
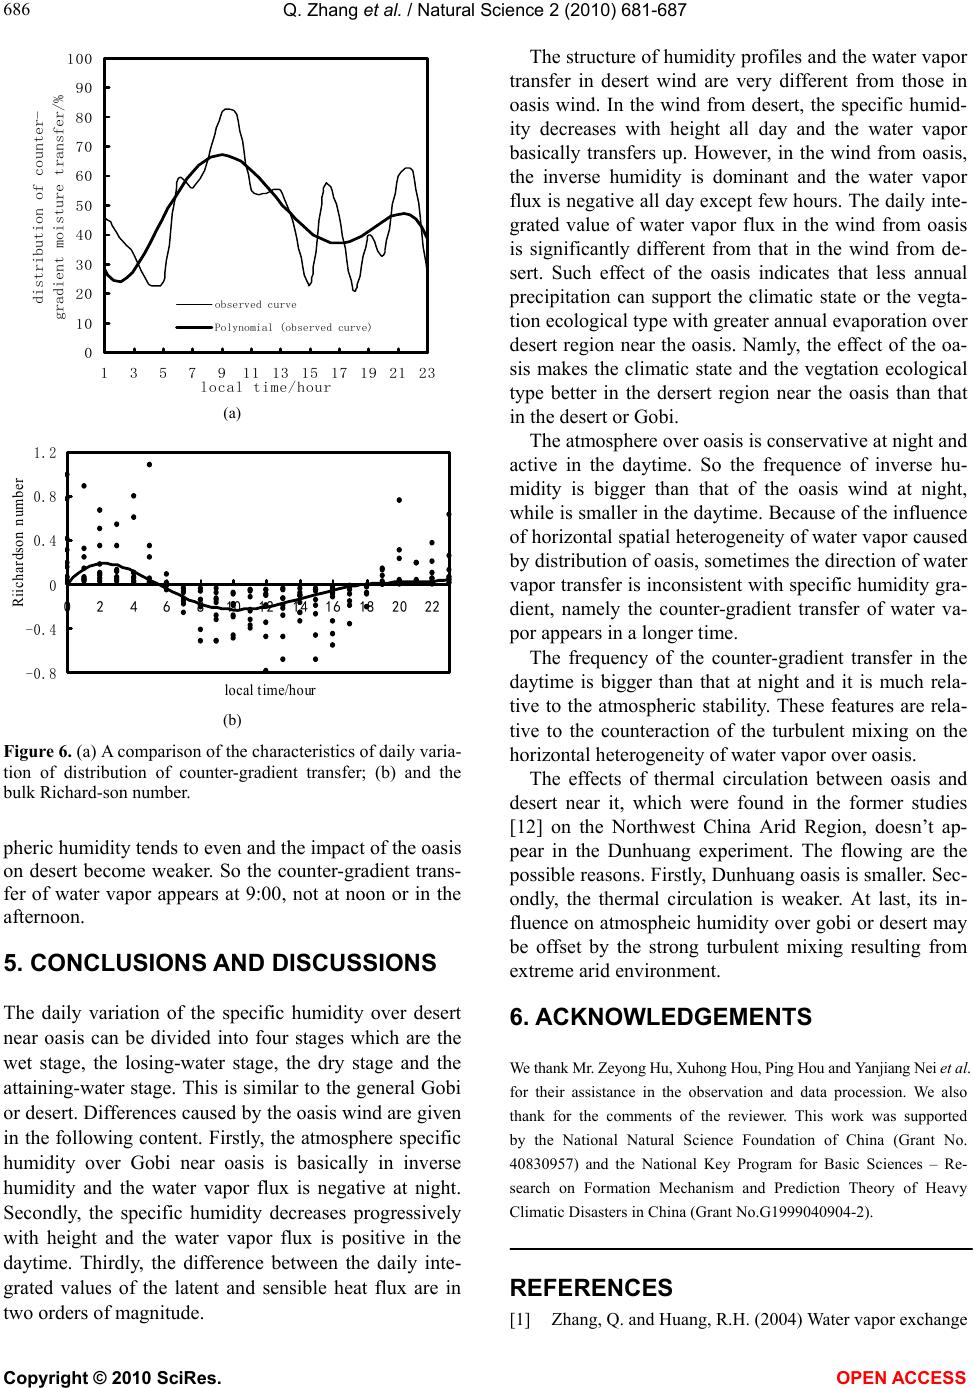
Figure 6 is a comparison of the characteristics of
daily variation of distribution of counter-gradient trans-
fer (a) and the bulk Richardson number (b). Figure 6(a)
indicates that the frequency of the counter-gradient
transfer over desert and Gobi near oasis in the daytime is
bigger than that at night. Its maximum is over 60 percent
at 9:00 o’ and the minimum is about 20 percent at 18:00.
It basically maintains about 40 percent in a longer time.
The daily variation of the counter-gradient transfer
may be related to the atmospheric stability. Comparing
Figure 6(a) with Figure 6(b), the daily variation of the
distribution of counter-gradient transfers and is mainly
correlative to that of the Richardson number. The bigger
the frequency of counter-gradient transfer is, the stronger
the atmospheric instability is, vice versa.
The atmospheric stability indirectly affects the cou-
nter-gradient transfer through its influence on the oasis
effect. Generally, the stronger the heterogeneity is, the
counter-gradient transfer caused by the temporal aver-
aging [16] is more obvious. At night the atmosphere over
oasis is stable, inactive and its impact on desert near it is
smaller, so the frequency of the counter-gradient transfer
is less. But in the daytime the great instability makes the
atmosphere over oasis active, and the influence of at-
mosphere over the oasis on the atmosphere over desert
near oasis is greater, so the frequency of the counter-
gradient transfer is bigger. After the surface atmosphere
exchanges strongly between oasis and desert during a
period in the daytime, horizontal distribution of atmos