Paper Menu >>
Journal Menu >>
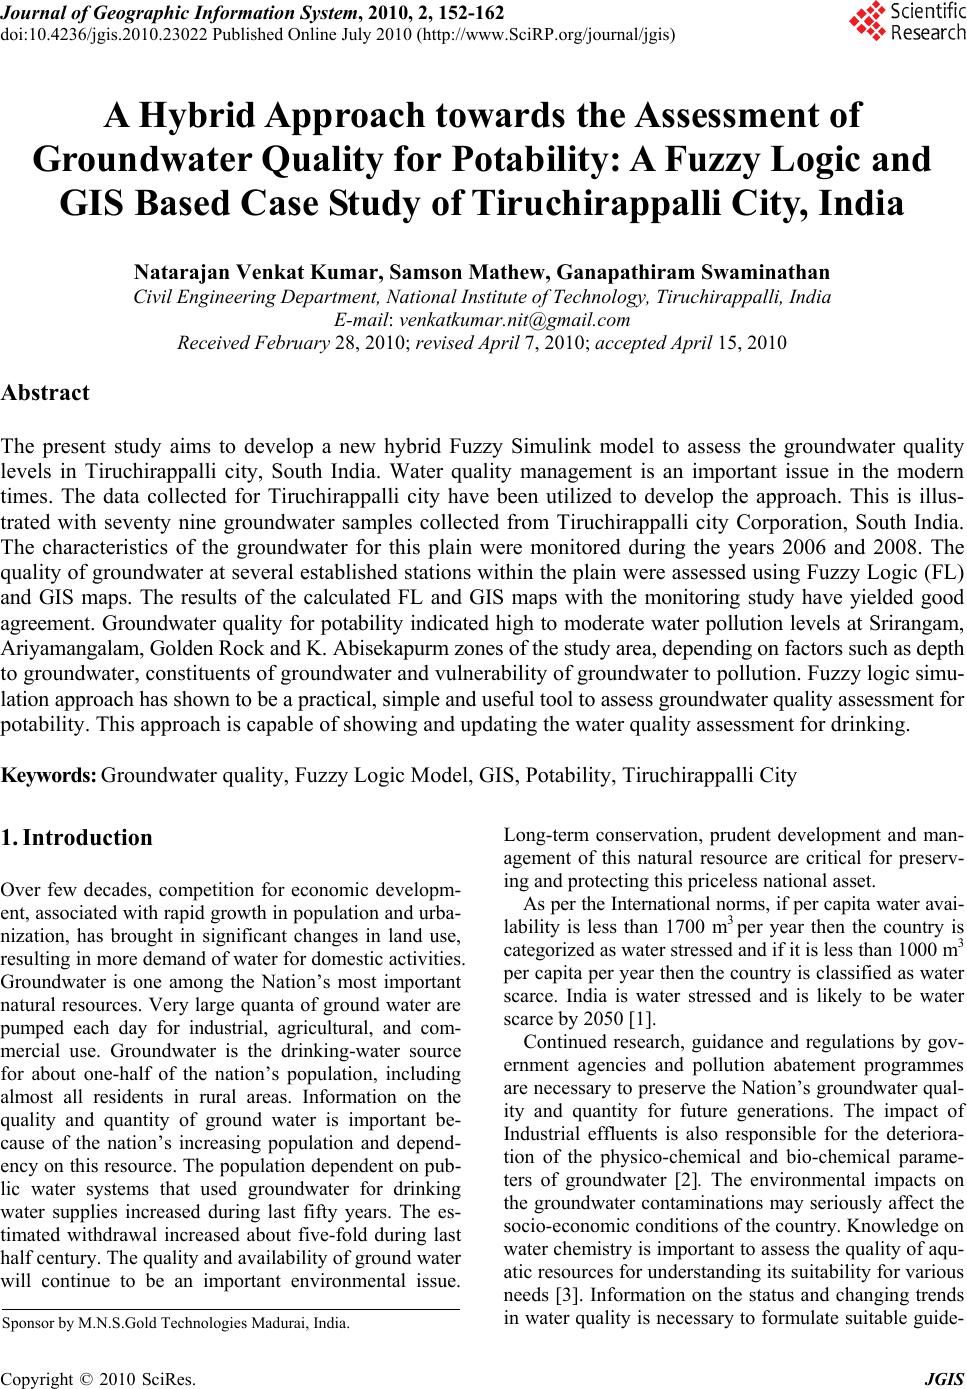 Journal of Geographic Information System, 2010, 2, 152-162 doi:10.4236/jgis.2010.23022 Published Online July 2010 (http://www.SciRP.org/journal/jgis) Copyright © 2010 SciRes. JGIS A Hybrid Approach towards the Assessment of Groundwater Quality for Potability: A Fuzzy Logic and GIS Based Case Study of Tiruchirappalli City, India Natarajan Venkat Kumar, Samson Mathew, Ganapathiram Swaminathan Civil Engineering Department, National Institute of Technology, Tiruchirappalli, India E-mail: venkatkumar.nit@gmail.com Received February 28, 2010; revised April 7, 2010; accepted April 15, 2010 Abstract The present study aims to develop a new hybrid Fuzzy Simulink model to assess the groundwater quality levels in Tiruchirappalli city, South India. Water quality management is an important issue in the modern times. The data collected for Tiruchirappalli city have been utilized to develop the approach. This is illus- trated with seventy nine groundwater samples collected from Tiruchirappalli city Corporation, South India. The characteristics of the groundwater for this plain were monitored during the years 2006 and 2008. The quality of groundwater at several established stations within the plain were assessed using Fuzzy Logic (FL) and GIS maps. The results of the calculated FL and GIS maps with the monitoring study have yielded good agreement. Groundwater quality for potability indicated high to moderate water pollution levels at Srirangam, Ariyamangalam, Golden Rock and K. Abisekapurm zones of the study area, depending on factors such as depth to groundwater, constituents of groundwater and vulnerability of groundwater to pollution. Fuzzy logic simu- lation approach has shown to be a practical, simple and useful tool to assess groundwater quality assessment for potability. This approach is capable of showing and updating the water quality assessment for drinking. Keywords: Groundwater quality, Fuzzy Logic Model, GIS, Potability, Tiruchirappalli City 1. Introduction Over few decades, competition for economic developm- ent, associated with rapid growth in population and urba- nization, has brought in significant changes in land use, resulting in more demand of water for domestic activities. Groundwater is one among the Nation’s most important natural resources. Very large quanta of ground water are pumped each day for industrial, agricultural, and com- mercial use. Groundwater is the drinking-water source for about one-half of the nation’s population, including almost all residents in rural areas. Information on the quality and quantity of ground water is important be- cause of the nation’s increasing population and depend- ency on this resource. The population dependent on pub- lic water systems that used groundwater for drinking water supplies increased during last fifty years. The es- timated withdrawal increased about five-fold during last half century. The quality and availability of ground water will continue to be an important environmental issue. Long-term conservation, prudent development and man- agement of this natural resource are critical for preserv- ing and protecting this priceless national asset. As per the International norms, if per capita water avai- lability is less than 1700 m3 per year then the country is categorized as water stressed and if it is less than 1000 m3 per capita per year then the country is classified as water scarce. India is water stressed and is likely to be water scarce by 2050 [1]. Continued research, guidance and regulations by gov- ernment agencies and pollution abatement programmes are necessary to preserve the Nation’s groundwater qual- ity and quantity for future generations. The impact of Industrial effluents is also responsible for the deteriora- tion of the physico-chemical and bio-chemical parame- ters of groundwater [2]. The environmental impacts on the groundwater contaminations may seriously affect the socio-economic conditions of the country. Knowledge on water chemistry is important to assess the quality of aqu- atic resources for understanding its suitability for various needs [3]. Information on the status and changing trends in water quality is necessary to formulate suitable guide- Sponsor by M.N.S.Gold Technologies Madurai, India. 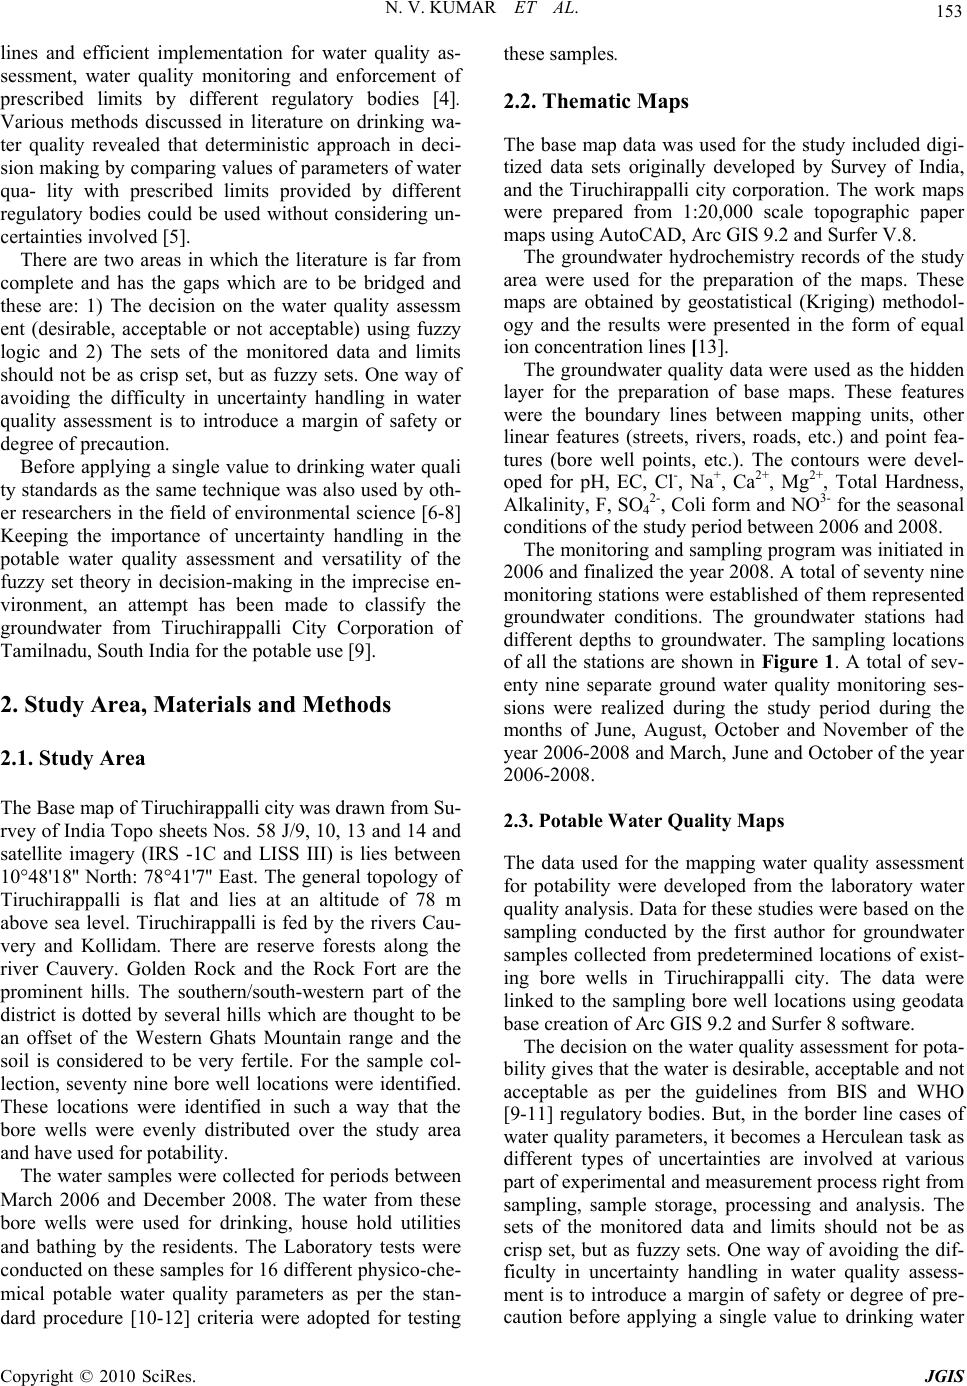 N. V. KUMAR ET AL. Copyright © 2010 SciRes. JGIS 153 lines and efficient implementation for water quality as- sessment, water quality monitoring and enforcement of prescribed limits by different regulatory bodies [4]. Various methods discussed in literature on drinking wa- ter quality revealed that deterministic approach in deci- sion making by comparing values of parameters of water qua- lity with prescribed limits provided by different regulatory bodies could be used without considering un- certainties involved [5]. There are two areas in which the literature is far from complete and has the gaps which are to be bridged and these are: 1) The decision on the water quality assessm ent (desirable, acceptable or not acceptable) using fuzzy logic and 2) The sets of the monitored data and limits should not be as crisp set, but as fuzzy sets. One way of avoiding the difficulty in uncertainty handling in water quality assessment is to introduce a margin of safety or degree of precaution. Before applying a single value to drinking water quali ty standards as the same technique was also used by oth- er researchers in the field of environmental science [6-8] Keeping the importance of uncertainty handling in the potable water quality assessment and versatility of the fuzzy set theory in decision-making in the imprecise en- vironment, an attempt has been made to classify the groundwater from Tiruchirappalli City Corporation of Tamilnadu, South India for the potable use [9]. 2. Study Area, Materials and Methods 2.1. Study Area The Base map of Tiruchirappalli city was drawn from Su- rvey of India Topo sheets Nos. 58 J/9, 10, 13 and 14 and satellite imagery (IRS -1C and LISS III) is lies between 10°48'18'' North: 78°41'7'' East. The general topology of Tiruchirappalli is flat and lies at an altitude of 78 m above sea level. Tiruchirappalli is fed by the rivers Cau- very and Kollidam. There are reserve forests along the river Cauvery. Golden Rock and the Rock Fort are the prominent hills. The southern/south-western part of the district is dotted by several hills which are thought to be an offset of the Western Ghats Mountain range and the soil is considered to be very fertile. For the sample col- lection, seventy nine bore well locations were identified. These locations were identified in such a way that the bore wells were evenly distributed over the study area and have used for potability. The water samples were collected for periods between March 2006 and December 2008. The water from these bore wells were used for drinking, house hold utilities and bathing by the residents. The Laboratory tests were conducted on these samples for 16 different physico-che- mical potable water quality parameters as per the stan- dard procedure [10-12] criteria were adopted for testing these samples. 2.2. Thematic Maps The base map data was used for the study included digi- tized data sets originally developed by Survey of India, and the Tiruchirappalli city corporation. The work maps were prepared from 1:20,000 scale topographic paper maps using AutoCAD, Arc GIS 9.2 and Surfer V.8. The groundwater hydrochemistry records of the study area were used for the preparation of the maps. These maps are obtained by geostatistical (Kriging) methodol- ogy and the results were presented in the form of equal ion concentration lines [13]. The groundwater quality data were used as the hidden layer for the preparation of base maps. These features were the boundary lines between mapping units, other linear features (streets, rivers, roads, etc.) and point fea- tures (bore well points, etc.). The contours were devel- oped for pH, EC, Cl-, Na+, Ca2+, Mg2+, Total Hardness, Alkalinity, F, SO4 2-, Coli form and NO3- for the seasonal conditions of the study period between 2006 and 2008. The monitoring and sampling program was initiated in 2006 and finalized the year 2008. A total of seventy nine monitoring stations were established of them represented groundwater conditions. The groundwater stations had different depths to groundwater. The sampling locations of all the stations are shown in Figure 1. A total of sev- enty nine separate ground water quality monitoring ses- sions were realized during the study period during the months of June, August, October and November of the year 2006-2008 and March, June and October of the year 2006-2008. 2.3. Potable Water Quality Maps The data used for the mapping water quality assessment for potability were developed from the laboratory water quality analysis. Data for these studies were based on the sampling conducted by the first author for groundwater samples collected from predetermined locations of exist- ing bore wells in Tiruchirappalli city. The data were linked to the sampling bore well locations using geodata base creation of Arc GIS 9.2 and Surfer 8 software. The decision on the water quality assessment for pota- bility gives that the water is desirable, acceptable and not acceptable as per the guidelines from BIS and WHO [9-11] regulatory bodies. But, in the border line cases of water quality parameters, it becomes a Herculean task as different types of uncertainties are involved at various part of experimental and measurement process right from sampling, sample storage, processing and analysis. The sets of the monitored data and limits should not be as crisp set, but as fuzzy sets. One way of avoiding the dif- ficulty in uncertainty handling in water quality assess- ment is to introduce a margin of safety or degree of pre- caution before applying a single value to drinking water 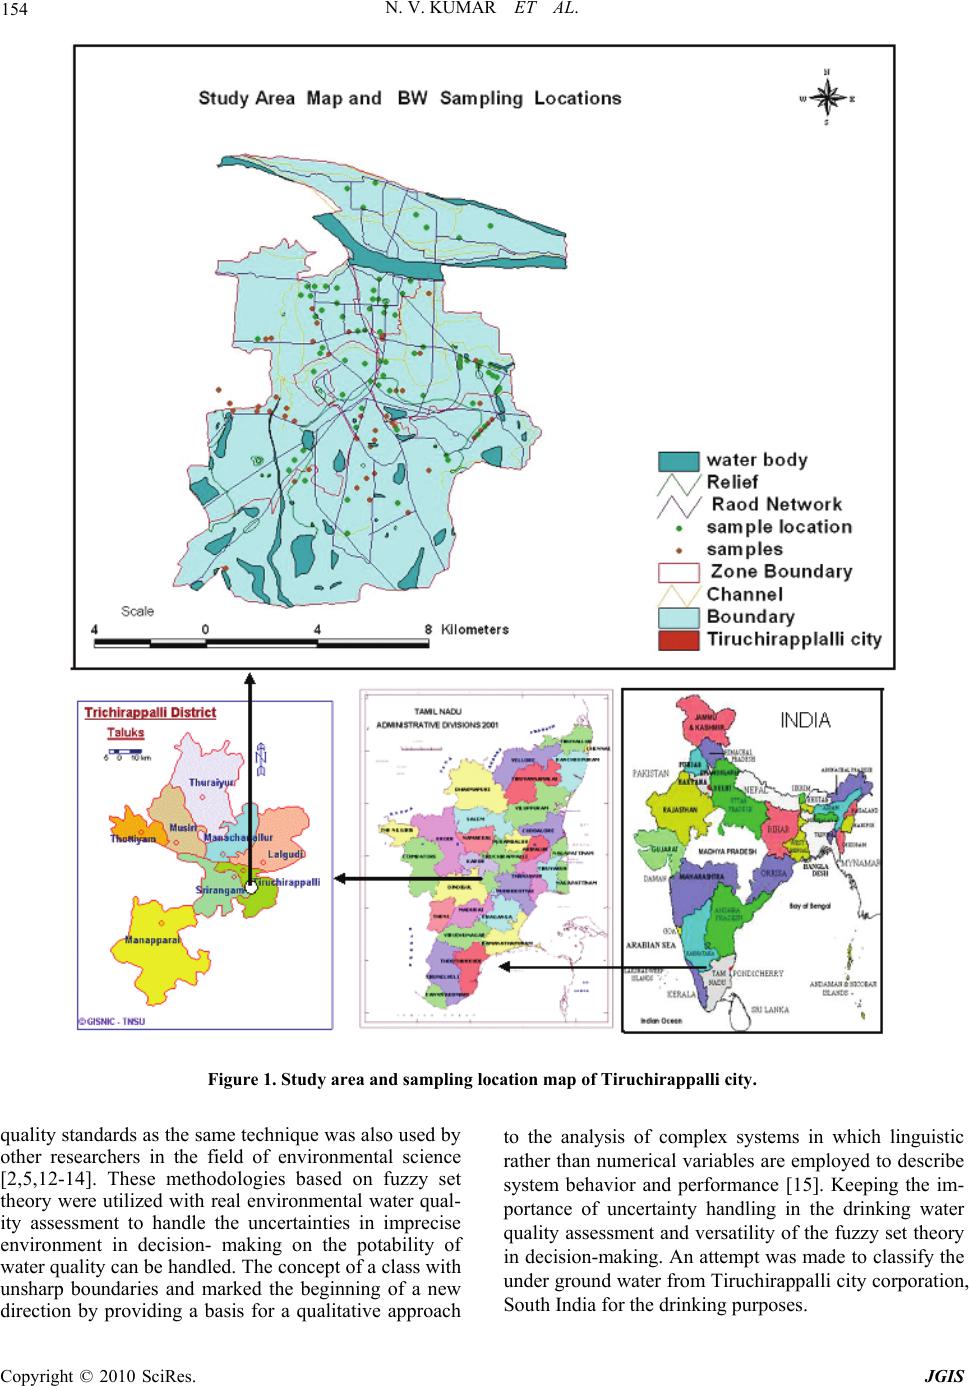 N. V. KUMAR ET AL. Copyright © 2010 SciRes. JGIS 154 Figure 1. Study area and sampling location map of Tiruchirappalli city. quality standards as the same technique was also used by other researchers in the field of environmental science [2,5,12-14]. These methodologies based on fuzzy set theory were utilized with real environmental water qual- ity assessment to handle the uncertainties in imprecise environment in decision- making on the potability of water quality can be handled. The concept of a class with unsharp boundaries and marked the beginning of a new direction by providing a basis for a qualitative approach to the analysis of complex systems in which linguistic rather than numerical variables are employed to describe system behavior and performance [15]. Keeping the im- portance of uncertainty handling in the drinking water quality assessment and versatility of the fuzzy set theory in decision-making. An attempt was made to classify the under ground water from Tiruchirappalli city corporation, South India for the drinking purposes. 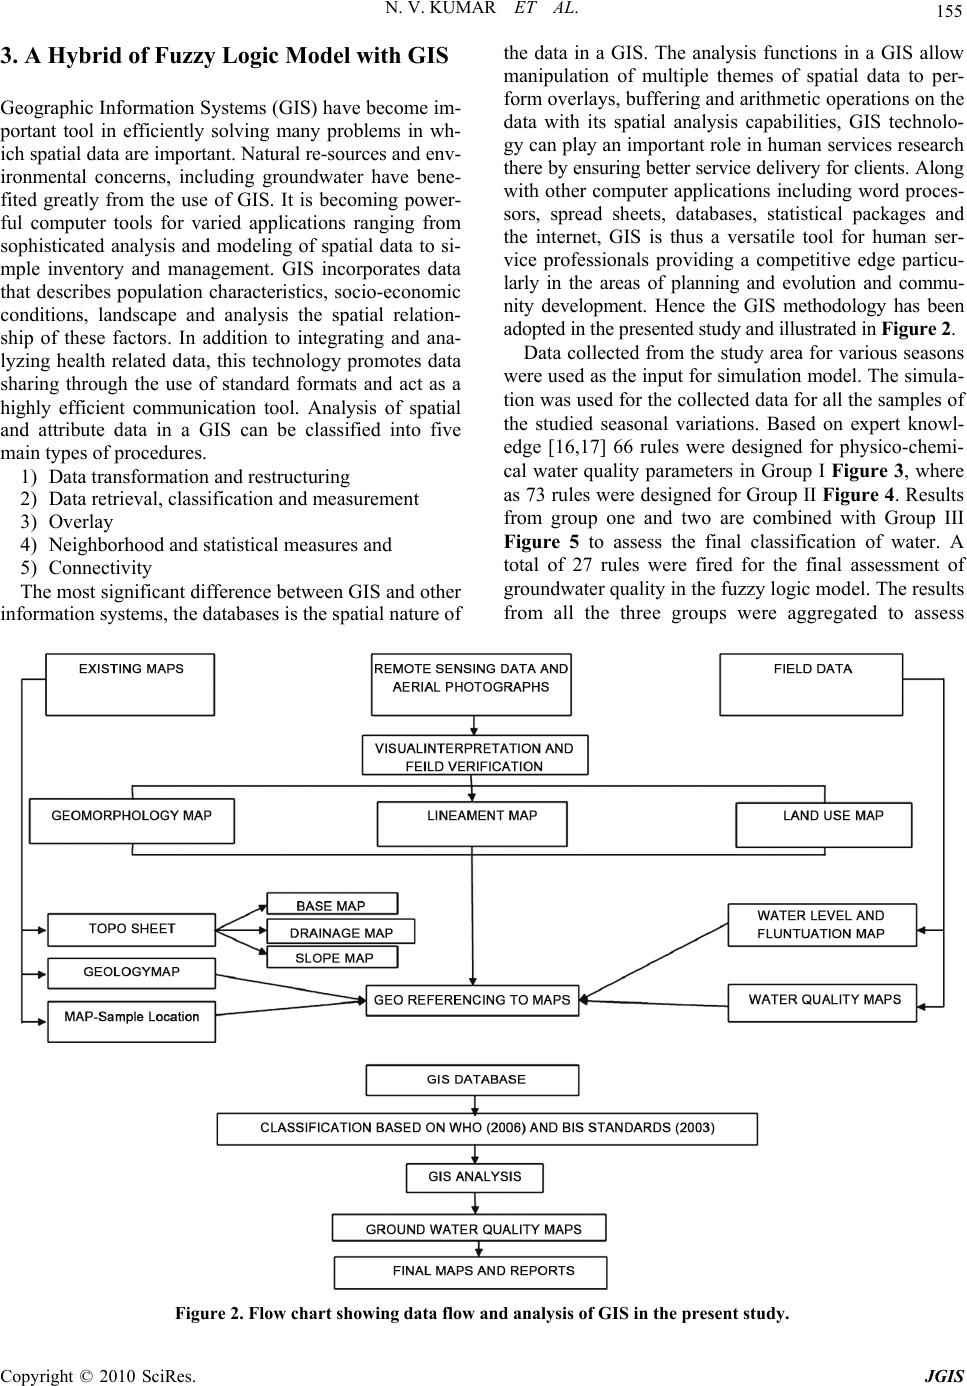 N. V. KUMAR ET AL. Copyright © 2010 SciRes. JGIS 155 3. A Hybrid of Fuzzy Logic Model with GIS Geographic Information Systems (GIS) have become im- portant tool in efficiently solving many problems in wh- ich spatial data are important. Natural re-sources and env- ironmental concerns, including groundwater have bene- fited greatly from the use of GIS. It is becoming power- ful computer tools for varied applications ranging from sophisticated analysis and modeling of spatial data to si- mple inventory and management. GIS incorporates data that describes population characteristics, socio-economic conditions, landscape and analysis the spatial relation- ship of these factors. In addition to integrating and ana- lyzing health related data, this technology promotes data sharing through the use of standard formats and act as a highly efficient communication tool. Analysis of spatial and attribute data in a GIS can be classified into five main types of procedures. 1) Data transformation and restructuring 2) Data retrieval, classification and measurement 3) Overlay 4) Neighborhood and statistical measures and 5) Connectivity The most significant difference between GIS and other information systems, the databases is the spatial nature of the data in a GIS. The analysis functions in a GIS allow manipulation of multiple themes of spatial data to per- form overlays, buffering and arithmetic operations on the data with its spatial analysis capabilities, GIS technolo- gy can play an important role in human services research there by ensuring better service delivery for clients. Along with other computer applications including word proces- sors, spread sheets, databases, statistical packages and the internet, GIS is thus a versatile tool for human ser- vice professionals providing a competitive edge particu- larly in the areas of planning and evolution and commu- nity development. Hence the GIS methodology has been adopted in the presented study and illustrated in Figure 2. Data collected from the study area for various seasons were used as the input for simulation model. The simula- tion was used for the collected data for all the samples of the studied seasonal variations. Based on expert knowl- edge [16,17] 66 rules were designed for physico-chemi- cal water quality parameters in Group I Figure 3, where as 73 rules were designed for Group II Figure 4. Results from group one and two are combined with Group III Figure 5 to assess the final classification of water. A total of 27 rules were fired for the final assessment of groundwater quality in the fuzzy logic model. The results from all the three groups were aggregated to assess Figure 2. Flow chart showing data flow and analysis of GIS in the present study. 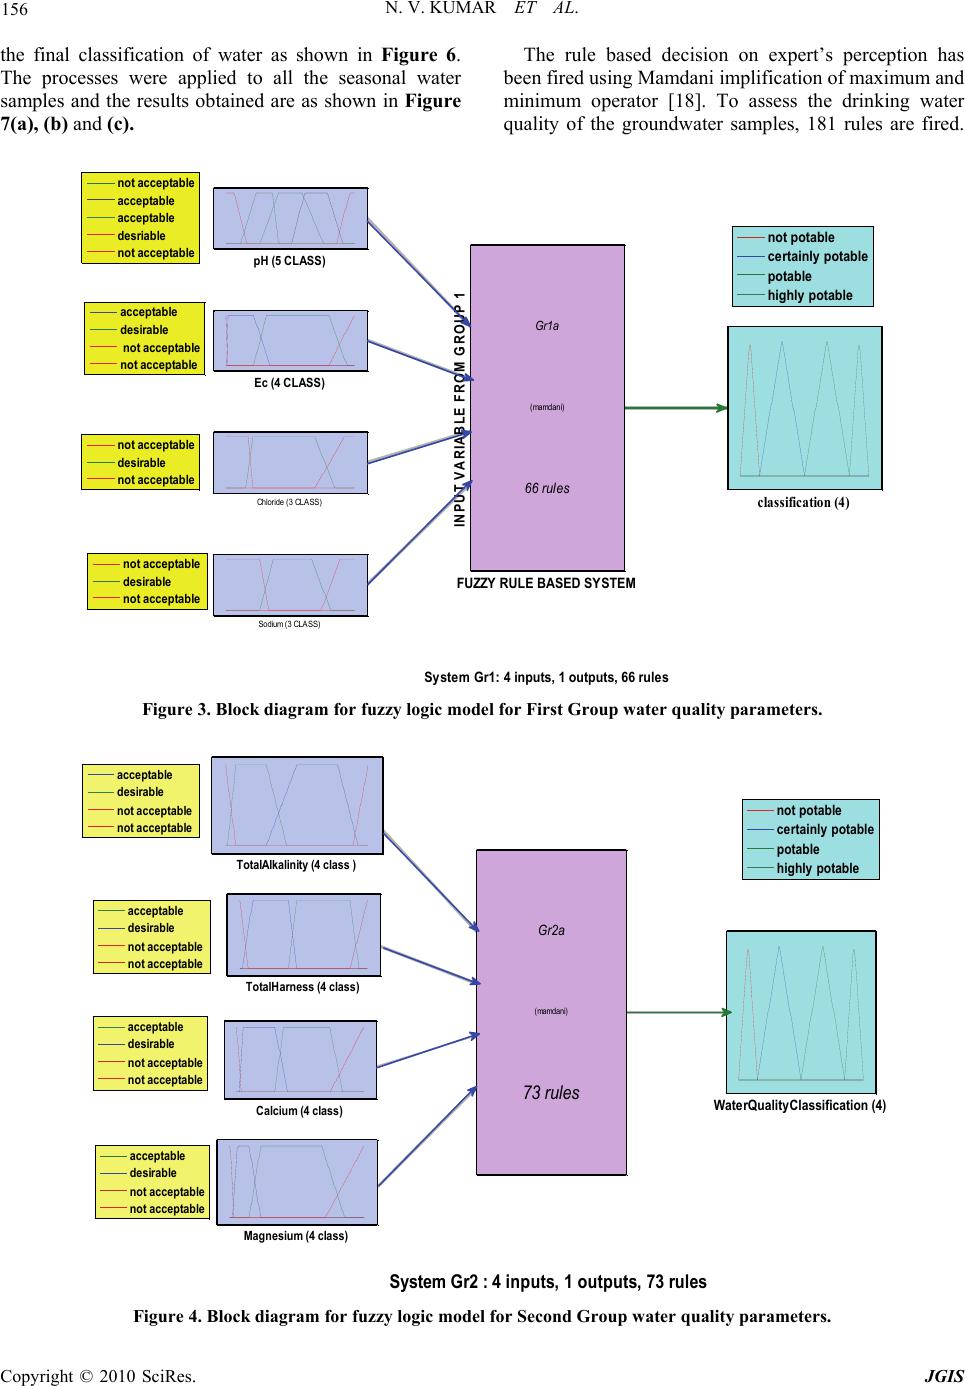 N. V. KUMAR ET AL. Copyright © 2010 SciRes. JGIS 156 the final classification of water as shown in Figure 6. The processes were applied to all the seasonal water samples and the results obtained are as shown in Figure 7(a), (b) and (c). The rule based decision on expert’s perception has been fired using Mamdani implification of maximum and minimum operator [18]. To assess the drinking water quality of the groundwater samples, 181 rules are fired. System Gr1: 4 inputs, 1 outputs, 66 rules pH (5 CLASS) Ec (4 CLASS) Chloride (3 CLASS) Sodium (3 CLASS) Gr1a (mamdani) 66 rules FUZZY RULE BASED SYSTEM INPUT VARIABLE FROM GROUP 1 classification (4) not acceptable acceptable acceptable desriable not acceptable not acceptable desirable not acceptable not acceptable desirable not acceptable not potable certainly potable potable highly potable acceptable desirable not acceptable not acceptable Figure 3. Block diagram for fuzzy logic model for First Group water quality parameters. System Gr2 : 4 inputs, 1 outputs, 73 rules TotalAlkalinity (4 class ) TotalHarness (4 class) Calcium (4 class) Magnesium (4 class) WaterQualityClassification (4) Gr2a (mamdani) 73 rules acceptable desirable not acceptable not acceptable acceptable desirable not acceptable not acceptable acceptable desirable not acceptable not acceptable acceptable desirable not acceptable not acceptable not potable certainly potable potable highly potable Figure 4. Block diagram for fuzzy logic model for Second Group water quality parameters. 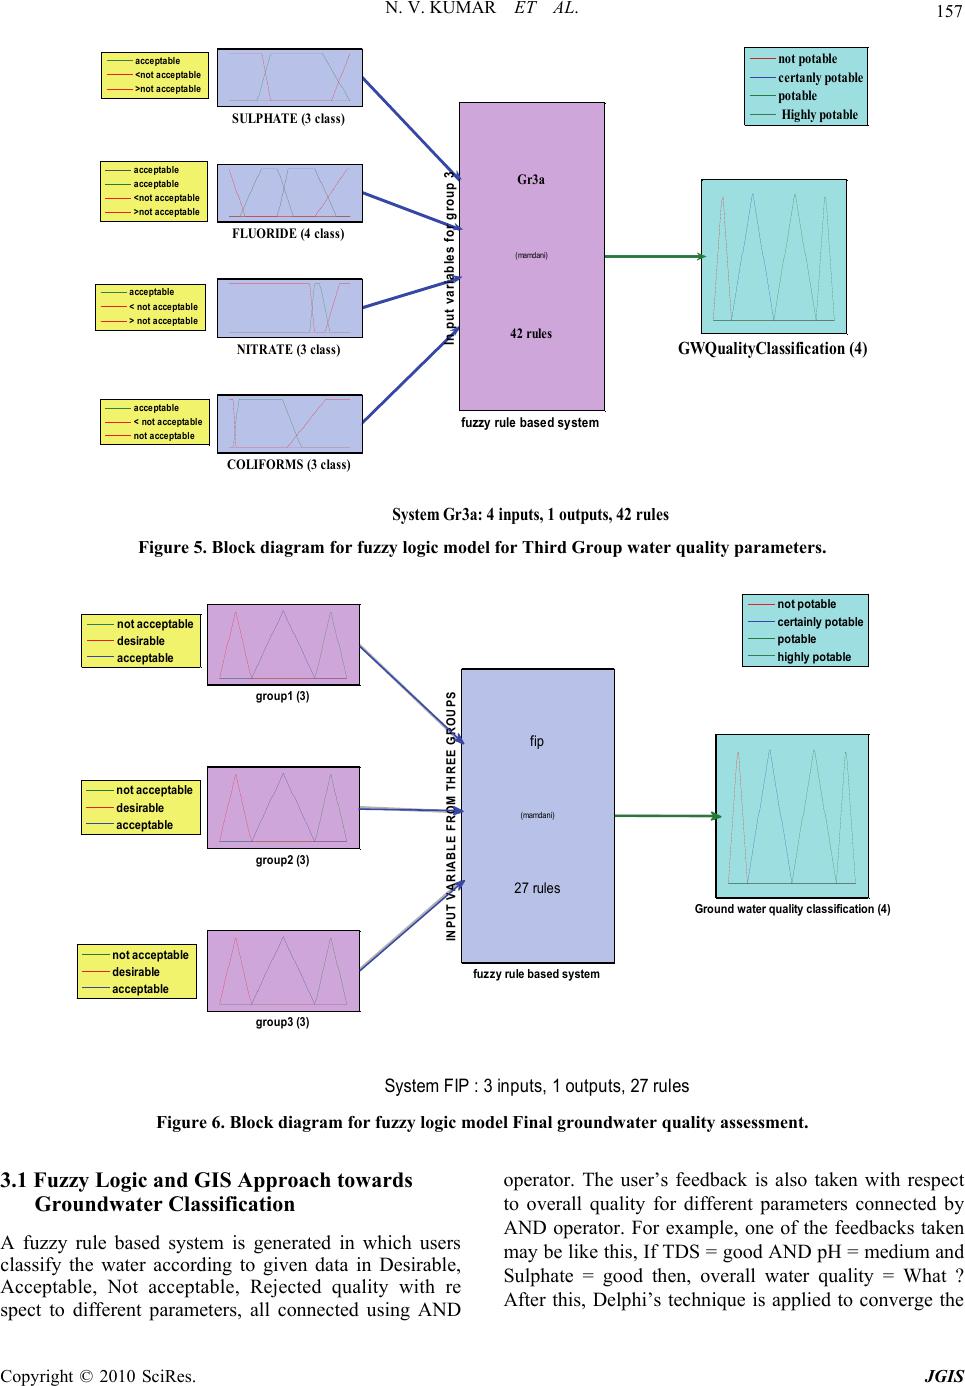 N. V. KUMAR ET AL. Copyright © 2010 SciRes. JGIS 157 System Gr3a: 4 inputs, 1 outputs, 42 rules FLUORIDE (4 class) NITRATE (3 class) COLIFORMS (3 class) Gr3a (mamdani) 42 rules fuzzy rule based system In put variables for group 3 GWQualityClassification (4) not potable certanly potable potable Highly potable acceptable <not acceptable >not acceptable acceptable acceptable <not acceptable >not acceptable acceptable < not acceptable > not acceptable acceptable < not acceptable not acceptable SULPHATE (3 class) Figure 5. Block diagram for fuzzy logic model for Third Group water quality parameters. System FIP : 3 inputs, 1 outputs, 27 rules group1 (3) group2 (3) group3 (3) Ground water quality classification (4) fip (mamdani) 27 rules fuzzy rule based system INPUT VARIABLE FROM THREE GROUPS not acceptable desirable acceptable not acceptable desirable acceptable not acceptable desirable acceptable not potable certainly potable potable highly potable Figure 6. Block diagram for fuzzy logic model Final groundwater quality assessment. 3.1 Fuzzy Logic and GIS Approach towards Groundwater Classification A fuzzy rule based system is generated in which users classify the water according to given data in Desirable, Acceptable, Not acceptable, Rejected quality with re spect to different parameters, all connected using AND operator. The user’s feedback is also taken with respect to overall quality for different parameters connected by AND operator. For example, one of the feedbacks taken may be like this, If TDS = good AND pH = medium and Sulphate = good then, overall water quality = What ? After this, Delphi’s technique is applied to converge the 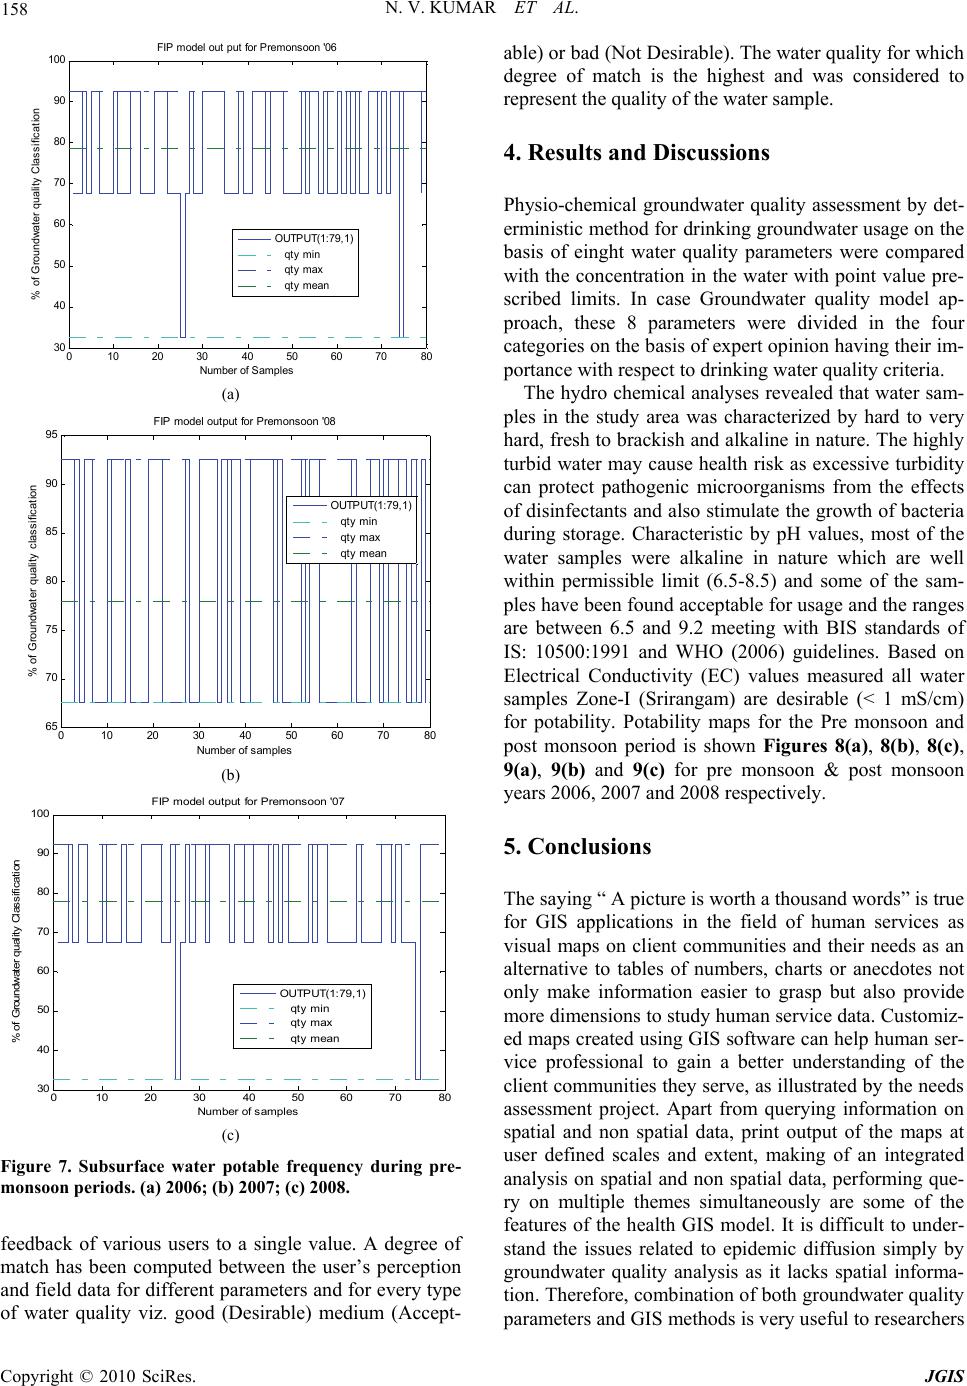 N. V. KUMAR ET AL. Copyright © 2010 SciRes. JGIS 158 010 20 3040 50 60 7080 30 40 50 60 70 80 90 100 Number of Samples % of Groundwater quality Classification FIP model out put for Premonsoon '06 OUTPUT(1:79, 1) qty min qty max qty mean (a) 010 20 3040 50 60 70 80 65 70 75 80 85 90 95 Number of samples % of Groundwater quality classification FIP model output for Premonsoon '08 OUTPUT(1:79, 1) qty min qty max qty mean (b) 010 20 3040 50 60 70 80 30 40 50 60 70 80 90 100 Number of samples % of Groundwater quality Classification FIP model output for Premonsoon '07 OUTPUT(1:79,1) qty min qty max qty mean (c) Figure 7. Subsurface water potable frequency during pre- monsoon periods. (a) 2006; (b) 2007; (c) 2008. feedback of various users to a single value. A degree of match has been computed between the user’s perception and field data for different parameters and for every type of water quality viz. good (Desirable) medium (Accept- able) or bad (Not Desirable). The water quality for which degree of match is the highest and was considered to represent the quality of the water sample. 4. Results and Discussions Physio-chemical groundwater quality assessment by det- erministic method for drinking groundwater usage on the basis of einght water quality parameters were compared with the concentration in the water with point value pre- scribed limits. In case Groundwater quality model ap- proach, these 8 parameters were divided in the four categories on the basis of expert opinion having their im- portance with respect to drinking water quality criteria. The hydro chemical analyses revealed that water sam- ples in the study area was characterized by hard to very hard, fresh to brackish and alkaline in nature. The highly turbid water may cause health risk as excessive turbidity can protect pathogenic microorganisms from the effects of disinfectants and also stimulate the growth of bacteria during storage. Characteristic by pH values, most of the water samples were alkaline in nature which are well within permissible limit (6.5-8.5) and some of the sam- ples have been found acceptable for usage and the ranges are between 6.5 and 9.2 meeting with BIS standards of IS: 10500:1991 and WHO (2006) guidelines. Based on Electrical Conductivity (EC) values measured all water samples Zone-I (Srirangam) are desirable (< 1 mS/cm) for potability. Potability maps for the Pre monsoon and post monsoon period is shown Figures 8(a), 8(b), 8(c), 9(a), 9(b) and 9(c) for pre monsoon & post monsoon years 2006, 2007 and 2008 respectively. 5. Conclusions The saying “ A picture is worth a thousand words” is true for GIS applications in the field of human services as visual maps on client communities and their needs as an alternative to tables of numbers, charts or anecdotes not only make information easier to grasp but also provide more dimensions to study human service data. Customiz- ed maps created using GIS software can help human ser- vice professional to gain a better understanding of the client communities they serve, as illustrated by the needs assessment project. Apart from querying information on spatial and non spatial data, print output of the maps at user defined scales and extent, making of an integrated analysis on spatial and non spatial data, performing que- ry on multiple themes simultaneously are some of the features of the health GIS model. It is difficult to under- stand the issues related to epidemic diffusion simply by groundwater quality analysis as it lacks spatial informa- tion. Therefore, combination of both groundwater quality parameters and GIS methods is very useful to researchers 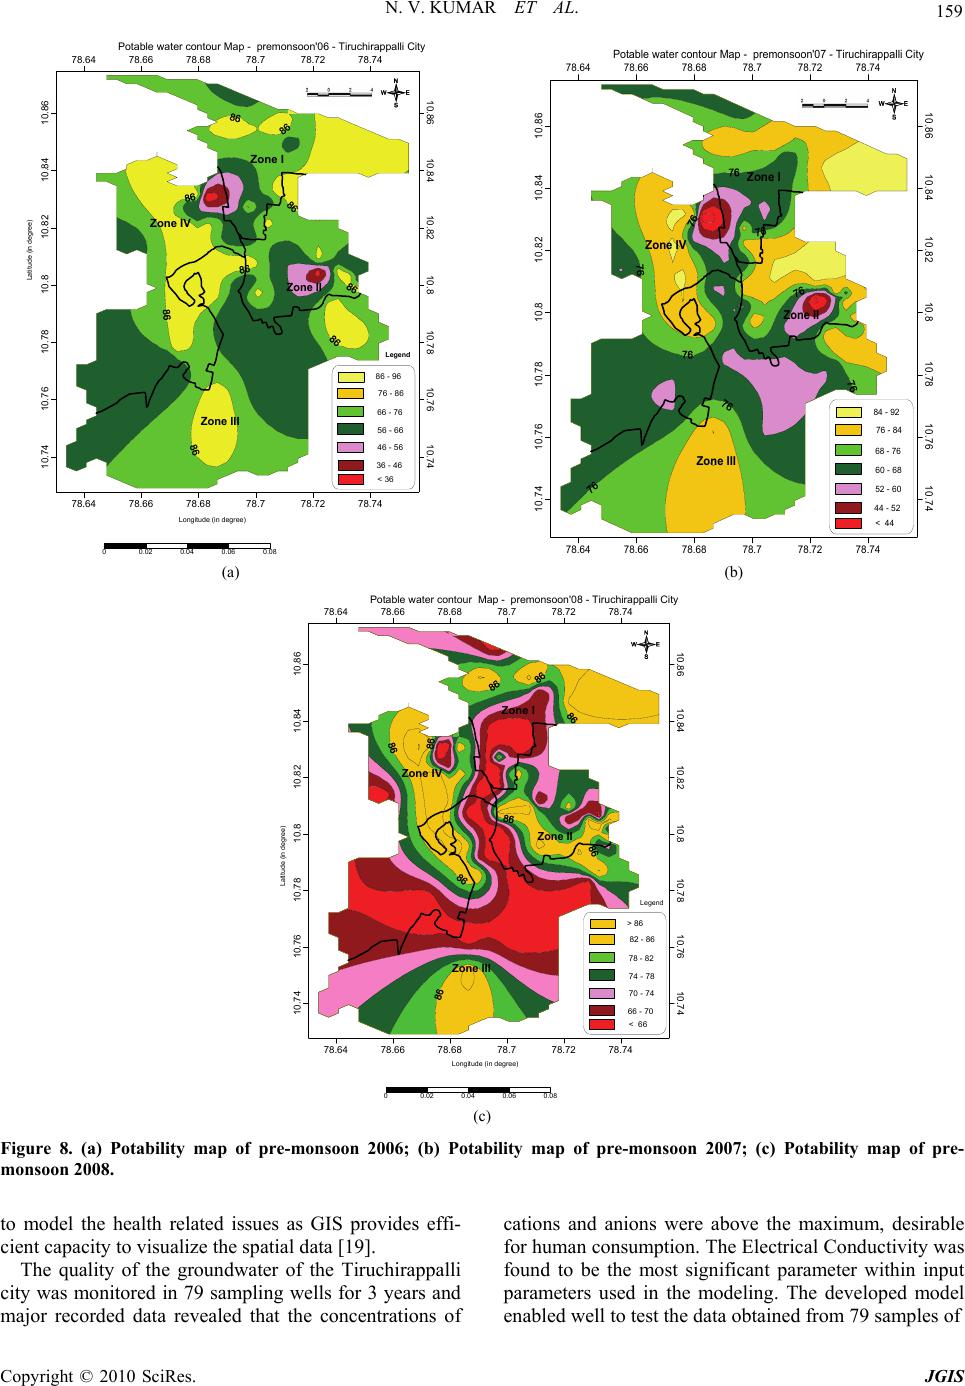 N. V. KUMAR ET AL. Copyright © 2010 SciRes. JGIS 159 78.64 78.66 78.6878.778.72 78.74 78.64 78.66 78.6878.778.72 78.74 10.74 10.76 10.7810.810.82 10.84 10.86 10.7410.7610.7810.810.8210.8410.86 Potable water contour Map - premonsoon'06 - Tiruchirappalli City Zone I Zone IV Zone II Zone III 76 - 86 86 - 96 66 - 76 56 - 66 46 - 56 36 - 46 < 36 Legend 00.02 0.04 0.06 0.08 Longitude (in degree) Latitude (in degree) (a) 78.64 78.66 78.6878.778.72 78.74 78.64 78.66 78.6878.778.72 78.74 10.74 10.76 10.7810.810.82 10.84 10.86 10.7410.7610.7810.810.8210.8410.86 Potable water contour Map - premonsoon'07 - Tiruchirappalli City Zone I Zone IV Zone II Zone III 76 - 84 84 - 92 68 - 76 60 - 68 52 - 60 44 - 52 < 44 (b) 78.64 78.66 78.6878.778.72 78.74 78.64 78.66 78.6878.778.72 78.74 10.74 10.76 10.7810.810.82 10.8410.86 10.7410.7610.7810.810.8210.8410.86 Potable water contour Map - premonsoon'08 - Tiruchirappalli City Zone I Zone IV Zone II Zone III 82 - 86 > 86 78 - 82 74 - 78 70 - 74 66 - 70 < 66 Legend 00.020.04 0.06 0.08 Longitude (in degree) Latitude (in deg r ee) (c) Figure 8. (a) Potability map of pre-monsoon 2006; (b) Potability map of pre-monsoon 2007; (c) Potability map of pre- monsoon 2008. to model the health related issues as GIS provides effi- cient capacity to visualize the spatial data [19]. The quality of the groundwater of the Tiruchirappalli city was monitored in 79 sampling wells for 3 years and major recorded data revealed that the concentrations of cations and anions were above the maximum, desirable for human consumption. The Electrical Conductivity was found to be the most significant parameter within input parameters used in the modeling. The developed model enabled well to test the data obtained from 79 samples of 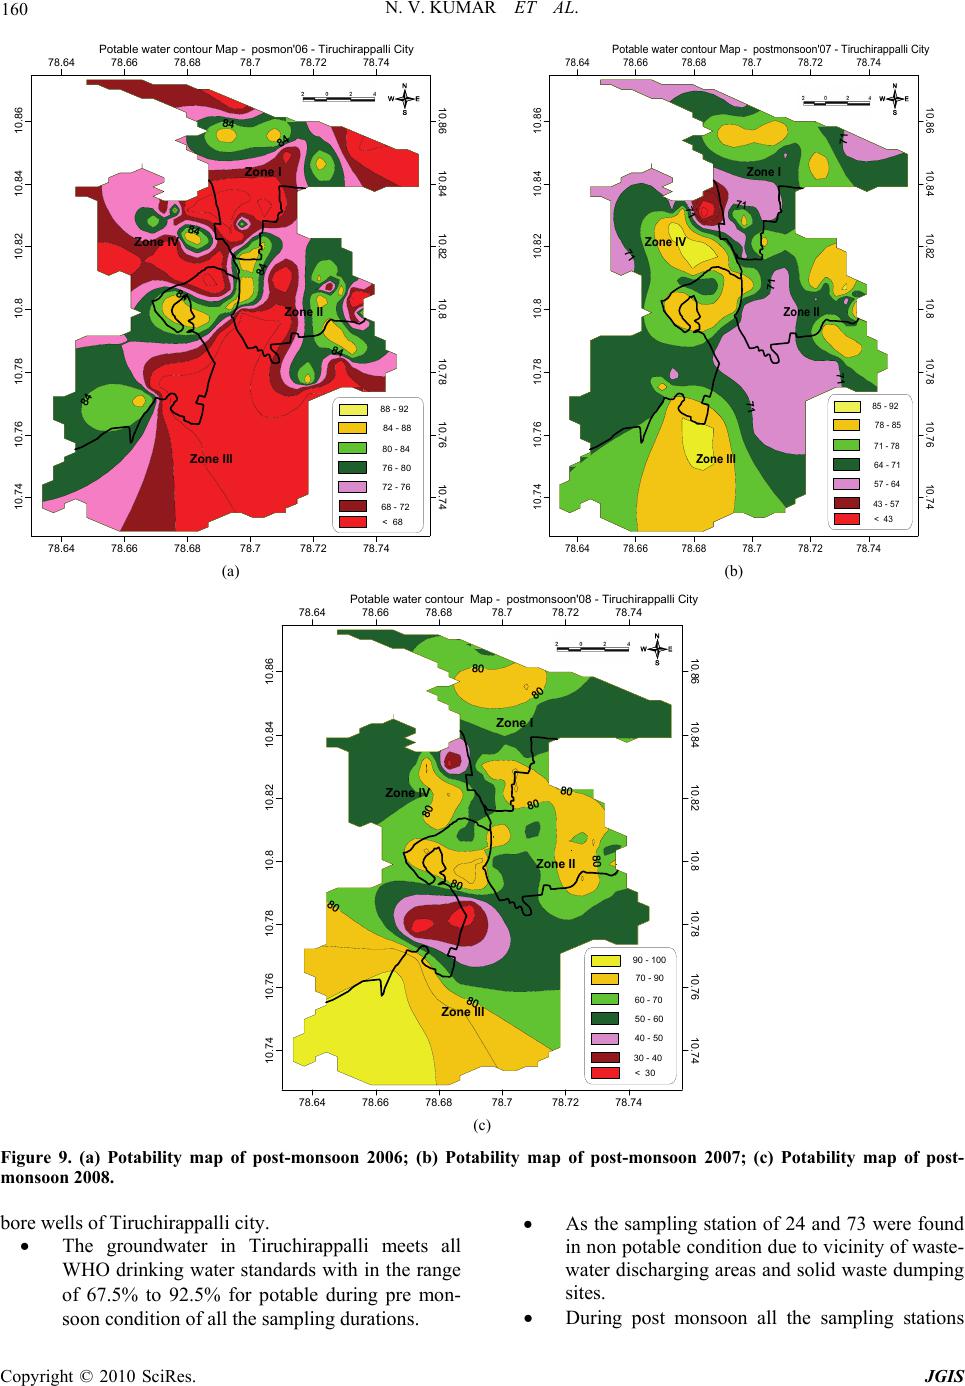 N. V. KUMAR ET AL. Copyright © 2010 SciRes. JGIS 160 78.64 78.66 78.6878.778.72 78.74 78.64 78.66 78.6878.778.72 78.74 10.74 10.76 10.7810.810.82 10.84 10.86 10.7410.7610.7810.810.8210.8410.86 Potable water contour Map - posmon'06 - Tiruchirappalli City Zone I Zone IV Zone II Zone III 84 - 88 88 - 92 80 - 84 76 - 80 72 - 76 68 - 72 < 68 (a) 78.64 78.66 78.6878.778.72 78.74 78.64 78.66 78.6878.778.72 78.74 10.74 10.76 10.7810.810.82 10.84 10.86 10.7410.7610.7810.810.8210.8410.86 Potable water contour Map - postmonsoon'07 - Tiruchirappalli City Zone I Zone IV Zone II Zone III 78 - 85 85 - 92 71 - 78 64 - 71 57 - 64 43 - 57 < 43 (b) 78.64 78.66 78.6878.778.72 78.74 78.64 78.66 78.6878.778.72 78.74 10.74 10.7610.7810.810.82 10.8410.86 10.7410.7610.7810.810.8210.8410.86 Potable water contour Map - postmonsoon'08 - Tiruchirappalli City Zone I Zone IV Zone II Zone III 70 - 90 90 - 100 60 - 70 50 - 60 40 - 50 30 - 40 < 30 (c) Figure 9. (a) Potability map of post-monsoon 2006; (b) Potability map of post-monsoon 2007; (c) Potability map of post- monsoon 2008. bore wells of Tiruchirappalli city. The groundwater in Tiruchirappalli meets all WHO drinking water standards with in the range of 67.5% to 92.5% for potable during pre mon- soon condition of all the sampling durations. As the sampling station of 24 and 73 were found in non potable condition due to vicinity of waste- water discharging areas and solid waste dumping sites. During post monsoon all the sampling stations 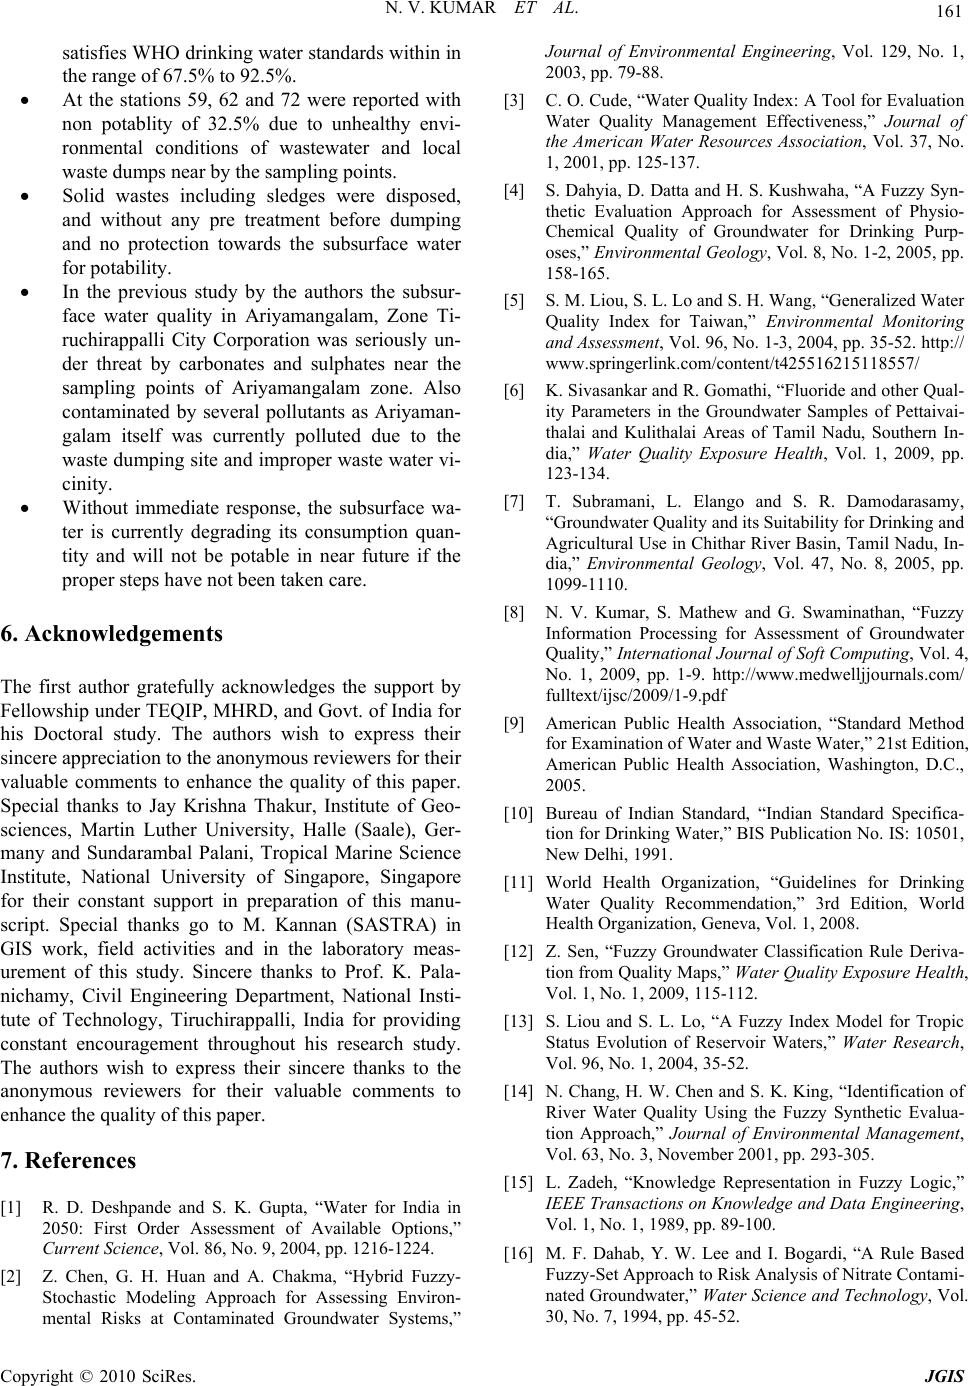 N. V. KUMAR ET AL. Copyright © 2010 SciRes. JGIS 161 satisfies WHO drinking water standards within in the range of 67.5% to 92.5%. At the stations 59, 62 and 72 were reported with non potablity of 32.5% due to unhealthy envi- ronmental conditions of wastewater and local waste dumps near by the sampling points. Solid wastes including sledges were disposed, and without any pre treatment before dumping and no protection towards the subsurface water for potability. In the previous study by the authors the subsur- face water quality in Ariyamangalam, Zone Ti- ruchirappalli City Corporation was seriously un- der threat by carbonates and sulphates near the sampling points of Ariyamangalam zone. Also contaminated by several pollutants as Ariyaman- galam itself was currently polluted due to the waste dumping site and improper waste water vi- cinity. Without immediate response, the subsurface wa- ter is currently degrading its consumption quan- tity and will not be potable in near future if the proper steps have not been taken care. 6. Acknowledgements The first author gratefully acknowledges the support by Fellowship under TEQIP, MHRD, and Govt. of India for his Doctoral study. The authors wish to express their sincere appreciation to the anonymous reviewers for their valuable comments to enhance the quality of this paper. Special thanks to Jay Krishna Thakur, Institute of Geo- sciences, Martin Luther University, Halle (Saale), Ger- many and Sundarambal Palani, Tropical Marine Science Institute, National University of Singapore, Singapore for their constant support in preparation of this manu- script. Special thanks go to M. Kannan (SASTRA) in GIS work, field activities and in the laboratory meas- urement of this study. Sincere thanks to Prof. K. Pala- nichamy, Civil Engineering Department, National Insti- tute of Technology, Tiruchirappalli, India for providing constant encouragement throughout his research study. The authors wish to express their sincere thanks to the anonymous reviewers for their valuable comments to enhance the quality of this paper. 7. References [1] R. D. Deshpande and S. K. Gupta, “Water for India in 2050: First Order Assessment of Available Options,” Current Science, Vol. 86, No. 9, 2004, pp. 1216-1224. [2] Z. Chen, G. H. Huan and A. Chakma, “Hybrid Fuzzy- Stochastic Modeling Approach for Assessing Environ- mental Risks at Contaminated Groundwater Systems,” Journal of Environmental Engineering, Vol. 129, No. 1, 2003, pp. 79-88. [3] C. O. Cude, “Water Quality Index: A Tool for Evaluation Water Quality Management Effectiveness,” Journal of the American Water Resources Association, Vol. 37, No. 1, 2001, pp. 125-137. [4] S. Dahyia, D. Datta and H. S. Kushwaha, “A Fuzzy Syn- thetic Evaluation Approach for Assessment of Physio- Chemical Quality of Groundwater for Drinking Purp- oses,” Environmental Geology, Vol. 8, No. 1-2, 2005, pp. 158-165. [5] S. M. Liou, S. L. Lo and S. H. Wang, “Generalized Water Quality Index for Taiwan,” Environmental Monitoring and Assessment, Vol. 96, No. 1-3, 2004, pp. 35-52. http:// www.springerlink.com/content/t425516215118557/ [6] K. Sivasankar and R. Gomathi, “Fluoride and other Qual- ity Parameters in the Groundwater Samples of Pettaivai- thalai and Kulithalai Areas of Tamil Nadu, Southern In- dia,” Water Quality Exposure Health, Vol. 1, 2009, pp. 123-134. [7] T. Subramani, L. Elango and S. R. Damodarasamy, “Groundwater Quality and its Suitability for Drinking and Agricultural Use in Chithar River Basin, Tamil Nadu, In- dia,” Environmental Geology, Vol. 47, No. 8, 2005, pp. 1099-1110. [8] N. V. Kumar, S. Mathew and G. Swaminathan, “Fuzzy Information Processing for Assessment of Groundwater Quality,” International Journal of Soft Computing, Vol. 4, No. 1, 2009, pp. 1-9. http://www.medwelljjournals.com/ fulltext/ijsc/2009/1-9.pdf [9] American Public Health Association, “Standard Method for Examination of Water and Waste Water,” 21st Edition, American Public Health Association, Washington, D.C., 2005. [10] Bureau of Indian Standard, “Indian Standard Specifica- tion for Drinking Water,” BIS Publication No. IS: 10501, New Delhi, 1991. [11] World Health Organization, “Guidelines for Drinking Water Quality Recommendation,” 3rd Edition, World Health Organization, Geneva, Vol. 1, 2008. [12] Z. Sen, “Fuzzy Groundwater Classification Rule Deriva- tion from Quality Maps,” Water Quality Exposure Health, Vol. 1, No. 1, 2009, 115-112. [13] S. Liou and S. L. Lo, “A Fuzzy Index Model for Tropic Status Evolution of Reservoir Waters,” Water Research, Vol. 96, No. 1, 2004, 35-52. [14] N. Chang, H. W. Chen and S. K. King, “Identification of River Water Quality Using the Fuzzy Synthetic Evalua- tion Approach,” Journal of Environmental Management, Vol. 63, No. 3, November 2001, pp. 293-305. [15] L. Zadeh, “Knowledge Representation in Fuzzy Logic,” IEEE Transactions on Knowledge and Data Engineering, Vol. 1, No. 1, 1989, pp. 89-100. [16] M. F. Dahab, Y. W. Lee and I. Bogardi, “A Rule Based Fuzzy-Set Approach to Risk Analysis of Nitrate Contami- nated Groundwater,” Water Science and Technology, Vol. 30, No. 7, 1994, pp. 45-52. 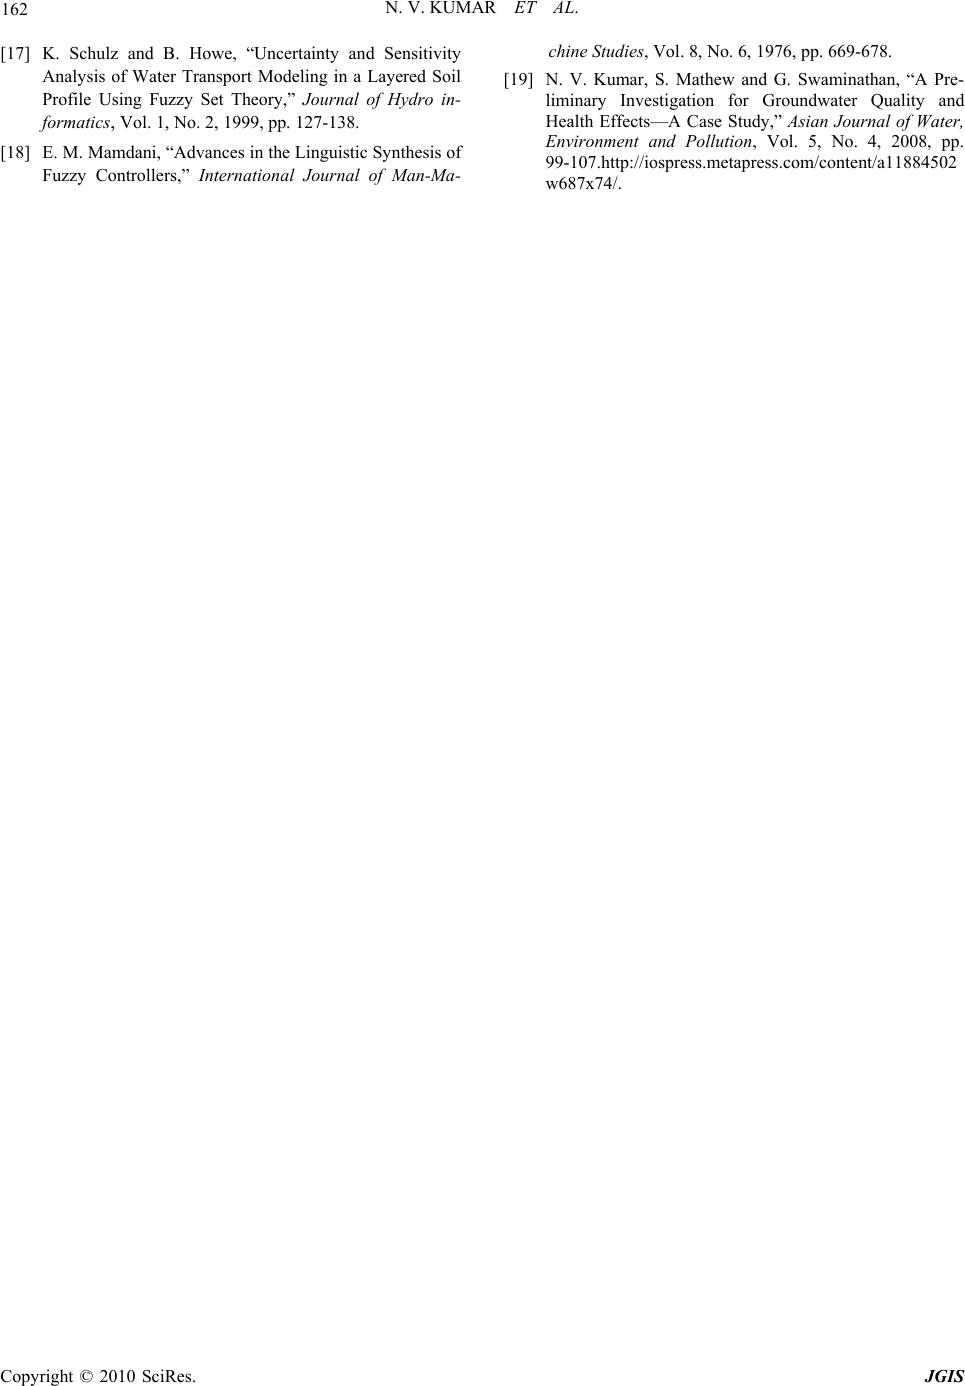 N. V. KUMAR ET AL. Copyright © 2010 SciRes. JGIS 162 [17] K. Schulz and B. Howe, “Uncertainty and Sensitivity Analysis of Water Transport Modeling in a Layered Soil Profile Using Fuzzy Set Theory,” Journal of Hydro in- formatics, Vol. 1, No. 2, 1999, pp. 127-138. [18] E. M. Mamdani, “Advances in the Linguistic Synthesis of Fuzzy Controllers,” International Journal of Man-Ma- chine Studies, Vol. 8, No. 6, 1976, pp. 669-678. [19] N. V. Kumar, S. Mathew and G. Swaminathan, “A Pre- liminary Investigation for Groundwater Quality and Health Effects—A Case Study,” Asian Journal of Water, Environment and Pollution, Vol. 5, No. 4, 2008, pp. 99-107.http://iospress.metapress.com/content/a11884502 w687x74/. |