 Open Journal of Soil Science, 2012, 9, 312-319 http://dx.doi.org/10.4236/ojss.2012.23037 Published Online September 2012 (http://www.SciRP.org/journal/ojss) Analysis of the Bacterial Communities in Lime Concretion Black Soil upon the Incorporation of Crop Residues Shao-Qiang Tao, Qiang Xia, Lin Zhu, Jing-Jing Chen, Ya-Nan Wang, Bing Qin College of Resources and Environmental Sciences, Anhui Agricultural University, Hefei, China. Email: zhulin_2002.163@163.com Received June 15th, 2012; revised July 20th, 2012; accepted July 31st, 2012 ABSTRACT To analyze the bacterial communities in lime concretion black soil upon the incorporation of crop residues for two years in wheat-maize system, total DNA was directly extracted and PCR-amplified with the F357GC and R518 primers tar- geting the 16S rRNA genes of V3 region. The amplified fragments were analyzed by perpendicular DGGE. Analyzing of species richness index S and Shannon diversity index H revealed that there was a high diversity of soil bacterial community compositions among all treatments after incorporation of crop residues and fertilizing under field conditions. Eleven DGGE bands recovered were re-amplified, sequenced. Phylogenetic analysis of the representative DGGE fin- gerprints identified four groups of the prokaryotic communities in the soil by returning wheat residues and fertilizing under field conditions. The bacterial communities belonged to gamma proteobacterium, Cupriavidus sp, halophilic eubacterium, Acidobacterium sp, Sorangium sp, delta proteobacterium, Streptococcus sp and Streptococcus agalactiae were main bacterial communities. Principal Component Analysis (PCA) showed that there were the differences in DNA profiles among the six treatments. It showed that wheat residue returning, maize residue returning and fertilizing all can improve bacterial diversity in varying degrees. As far as improvement of bacterial diversity was concerned, wheat resi- due returning was higher than fertilizing, and fertilizing higher than maize residue returning. Keywords: Crop Residues; Bacterial Community; Lime Concretion Black Soil; Denaturing Gradient Gel Electrophoresis (DGGE); 16S rDNA; Wheat-Maize System 1. Introduction Plant residues are an important source of nutrients in both natural and agricultural ecosystems, where syn- chronous plant growth and residue decomposition are essential for soil fertility. Fresh plant material (e.g. litter) represents a readily available substrate for both soil fauna and soil microorganisms. The main mineralization acti- vity is performed by soil microbial communities, and the composition of the organic residues controls the decom- position rate and the related release of nutrients [1]. It has been reported that only a small fraction of mi- croorganisms in nature are culturable. Therefore, to study the total microbial communities involved in organic ma- tter decomposition, culture-independent and culture-de- pendent are needed. Molecular techniques offer new opportunities for analysis of the structure of a microbial community [2]. In particular, sequence variation in rRNA genes has been exploited for inferring phylogenetic relation-ships among microorganisms [3] and may be used to estimate the ge- netic diversity of complex microbial communities in na- tural ecosystems [4-7]. All prokaryotes have 16S rRNA genes whose average length is about 1500 bp. There are both conserved and variable regions (the V1-V9 regions), and sufficient information has been compiled with which to conduct for reliable phylogenetic analyses [8,9]. De- naturing gradient gel electrophoresis (DGGE) allows one to directly determine the richness and evenness of the dominant microbial species using 16S rRNA gene am- plicons and, thus, to profile the corresponding microbial populations in both a qualitative way and a semiquantita- tive way [10-13]. The diversity can be estimated from the number of 16SrRNA gene sequence similarity groups (i.e. the number of DNA bands on the DGGE gel [4] and the intensity of DGGE bands. Each band is assumed to rep- resent an operational taxonomic unit, which is called a species for simplicity [14]. It is important for the typical wheat-maize cropping system of two crops a year in the Huaibei Plain (HP) to the food security of Anhui, China. The crop residues produced by the systems used to burn and bring about environment pollution, which seriously affect the sus- tainable development of agriculture. A field experiment was conducted to study the diversity of soil bacteria Copyright © 2012 SciRes. OJSS 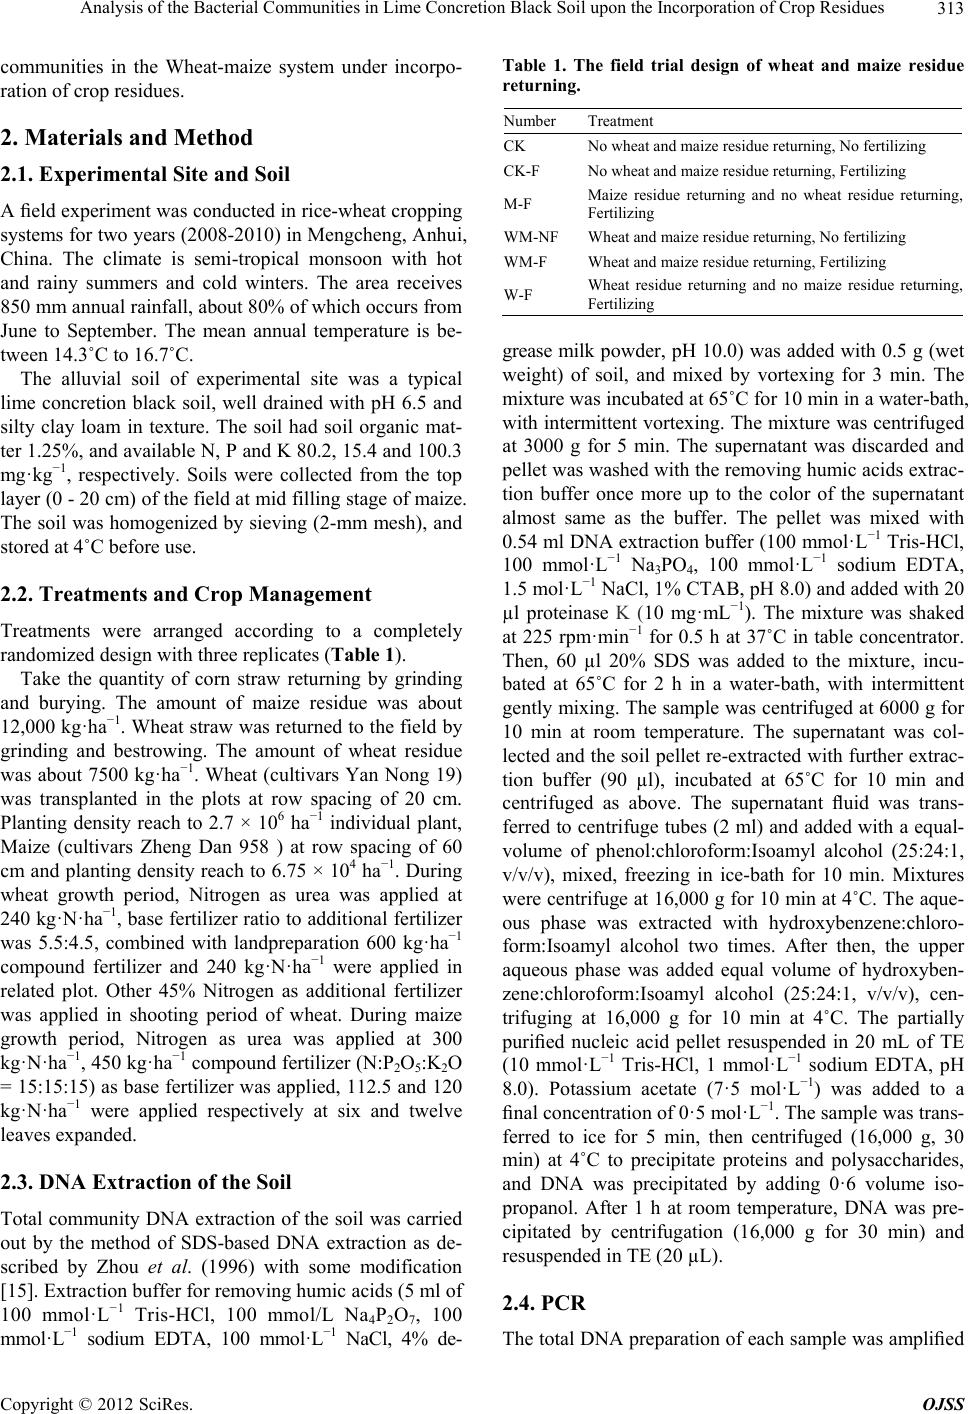 Analysis of the Bacterial Communities in Lime Concretion Black Soil upon the Incorporation of Crop Residues 313 communities in the Wheat-maize system under incorpo- ration of crop residues. 2. Materials and Method 2.1. Experimental Site and Soil A field experiment was conducted in rice-wheat cropping systems for two years (2008-2010) in Mengcheng, Anhui, China. The climate is semi-tropical monsoon with hot and rainy summers and cold winters. The area receives 850 mm annual rainfall, about 80% of which occurs from June to September. The mean annual temperature is be- tween 14.3˚C to 16.7˚C. The alluvial soil of experimental site was a typical lime concretion black soil, well drained with pH 6.5 and silty clay loam in texture. The soil had soil organic mat- ter 1.25%, and available N, P and K 80.2, 15.4 and 100.3 mg·kg−1, respectively. Soils were collected from the top layer (0 - 20 cm) of the field at mid filling stage of maiz e. The soil was homogenized by sieving (2-mm mesh), and stored at 4˚C before use. 2.2. Treatments and Crop Management Treatments were arranged according to a completely randomized design with three replicates (Table 1). Take the quantity of corn straw returning by grinding and burying. The amount of maize residue was about 12,000 kg·ha−1. Wheat straw was returned to the field by grinding and bestrowing. The amount of wheat residue was about 7500 kg·ha−1. Wheat (cultivars Yan Nong 19) was transplanted in the plots at row spacing of 20 cm. Planting density reach to 2.7 × 10⁶ ha−1 individual plant, Maize (cultivars Zheng Dan 958 ) at row spacing of 60 cm and planting density reach to 6.75 × 10⁴ ha−1. During wheat growth period, Nitrogen as urea was applied at 240 kg·N·ha−1, base fertilizer ratio to additional fertilizer was 5.5:4.5, combined with landpreparation 600 kg·ha−1 compound fertilizer and 240 kg·N·ha−1 were applied in related plot. Other 45% Nitrogen as additional fertilizer was applied in shooting period of wheat. During maize growth period, Nitrogen as urea was applied at 300 kg·N·ha−1, 450 kg·ha−1 compound fertilizer (N:P2O5:K2O = 15:15:15) as base fertilizer was applied, 112.5 and 120 kg·N·ha−1 were applied respectively at six and twelve leaves expanded. 2.3. DNA Extraction of the Soil Total community DNA extraction of the soil was carried out by the method of SDS-based DNA extraction as de- scribed by Zhou et al. (1996) with some modification [15]. Extraction buffer for removing humic acids (5 ml of 100 mmol·L−1 Tris-HCl, 100 mmol/L Na4P2O7, 100 mmol·L−1 sodium EDTA, 100 mmol·L−1 NaCl, 4% de- Table 1. The field trial design of wheat and maize residue returning. Number Treatment CK No wheat and maize residue returning, No fertilizing CK-F No wheat and maize residue returning, Fertilizing M-F Maize residue returning and no wheat residue returning, Fertilizing WM-NF Wheat and maize residue returning, No fertilizing WM-F Wheat and maize residue returning, Fertilizing W-F Wheat residue returning and no maize residue returning, Fertilizing grease milk powder, pH 10.0) was added with 0.5 g (wet weight) of soil, and mixed by vortexing for 3 min. The mixture was incubated at 65˚C for 10 min in a water-bath, with intermittent vortexing. The mixture was centrifuged at 3000 g for 5 min. The supernatant was discarded and pellet was washed with the removing humic acids extrac- tion buffer once more up to the color of the supernatant almost same as the buffer. The pellet was mixed with 0.54 ml DNA extraction buffer (100 mmol·L−1 Tris-HCl, 100 mmol·L−1 Na3PO4, 100 mmol·L−1 sodium EDTA, 1.5 mol·L−1 NaCl, 1% CTAB, pH 8.0) and added with 20 µl proteinase K (10 mg·mL−1). The mixture was shaked at 225 rpm·min−1 for 0.5 h at 37˚C in table concentrator. Then, 60 µl 20% SDS was added to the mixture, incu- bated at 65˚C for 2 h in a water-bath, with intermittent gently mixing. The sample was centrifuged at 6000 g for 10 min at room temperature. The supernatant was col- lected and the soil pellet re-extracted with further extrac- tion buffer (90 µl), incubated at 65˚C for 10 min and centrifuged as above. The supernatant fluid was trans- ferred to centrifuge tubes (2 ml) and added with a equal- volume of phenol:chloroform:Isoamyl alcohol (25:24:1, v/v/v), mixed, freezing in ice-bath for 10 min. Mixtures were centrifuge at 16,000 g for 10 min at 4˚C. The aque- ous phase was extracted with hydroxybenzene:chloro- form:Isoamyl alcohol two times. After then, the upper aqueous phase was added equal volume of hydroxyben- zene:chloroform:Isoamyl alcohol (25:24:1, v/v/v), cen- trifuging at 16,000 g for 10 min at 4˚C. The partially purified nucleic acid pellet resuspended in 20 mL of TE (10 mmol·L−1 Tris-HCl, 1 mmol·L−1 sodium EDTA, pH 8.0). Potassium acetate (7·5 mol·L−1) was added to a final concentration of 0·5 mol·L−1. The sample was trans- ferred to ice for 5 min, then centrifuged (16,000 g, 30 min) at 4˚C to precipitate proteins and polysaccharides, and DNA was precipitated by adding 0·6 volume iso- propanol. After 1 h at room temperature, DNA was pre- cipitated by centrifugation (16,000 g for 30 min) and resuspended in TE (20 µL). 2.4. PCR The total DNA preparation of each sample was amplified Copyright © 2012 SciRes. OJSS  Analysis of the Bacterial Communities in Lime Concretion Black Soil upon the Incorporation of Crop Residues 314 by PCR with a 2720 Thermal Cycler (Applied Bio-sys- tems, USA). The variable V3 region of 16S rRNA gene sequences from nucleotide 8 to nucleotide 1512 (Es- cherichia coli numbering) was amplified by PCR by us- ing eubacterial primers 27 F (5’-AGAGTTTGATCC- TGGCTCAG-3’ ) and 1492 R (5’-GGTTACCTTGTT- ACGACTT-3’) at first, and then nested PCR was per- formed by using primers F357(5’-GC-CCTACGGG- AGGCAGCAG-3’) together with a GC clamp (5’ CgCCCgCCgC-gCgCggCgggCggggCgggggCACggggg- g-3’) and R518 (5’-ATT ACC GCG GCT GCT GG-3’) and the hot-start touchdown protocol described by Muy- zer et al [2]. DNA extracted from the soil was amplified with a PCR mixture (25 μl) containing 2.5 μl of Mg- containing 10 × buffer, 2 μl of a 2.5 mmol·L−1 de-oxynu- cleoside triphosphate mixture, 5 pmol of forward and reverse primers respectively, 1 μl of the DNA solution (1:10 dilution of DNA extraction), and 0.75 μl of Ex- pand High Fidelity DNA polymerase ((TaKaRa). The polymerase was added after a hot-start procedure (5 min at 94˚C, followed by 5 min at 80˚C). PCR was performed with a 2720 Thermal Cycler by using the following pro- tocol: 1 min at 94˚C (denaturation), 45 s at 65˚C (anneal- ing,), and 3 min at 72˚C (elongation) with a 0.5˚C touch- down every cycle during annealing for 20 cycles, fol- lowed by 10 cycles with an annealing temperature of 55˚C and a final cycle consisting of 10 min at 72˚C. The absorbances of the DNA at wavelengths of 230, 260, 280 and 320 nm were determined with a spectro- photometer (NanoDrop® ND-1000, Thermo, USA) and 1% agarose gels were run to visualize the integrity of the DNA. 2.5. DGGE DGGE was performed using DcodeTM Universal Muta- tion Detection System (Bio-Rad, Hercules, CA, USA). For each sample, 400 ng of PCR product was loaded onto a poly-acrylamide gel (8%, wt/vol) with a 45% to 65% denaturant gradient, A denaturing gradient consisting of 100% denaturant is defined as 7 M urea with 40 % (v/v) Electrophoresis was carried out at 100 v for 16 h (with an initial 30 min at 40 v ) at 60˚C in 0.5 × TAE buffer (4.84 g of Tris base per liter, 11.42 ml of acetic acid per liter, 20 ml of 0.5 M EDTA per liter; pH 8.0). Gels were stained in 1:10,000 (v/v) SYBR® GreenⅠ for 30 min and visualized under UV irradiance. Gel images were cap- tured with a Gel Doc-ItTM documentation system. DGGE bands migrating to the same position in different lanes in the gel were considered to have the same sequence. The scanned gels containing DNA band profiles were ana- lyzed to determine the intensity of each band using Quantity One 4.6 software (Bio-Rad, Hercules, CA, USA). Selected bands were cut from DGGE gels and transferred to 1.5 ml micro tubes and purified by using Agarose Gel DNA purification Kit (TaKaRa), and were sub cloned into the pMD18-T vector, then transformed into E. coli strain DH5α and sequenced. 2.6. Data Analyses DNA sequence analyses were edited and reformatted using the ChromasPro software. A similarity search for the nucleotide sequences of 16S rDNA genes of the test isolates was carried out online at http://www.ncbi.nlm.nih.gov using the BLAST search program for the nucleotide database maintained in Gen- Bank. Finally, the test sequences were compared with those of selected related species and the phylogenetic relationship of these sequences was determined by MEGA4 software. Bacterial diversity in the samples was estimated in two different ways: as S, species richness (the number of DGGE fragments detected disregarding their relative intensities), and H, the Shannon index of bacterial diversity. The Shannon diversity index was calculated as (H) = −ΣPilnPi = −Σ(Ni/N)ln(Ni/N) based on the relative band intensities, as formulated by Eichner et al. [16]. Pi was defined as ni/N, where Ni is the area of a peak in intensity and N the sum of all peak areas in the lane profiles. To estimate the diversity of bacterial communities in lime concretion black soil after the incorporation of crop residues in wheat-maize system, the data obtained from the DGGE patterns, based on band intensity and position, were analyzed by principal component analysis. Principal component analysis was performed using SPSS (version 16.0). 3. Results 3.1. DNA Extraction from Soil Samples and Specific PCR Amplification of 16S rRNA Genes DNA extracted from each soil sample of 6 treatments has much high integrality. The DNA contents of the crude extracts were measured. The A260/A230 absorbance ratio indicates polysaccharide or polyphenolic contamination, and the A260/A280 ratio indicates protein contamination [17]. The A260/A280 ratios of DNA extraction from soil samples were all about 1.4, but the A260/A230 ratios were all about 0.7. It suggested that humic acid had yet not been wiped out fully from the DNA extraction The target gene for the bacterial communities could successfully be amplified in all extracts Using primers 27 F and 1492 R, a special DNA fragment amplified by first round PCR was gained in each soil samples The length of the special DNA fragment was about 1533 bp. At second round PCR Using primers F357 and R518, a special DNA fragment (234 bp) was obtained in each soil samples by diluting the product of the first round PCR 1:100 as template. Copyright © 2012 SciRes. OJSS 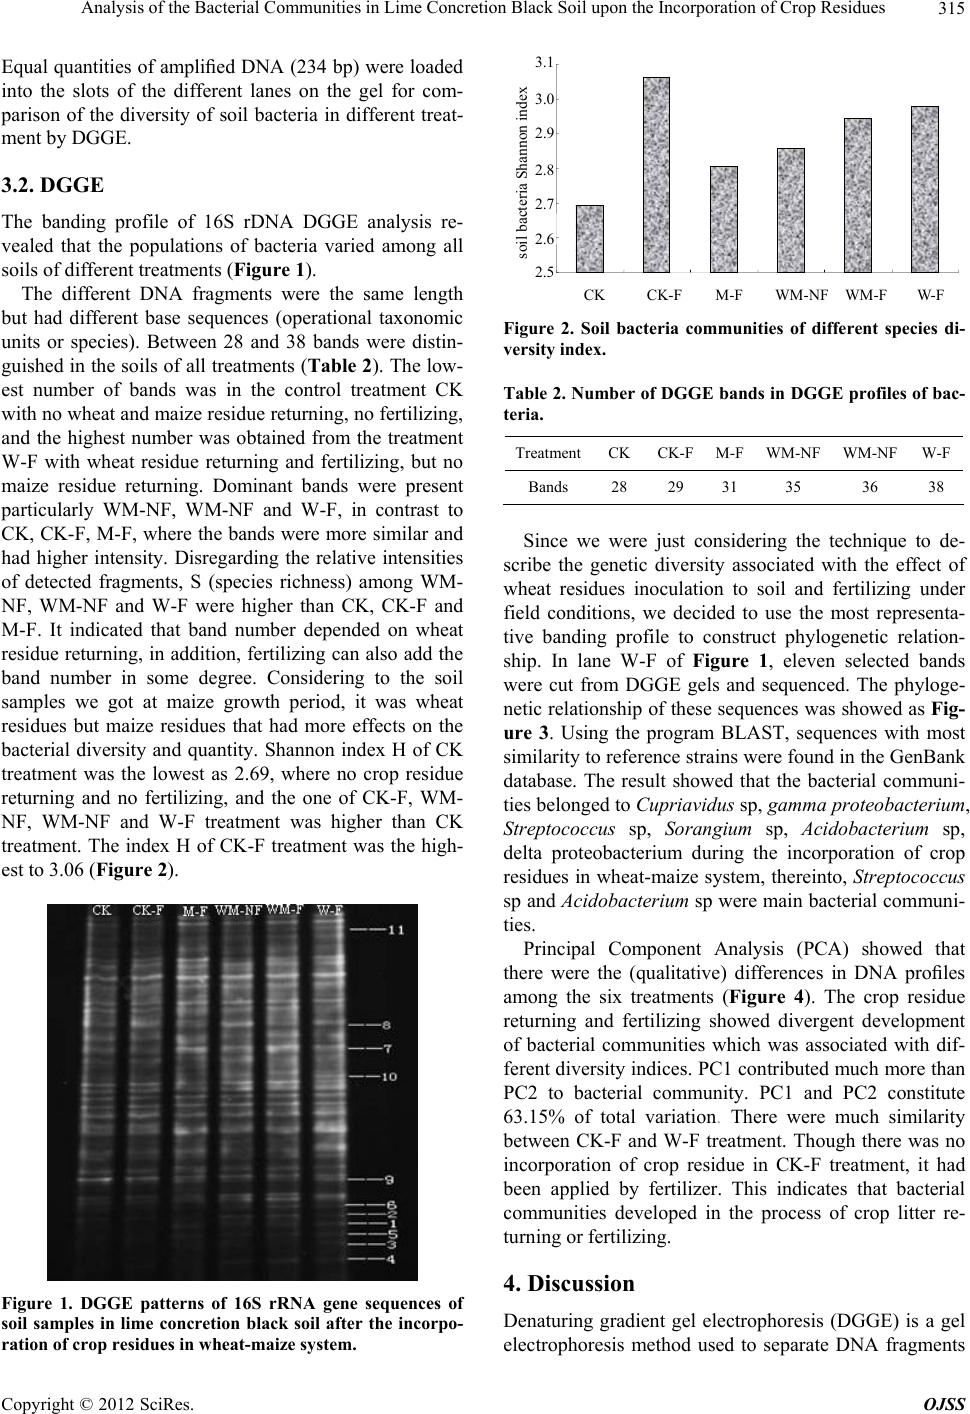 Analysis of the Bacterial Communities in Lime Concretion Black Soil upon the Incorporation of Crop Residues 315 Equal quantities of amplified DNA (234 bp) were loaded into the slots of the different lanes on the gel for com- parison of the diversity of soil bacteria in different treat- ment by DGGE. 3.2. DGGE The banding profile of 16S rDNA DGGE analysis re- vealed that the populations of bacteria varied among all soils of different treatments (Figure 1). The different DNA fragments were the same length but had different base sequences (operational taxonomic units or species). Between 28 and 38 bands were distin- guished in the soils of all treatments (Table 2 ). The low- est number of bands was in the control treatment CK with no wheat and maize residue returning, no fertilizing, and the highest number was obtained from the treatment W-F with wheat residue returning and fertilizing, but no maize residue returning. Dominant bands were present particularly WM-NF, WM-NF and W-F, in contrast to CK, CK-F, M-F, where the bands were more similar and had higher intensity. Disregarding the relative intensities of detected fragments, S (species richness) among WM- NF, WM-NF and W-F were higher than CK, CK-F and M-F. It indicated that band number depended on wheat residue returning, in addition, fertilizing can also add the band number in some degree. Considering to the soil samples we got at maize growth period, it was wheat residues but maize residues that had more effects on the bacterial diversity and quantity. Shannon index H of CK treatment was the lowest as 2.69, where no crop residue returning and no fertilizing, and the one of CK-F, WM- NF, WM-NF and W-F treatment was higher than CK treatment. The index H of CK-F treatment was the high- est to 3.06 (Figure 2). Figure 1. DGGE patterns of 16S rRNA gene sequences of soil samples in lime concretion black soil after the incorpo- ration of crop residues in wheat-maize system. 2.5 2.6 2.7 2.8 2.9 3.0 3.1 CKCK-F M-F WM-NF WM-FW-F soil bacteria Shannon index Figure 2. Soil bacteria communities of different species di- versity index. Table 2. Number of DGGE bands in DGGE profiles of bac- teria. TreatmentCK CK-F M-F WM-NF WM-NFW-F Bands 28 29 31 35 36 38 Since we were just considering the technique to de- scribe the genetic diversity associated with the effect of wheat residues inoculation to soil and fertilizing under field conditions, we decided to use the most representa- tive banding profile to construct phylogenetic relation- ship. In lane W-F of Figure 1, eleven selected bands were cut from DGGE gels and sequenced. The phyloge- netic relationship of these sequences was showed as Fig- ure 3. Using the program BLAST, sequences with most similarity to reference strains were found in the GenBank database. The result showed that the bacterial communi- ties belonged to Cupriavidus sp, gamma proteobacterium, Streptococcus sp, Sorangium sp, Acidobacterium sp, delta proteobacterium during the incorporation of crop residues in wheat-maize system, thereinto, Streptococcus sp and Acidobacterium sp were main bacterial communi- ties. Principal Component Analysis (PCA) showed that there were the (qualitative) differences in DNA profiles among the six treatments (Figure 4). The crop residue returning and fertilizing showed divergent development of bacterial communities which was associated with dif- ferent diversity indices. PC1 contributed much more than PC2 to bacterial community. PC1 and PC2 constitute 63.15% of total variation. There were much similarity between CK-F and W-F treatment. Though there was no incorporation of crop residue in CK-F treatment, it had been applied by fertilizer. This indicates that bacterial communities developed in the process of crop litter re- turning or fertilizing. 4. Discussion Denaturing gradient gel electrophoresis (DGGE) is a gel electrophoresis method used to separate DNA fragments Copyright © 2012 SciRes. OJSS 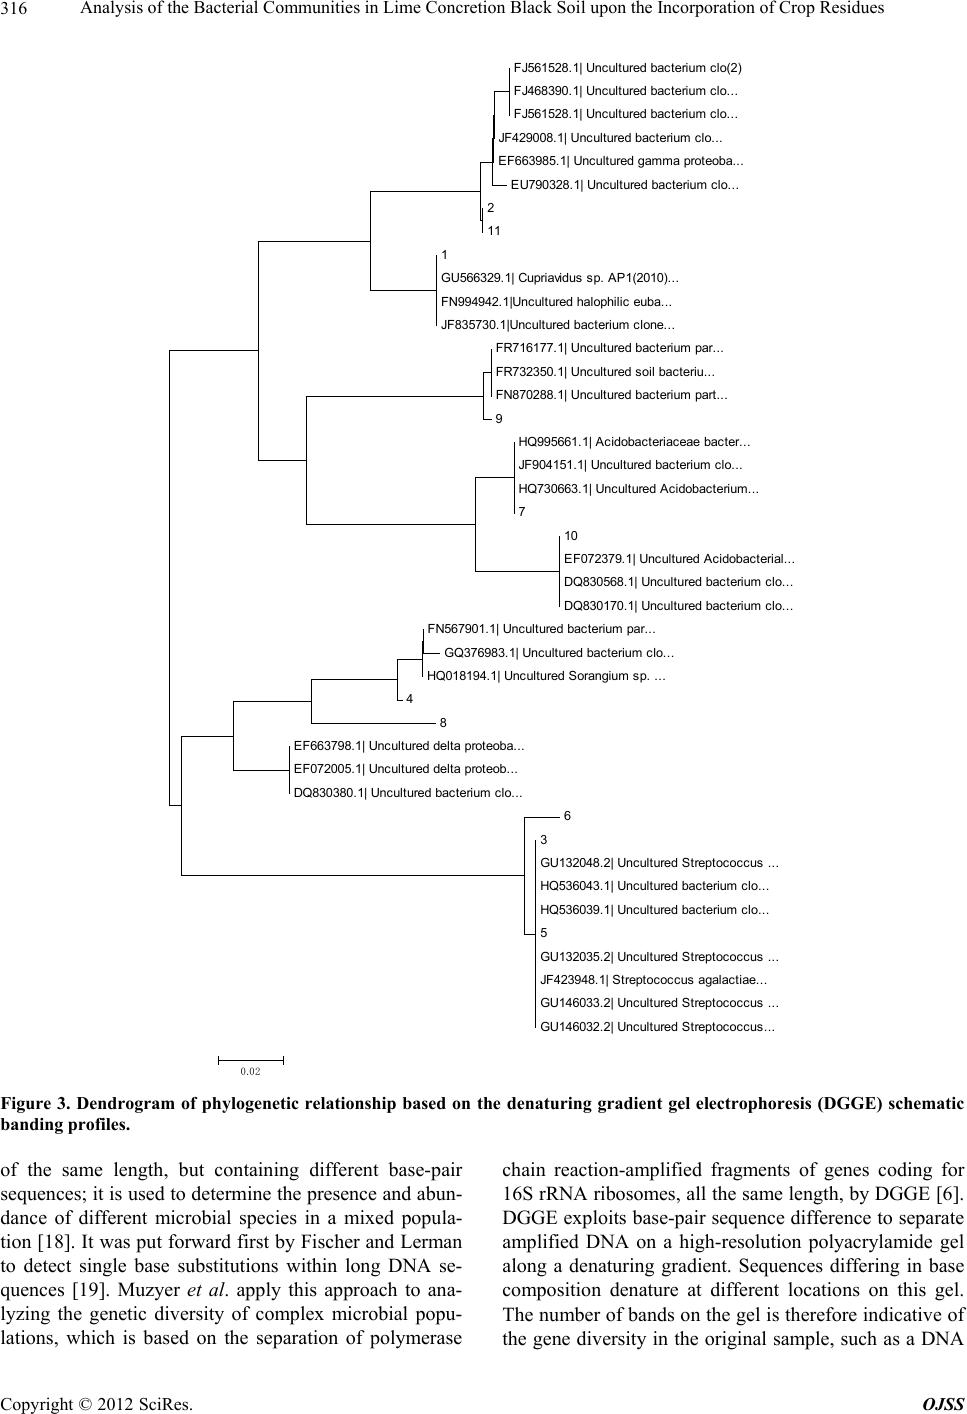 Analysis of the Bacterial Communities in Lime Concretion Black Soil upon the Incorporation of Crop Residues Copyright © 2012 SciRes. OJSS 316 FJ561528. 1| Uncul tured bac terium clo(2) FJ468390. 1| Uncul t ured bac terium clo. . . FJ561528. 1| Uncul t ured bac terium clo. . . JF429008. 1| Uncul t ured bact erium clo. .. EF 663985. 1| Unc ul t ured gam m a prot eoba. . . EU790328. 1| Unc ul t ured bacteri um c l o. .. 2 11 1 GU566329. 1| Cupriavidus sp. A P1(2010)... FN994942. 1|Unc ultured hal ophi l i c euba. . . JF835730. 1|Unc ul tured bacteri um clone... FR716177.1| Unc ul tured bacteri um par. .. FR732350.1| Unc ul tured soil bacteri u... FN870288.1| Unc ul tured bacteri um part ... 9 HQ995661.1| A ci dobacteriac eae bacter... JF904151. 1| Unc ul tured bact erium clo... HQ730663.1| Unc ul t ured A ci dobacterium... 7 10 E F072379. 1| Unc ul t ured A ci dobacterial... DQ830568. 1| Unc ul tured bact erium clo... DQ830170. 1| Unc ul tured bact erium clo... FN567901. 1| Unc ultured bact eri um par. .. GQ376983. 1| Unc ul t ured bac teri um c l o... HQ018194. 1| Unc ul tured Sorangi um sp. ... 4 8 E F 663798. 1| Uncul tured delta proteoba... E F 072005. 1| Uncul tured delta proteob... DQ830380. 1| Uncul t ured bac terium clo. . . 6 3 GU132048.2| Unc ul t ured S t reptococcus . . . HQ536043.1| Unc ul t ured bac teri um c l o... HQ536039.1| Unc ul t ured bac teri um c l o... 5 GU132035.2| Unc ul t ured S t reptococcus . . . JF423948. 1| S treptococ cus agalact i ae... GU146033.2| Unc ul t ured S t reptococcus . . . GU146032.2| Unc ul t ured S t reptococcus . . . 0.02 Figure 3. Dendrogram of phylogenetic relationship based on the denaturing gradient gel electrophoresis (DGGE) schematic banding profiles. of the same length, but containing different base-pair sequences; it is used to determine the presence and abun- dance of different microbial species in a mixed popula- tion [18]. It was put forward first by Fischer and Lerman to detect single base substitutions within long DNA se- quences [19]. Muzyer et al. apply this approach to ana- lyzing the genetic diversity of complex microbial popu- lations, which is based on the separation of polymerase chain reaction-amplified fragments of genes coding for 16S rRNA ribosomes, all the same length, by DGGE [6]. DGGE exploits base-pair sequence difference to separate amplified DNA on a high-resolution polyacrylamide gel along a denaturing gradient. Sequences differing in base composition denature at different locations on this gel. The number of bands on the gel is therefore indicative of the gene diversity in the original sample, such as a DNA 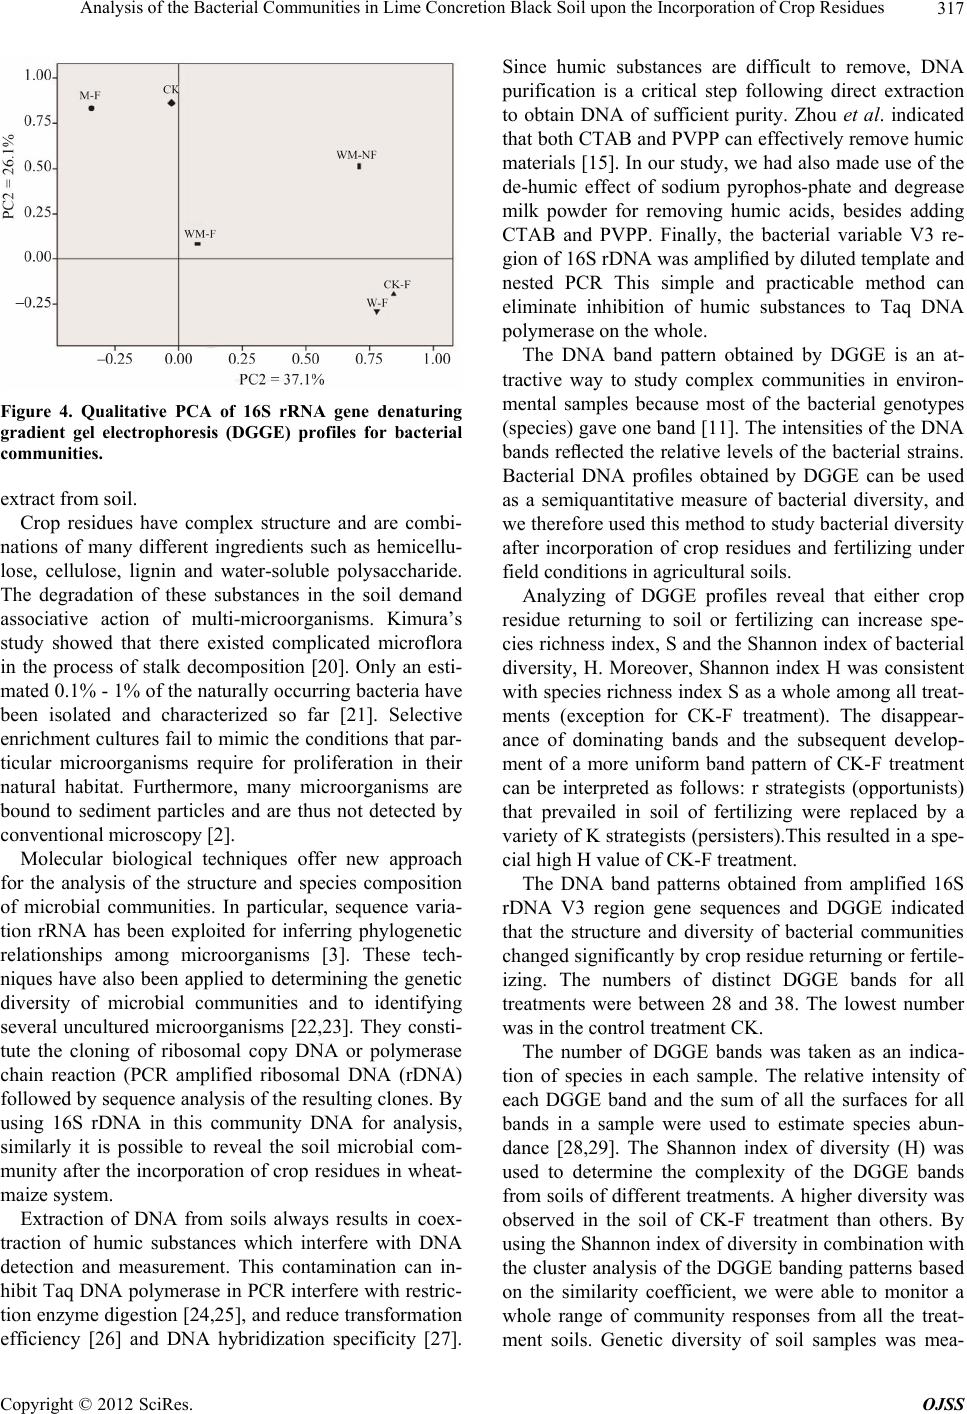 Analysis of the Bacterial Communities in Lime Concretion Black Soil upon the Incorporation of Crop Residues 317 Figure 4. Qualitative PCA of 16S rRNA gene denaturing gradient gel electrophoresis (DGGE) profiles for bacterial communities. extract from soil. Crop residues have complex structure and are combi- nations of many different ingredients such as hemicellu- lose, cellulose, lignin and water-soluble polysaccharide. The degradation of these substances in the soil demand associative action of multi-microorganisms. Kimura’s study showed that there existed complicated microflora in the process of stalk decomposition [20]. Only an esti- mated 0.1% - 1% of the naturally occurring bacteria have been isolated and characterized so far [21]. Selective enrichment cultures fail to mimic the conditions that par- ticular microorganisms require for proliferation in their natural habitat. Furthermore, many microorganisms are bound to sediment particles and are thus not detected by conventional microscopy [2]. Molecular biological techniques offer new approach for the analysis of the structure and species composition of microbial communities. In particular, sequence varia- tion rRNA has been exploited for inferring phylogenetic relationships among microorganisms [3]. These tech- niques have also been applied to determining the genetic diversity of microbial communities and to identifying several uncultured microorganisms [22,23]. They consti- tute the cloning of ribosomal copy DNA or polymerase chain reaction (PCR amplified ribosomal DNA (rDNA) followed by sequence analysis of the resulting clones. By using 16S rDNA in this community DNA for analysis, similarly it is possible to reveal the soil microbial com- munity after the incorporation of crop residues in wheat- maize system. Extraction of DNA from soils always results in coex- traction of humic substances which interfere with DNA detection and measurement. This contamination can in- hibit Taq DNA polymerase in PCR interfere with restric- tion enzyme digestion [24,25], and reduce transformation efficiency [26] and DNA hybridization specificity [27]. Since humic substances are difficult to remove, DNA purification is a critical step following direct extraction to obtain DNA of sufficient purity. Zhou et al. indicated that both CTAB and PVPP can effectively remove humic materials [15]. In our study, we had also made use of the de-humic effect of sodium pyrophos-phate and degrease milk powder for removing humic acids, besides adding CTAB and PVPP. Finally, the bacterial variable V3 re- gion of 16S rDNA was amplified by diluted template and nested PCR This simple and practicable method can eliminate inhibition of humic substances to Taq DNA polymerase on the whole. The DNA band pattern obtained by DGGE is an at- tractive way to study complex communities in environ- mental samples because most of the bacterial genotypes (species) gave one band [11]. The intensities of the DNA bands reflected the relative levels of the bacterial strains. Bacterial DNA profiles obtained by DGGE can be used as a semiquantitative measure of bacterial diversity, and we therefore used this method to study bacterial diversity after incorporation of crop residues and fertilizing under field conditions in agricultural soils. Analyzing of DGGE profiles reveal that either crop residue returning to soil or fertilizing can increase spe- cies richness index, S and the Shannon index of bacterial diversity, H. Moreover, Shannon index H was consistent with species richness index S as a whole among all treat- ments (exception for CK-F treatment). The disappear- ance of dominating bands and the subsequent develop- ment of a more uniform band pattern of CK-F treatment can be interpreted as follows: r strategists (opportunists) that prevailed in soil of fertilizing were replaced by a variety of K strategists (persisters).This resulted in a spe- cial high H value of CK-F treatment. The DNA band patterns obtained from amplified 16S rDNA V3 region gene sequences and DGGE indicated that the structure and diversity of bacterial communities changed significantly by crop residue returning or fertile- izing. The numbers of distinct DGGE bands for all treatments were between 28 and 38. The lowest number was in the control treatment CK. The number of DGGE bands was taken as an indica- tion of species in each sample. The relative intensity of each DGGE band and the sum of all the surfaces for all bands in a sample were used to estimate species abun- dance [28,29]. The Shannon index of diversity (H) was used to determine the complexity of the DGGE bands from soils of different treatments. A higher diversity was observed in the soil of CK-F treatment than others. By using the Shannon index of diversity in combination with the cluster analysis of the DGGE banding patterns based on the similarity coefficient, we were able to monitor a whole range of community responses from all the treat- ment soils. Genetic diversity of soil samples was mea- Copyright © 2012 SciRes. OJSS  Analysis of the Bacterial Communities in Lime Concretion Black Soil upon the Incorporation of Crop Residues 318 sured as bands on denaturing gradient gel electrophoresis (DGGE) of amplified 16S rDNA sequences from the soil community DNAs. When analysed by Shannon index (H), the highest genetic biodiversity (H = 3.061) was found in CK-F treatment with no wheat and maize resi- due returning but fertilizing; the poorest biodiversity (H = 2.692) in control treatment (CK) with no wheat and maize residue returning, no fertilizing. The Shannon- Weaver diversity index (H) was calculated from the DGGE profiles for each treatment. High H indicates a high diversity in the microbial community. In the present study, considerable qualitative differences in the com- munity structure were found in the six treatments. With CK-F and W-F (wheat residue returning and no maize residue returning, fertilizing) treatments, the bacterial diversity was higher than with the other treatments, indi- cating that the fertilizing and wheat residue returning possibly enhanced the microbial community. Simultaneously, the bacterial diversity of CK treat- ment was lower than the one of other treatments accord- ing to Shannon index of diversity. We can infer that the bacterial diversity be closely related to the crop residue returning and fertilizing which add nutriment for bacteria. The number and intensity of bands on denaturing gradi- ent gel electrophoresis among all treatments were diffe- rent. It showed that the predominant bacteria in each treatment were different. Wheat residue returning, maize residue returning and fertilizing all can improve bacterial diversity in varying degrees. Contribution of PC1 was about 37.1%, and the one of PC2 was about 26.1% (Figure 4). The result of principal component analysis (PCA) showed that bacte- rial community of CK and M-F treatment was different from the one of the others. The difference of them lied with that there was no wheat residue returning in CKand M-F treatment. On the other hand, CK-F treatment had the highest index H to 3.06 (Figure 2). It suggested that fertilizing have much effect on bacterial community un- der no crop residue returning. In conclusion, as far as improvement of bacterial diversity is concerned, wheat residue returning was higher than fertilizing, and fertiliz- ing higher than maize residue returning. The results of this study clearly demonstrate the im- pacts of crop residue returning and fertilizing on the bac- terial community composition of soils. The extensive cloning and sequencing of PCR-DGGE bands proved to be a powerful tool in assessing community structure dif- ferences in soils. Our future objectives in studying the impacts of management on microbial populations are aimed at attempting to understand the relationships which may exist between microbial community structure and function. In conclusion, microbial diversity increased during the course of crop residue returning to soil or fertilizing. Not only crop residue returning to soil but also fertilizing affected the development of bacterial community. The effect of interaction between crop residue returning to soil and fertilizing on soil bacterial community need making a further investigation. 5. Acknowledgements This work was supported by grants From the National Natural Science Foundation of China (Grant No. 2007- BAD89B10) and Anhui Nature Science Foundation, China (Grant No.090411026). REFERENCES [1] C. L. Neely, M. H. Beare, W. L. Hargrove and D. C. Coleman, “Relationships between Fungal and Bacterial Substrate-Induced Respiration, Biomass and Plant Resi- due Decomposition,” Soil Biology and Biochemistry, Vol. 23, No. 3, 1991, pp. 947-954. doi:10.1016/0038-0717(91)90175-J [2] G. Muyzer, E. C. De Waal and A. G. Uitterlinden, “Pro- filing of Complex Microbial Populations by Denaturing Gradient Gel Electrophoresis Analysis of Polymerase Chain Reaction-Amplified Gene Coding for 16S rRNA,” Applied and Environmental Microbiology, Vol. 59, No. 3, 1993, pp. 695-700. [3] C. R. Woese, “Bacterial Evolution,” Microbiological Reviews, Vol. 51, No. 2, 1987, pp. 221-271. [4] S. Kim-Jong, M. Sakai, A. Hosoda, T. Matsuguchi and J. S. Kim, “Application of DGGE Analysis to the Study of Bacterial Community Structure in Plant Roots and in Nonrhizosphere Soil,” Soil Science and Plant Nutrition, Vol. 45, No. 2, 1999, pp. 493-497. doi:10.1080/00380768.1999.10409364 [5] A. E. McCaig, L. Glover and J. I. Posser, “Molecular Analysis of Bacterial Community Structure and Diversity in Unimproved and Improved Upland Grassland Pas- tures,” Applied and Environmental Microbiology, Vol. 65, No. 4, 1999, pp. 1721-1730. [6] G. Muyzer, “DGGE/TGGE: A Method for Identifying Genes from Natural Ecosystems,” Current Opinion Mi- crobioogy, Vol. 2, No. 3, 1999, pp. 317-322. doi:10.1016/S1369-5274(99)80055-1 [7] U. Nübel, F. Garcia-Pichel, M. Kühl and G. Muyzer, “Quantifying Microbial Diversity: Morphotypes, 16S rRNA Genes, and Carotinoids of Oxygenic Phototrophs in Microbial Mats,” Applied and Environmental Micro- biology, Vol. 65, No. 2, 1999, pp. 422-430. [8] R. I. Amann, W. Ludwig and K. H. Schileifer, “Phyloge- netic Identification and in Situ Detection of Individual Microbial Cells without Cultivation,” Microbiology and Molecular Biology Reviews, Vol. 59, No. 1, pp. 143-169. [9] J. M. Neefs and R. De Wachter, “A Proposal for the Sec- ondary Structure of a Variable Area of Eukaryotic Small Ribosomal Subunit RNA Involving the Existence of a Pseudoknot,” Nucleic Acids Research, Vol. 18, No. 19, 1990, pp. 5695-5704. doi:10.1093/nar/18.19.5695 Copyright © 2012 SciRes. OJSS  Analysis of the Bacterial Communities in Lime Concretion Black Soil upon the Incorporation of Crop Residues Copyright © 2012 SciRes. OJSS 319 [10] J. Bloem and A. M. Breure, “Bioindicators/Biomonitors- Principles, Assessment, Concepts,” In: B. A. Markert, A. M. Breure and H. G. Zechmeister, Eds., Microbial Indi- cators, Elsevier, Amsterdam, 2003, pp. 259-282. [11] O. Dilly, J. Bloem, A. Vos and J. C. Munch, “Bacterial Diversity in Agricultural Soils during Litter Decomposi- tion,” Applied and Environmental Microbiology, Vol. 70, No. 1, 2004, pp. 468-474. doi:10.1128/AEM.70.1.468-474.2004 [12] B. S. Griffiths, K. Ritz, R. Wheatly, H. L. Kuan, B. Boag, S. Christensen, F. Ekelund, S. J. Sørensen, S. Muller and J. Bloem, “An Examination of the Biodiversity-Ecosys- tem Function Relationship in Arable Soil Microbial Communities,” Soil Biology and Biochemistry, Vol. 33, No. 12-13, 2001, pp. 1713-1722. [13] K. Westergaard, A. K. Müller, S. Christensen, J. Bloem and S. J. Sørensen, “Effects of Tylosin as a Disturbance on the Soil Microbial Community,” Soil Biology and Bio- chemistry, Vol. 33, No. 15, 2001, pp. 2061-2071. doi:10.1016/S0038-0717(01)00134-1 [14] J. B. Hughes, J. J. Hellmann, T. H. Ricketts and B. J. M. Bohannan, “Counting the Uncountable: Statistical Ap- proaches to Estimating Microbial Diversity,” Applied and Environmental Microbiology, Vol. 67, No. 10, 2001, pp. 4399-4406. doi:10.1128/AEM.67.10.4399-4406.2001 [15] J. Zhou, M. A. Bruns and J. M. Tiedje, “DNA Recovery from Soils of Diverse Composition,” Applied and Envi- ronmental Microbiology, Vol. 62, No. 2, 1996, pp. 316- 322. [16] C. A. Eichner, R. W. Erb, K. N. Timmis and I. Wagner- DÖbler, “Thermal Gradient Gel Electrophoresis Analysis of Bioprotection from Pollutant Shocks in the Activated Sludge Microbial Community,” Applied and Environ- mental Microbiology, Vol. 65, No. 1, 1999, pp. 102-109. [17] J. Logemann, J. Schell and L. Willmitzer, “Improved Method for the Isolation of RNA from Plant Tissues,” Analytical Biochemistry, Vol. 163, No. 1, 1987, pp. 16-20. doi:10.1016/0003-2697(87)90086-8 [18] L. D. Stetzenbach and M. V. Yates, “Dictionary of Envi- ronmental Microbiology,” Academic Press, London, 2003. [19] S. G. Fischer and L. S. Lerman, “DNA Fragments Dif- fering by Single Basepair Substitutions Are Separated in Denaturing Gradient Gels: Correspondence with Melting Theory,” Proceeding of the National Academy Sciences of the United States of America, Vol. 80, No. 6, 1983, pp. 1579-1583. doi:10.1073/pnas.80.6.1579 [20] M. Kimura and C. C. Tun, “Microscopic Observation of the Decomposition Process of Leaf Sheath of Rice Straw and Colonizing Microorganisms during the Cultivation Period of Paddy Rice,” Soil Science and Plant Nutrition, Vol. 45, No. 2, 1999, pp. 427-437. doi:10.1080/00380768.1999.10409357 [21] D. M. Ward, M. M. Bateson, R. Weller and A. L. Ruff-Roberts, “Ribosomal RNA Analysis of Microorgan- isms as They Occur in Nature,” Advances in Microbial Ecology, Vol. 12, 1992, pp. 219-286. doi:10.1007/978-1-4684-7609-5_5 [22] S. J. Giovannoni, T. B. Britschgi, C. L. Moyer and K. G. Field, “Genetic Diversity in Sargasso Sea Bacterioplank- ton,” Nature, Vol. 345, No. 3, 1990, pp. 60-63. doi:10.1038/345060a0 [23] D. M. Ward, R. Weller and M. M. Bateson, “16S rRNA Sequences Reveal Numerous Uncultured Microorganisms in a Natural Community,” Nature, Vol. 345, No. 3, 1990, pp. 63-65. doi:10.1038/345063a0 [24] K. Smalla, N. Cresswell, L. C. Mendonca-Hagler, A. Wolters and J. D. Van Elsas, “Rapid DNA Extraction Protocol from Soil for Polymerase Chain Reaction-Me- diated Amplification,” Journal Applied Microbiology, Vol. 74, No. 1, 1993, pp. 78-85. [25] Y. L. Tsai and B. H. Olson, “Rapid Method for Separa- tion of Bacterial DNA from Humic Substances in Sedi- ments for Polymerase Chain Reaction,” Applied and En- vironmental Microbiology, Vol. 58, No. 7, 1992, pp. 2292-2295. [26] C. C. Tebbe and W. Vahjen, “Interference of Humic Ac- ids and DNA Extracted Directly from Soil in Detection and Transformation of Recombinant DNA from Bacteria and Yeast,” Applied and Environmental Microbiology, Vol. 59, No. 8, 1993, pp. 2657-2665. [27] R. J. Steffan and R. M. Atlas, “DNA Amplification to Enhance Detection of Genetically Engineered Bacteria in Environmental Samples,” Applied and Environmental Microbiology, Vol. 54, No. 9, 1988, pp. 2185-2191. [28] N. Fromin, J. Hamelin, S. Tarnawski, D. Roesti, K. Jour- dain-Miserez, N. Forestier, S. Teyssier-Cuvelle, F. Gillet, M. Aragno and P. Rossi, “Statistical Analysis of Dena- turing Gel Electrophoresis (DGE) Fingerprinting Pat- terns,” Environmental Microbiology, Vol. 4, No. 11, 2002, pp. 634-643. doi:10.1046/j.1462-2920.2002.00358.x [29] H. Sekiguchi, M. Watanabe, T. Nakahara, B. Xu and H. Uchiyama, “Succession of Bacterial Community Struc- ture along the Changjiang River Determined by Denatur- ing Gradient Gel Electrophoresis and Clone Library Analysis,” Applied and Environmental Microbiology, Vol. 68, No. 10, 2002, pp. 5142-5150. doi:10.1128/AEM.68.10.5142
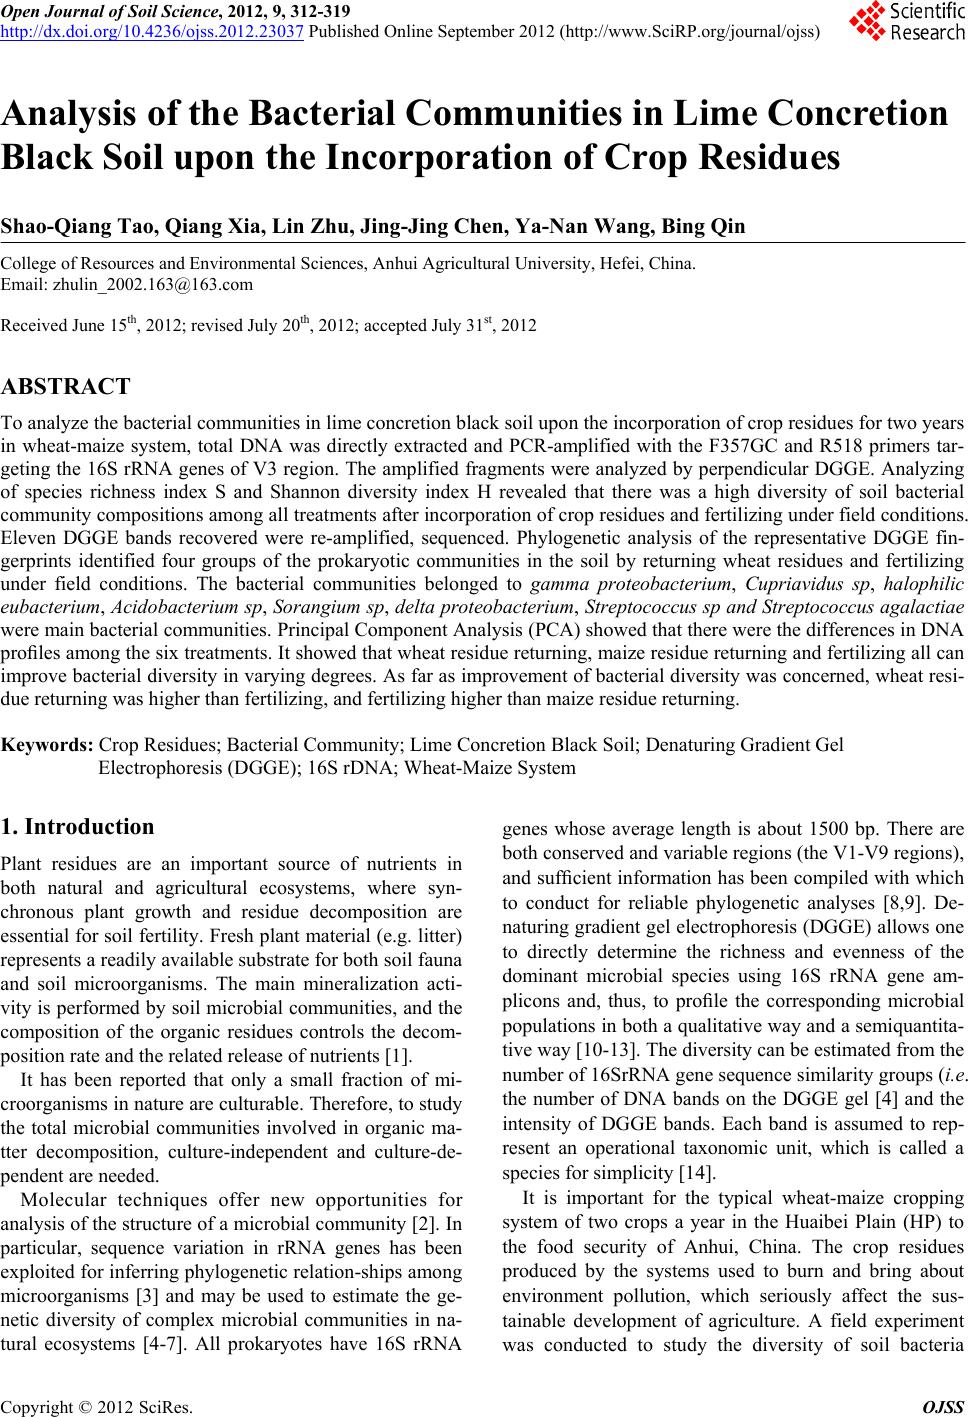
|