 Intelligent Information Management, 2012, 4, 188-193 http://dx.doi.org/10.4236/iim.2012.45028 Published Online September 2012 (http://www.SciRP.org/journal/iim) Visualization Analysis of Multi-Domain Access Control Policy Integration Based on Tree-Maps and Semantic Substrates Li Pan, Qian Xu Department of Electronic Engineering, Shanghai Jiao Tong University, Shanghai, China Email: panli@sjtu.edu.cn, delia1988@gmail.com Received April 22, 2012; revised May 23, 2012; accepted June 1, 2012 ABSTRACT The complexity of multi-domain access control policy integration makes it difficult to understand and manage the policy conflict information. The policy information visualization technology can express the logical relation of the complex information intuitively which can effectively improve the management ability of the multi-domain policy integration. Based on the role-based access control model, this paper proposed two policy analyzing methods on the separated do- main statistical information of multi-domain policy integration conflicts and the policy element levels of inter-domain and element mapping of cross-domain respectively. In addition, the corresponding visualization tool is developed. We use the tree-maps algorithm to statistically analyze quantity and type of the policy integration conflicts. On that basis, the semantic substrates algorithm is applied to concretely analyze the policy element levels of inter-domain and role and permission mapping of cross-domain. Experimental result shows tree-maps and semantic substrates can effectively analyze the conflicts of multi-domain policy integration and have a good application value. Keywords: Cross-Domain Information Exchange; Visualization Analysis; Tree-Maps; Semantic Substrates 1. Introduction Along with the development of network technology, more and more network information services need to informa- tion exchange across trusted domains, such as collabora- tive computing, distributed storage, etc. The large set of the cross-domain access control policies makes the man- agement a complicated task [1]. The policy information visualization [2] technology can express the logical rela- tion of the complex information intuitively wh ich can ef- fectively improve the management ability of the multi- domain policy integr ation. The characteristics of RBAC model, such as role hier- archy, least privilege and separate of duty, mak e it widely used in multi-domain environment. In the particular back - ground of cross-domain information exchange, the ad- ministrators in different domains are different. When the administrator deletes, changes or adds something to the policy, conflicts may appear. The separated-domain sta- tistical information can give the administrator a macro- cognition and help him obtain qualitative results. But it’s still tough to sort out the relations between amounts of element mappings. In order to troubleshoot and resolve conflicts, he needs to learn more information about the intra-domain hierarchy and inter-domain mapping of RBAC model. So separated-domain statistical informa- tion on the macro-level and intra-domain hierarchy and inter-domain mapping of RBAC model on the micro- level guarantee the correctness and effectiveness. Scholars applied the informatio n visualization methods to the research on visualization analysis of access control policies. Prathima Rao et al. [3] proposed the multi-level gird-based technique for visualizing resu lts of policy ana- lysis. Xu et al. [4] proposed both semantic su bstrates and adjacency matrix technique for the policy query and the violations presentation of SELinux security policy. Ree- der et al. [5] proposed expandable Grids tool for dis- playing and authoring policies. Ghazinour et al. [6] pro- posed a visualization model for privacy policy and ap- plied it on the Facebook analysis. Above-mentioned works are for particular application scenarios, such as similarity analysis, SELinux, policy author or privacy policy etc. And such works are not related to visualization analysis of multi-domain information. 2. Preliminary 2.1. Symbol Definition Definition 1. We define doma in set i GG|i1,2,3n G: , C opyright © 2012 SciRes. IIM 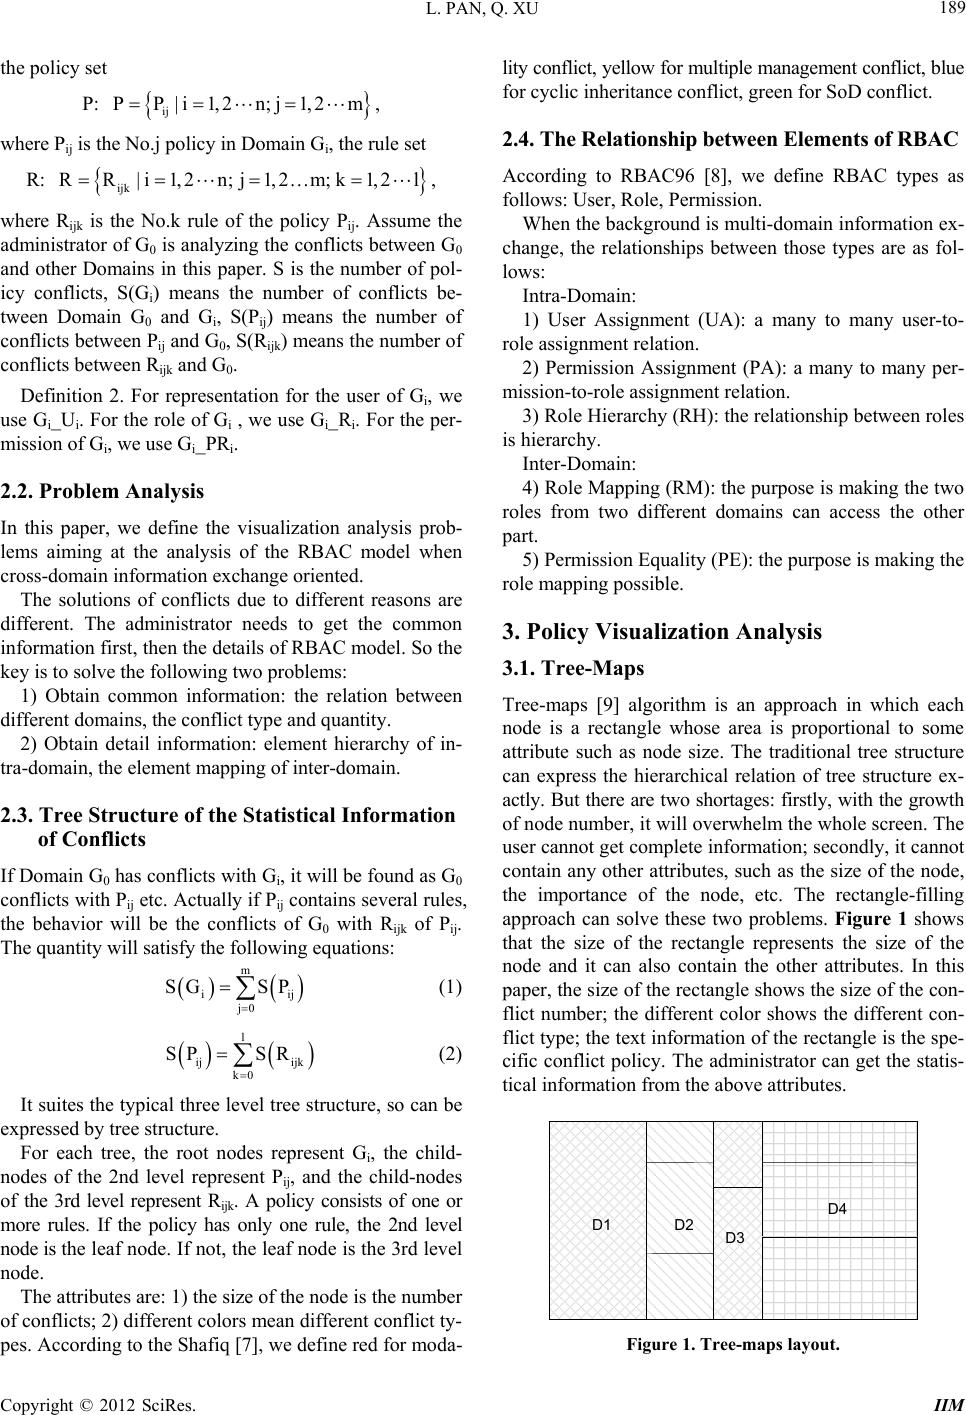 L. PAN, Q. XU 189 the policy set P: , ij PP|i1, 2n ;j1, 2m ;k1, 2l m iij j0 SP l ijk k0 SR where Pij is the No.j policy in Domain Gi, the rule set R: , ijk RR|i1,2n;j1,2m where Rijk is the No.k rule of the policy Pij. Assume the administrator of G0 is analyzing the conflicts between G0 and other Domains in this paper. S is the number of pol- icy conflicts, S(Gi) means the number of conflicts be- tween Domain G0 and Gi, S(Pij) means the number of conflicts between Pij and G0, S(Rijk) means the number of conflicts between Rijk and G0. Definition 2. For representation for the user of Gi, we use Gi_Ui. For the role of Gi , we use Gi_Ri. For the per- mission of Gi, we use Gi_PRi. 2.2. Problem Analysis In this paper, we define the visualization analysis prob- lems aiming at the analysis of the RBAC model when cross-domain information exchange oriented. The solutions of conflicts due to different reasons are different. The administrator needs to get the common information first, then the details of RBAC model. So the key is to solve the following two problems: 1) Obtain common information: the relation between different domains, the conflict type and quantity. 2) Obtain detail information: element hierarchy of in- tra-domain, the element m apping o f inter-do m ain. 2.3. Tree Structure of the Statistical Information of Conflicts If Domain G0 has conflicts with Gi, it will be found as G0 conflicts with Pij etc. Actually if Pij contains several rules, the behavior will be the conflicts of G0 with Rijk of Pij. The quantity will satisfy the following equations: SG (1) ij SP (2) It suites the typical three level tree structure, so can be expressed by tree structure. For each tree, the root nodes represent Gi, the child- nodes of the 2nd level represent Pij, and the child-nodes of the 3rd level represent Rijk. A policy consists of one or more rules. If the policy has only one rule, the 2nd level node is the le af n od e. If no t, th e l ea f n od e i s th e 3r d l ev el node. The attributes are: 1) the size of the node is the number of conflicts; 2) different colors mean different conflict ty- pes. According to the Shafiq [7], we define red for moda- lity conflict, yellow for multiple management conflict, blue for cyclic inheritance conflict, green for SoD conflict. 2.4. The Relationship between Elements of RBAC According to RBAC96 [8], we define RBAC types as follows: User, Role, Permission. When the background is multi-domain information ex- change, the relationships between those types are as fol- lows: Intra-Domain: 1) User Assignment (UA): a many to many user-to- role assignment relation. 2) Permission Assignment (PA): a many to many per- mission-to-role assignment relation. 3) Role Hierarchy (RH): the relationship between roles is hierarchy. Inter-Domain: 4) Role Mapping (RM): the purpose is making the two roles from two different domains can access the other part. 5) Permission Equality (PE): the purpose is making the role mapping possible. 3. Policy Visualization Analysis 3.1. Tree-Maps Tree-maps [9] algorithm is an approach in which each node is a rectangle whose area is proportional to some attribute such as node size. The traditional tree structure can express the hierarchical relation of tree structure ex- actly. But there are two shortages: firstly, with the growth of node number, it will overwhelm the whole screen. The user cannot get complete information; secondly, it cannot contain any other attributes, such as the size of the node, the importance of the node, etc. The rectangle-filling approach can solve these two problems. Figure 1 shows that the size of the rectangle represents the size of the node and it can also contain the other attributes. In this paper, the size of the rectangle shows the size of the con- flict number; the different color shows the different con- flict type; the text information of the rectangle is the spe- cific conflict policy. The administrator can get the statis- tical information from the above attributes. D4 D1 D2 D3 Figure 1. Tree-maps layout. Copyright © 2012 SciRes. IIM  L. PAN, Q. XU 190 In tree-maps algorithm, the size of the node determines the size of the rectangle. The size of the root node is the sum of all the child nodes. For the 1st level child nodes, we do vertical partition according to the size proportion of each node; for the 2nd level child nodes, we do hori- zon partition; keep replacing the partition directions to the leaf node. The impleme ntation steps of tree-maps are as Figure 2. 3.2. Semantic Substrates Semantic substrates [10] is a spatial template for a net- work, where nodes are grouped into regions and laid out within each region according to one or more node attrib- utes. It’s applicable to demonstrate the data structure which has following two features: 1) the data can be grouped according to their attributes and regions do not overlap; 2) the data of each region is the network relation, and the links between different regions have different semantics. It can solve two problems: 1) the cross of the multiple links; 2) the different semantics of the links be- tween different regions. The complexities of analyzing the multi-domain policy based RBAC are: 1) the cross of the links due to the multiple inheritances and distribution mapping; 2) different semantics due to the five types of relations. So, semantic substrates can exactly resolve these two problems. Two steps to organize nodes: 1) nodes are grouped into rectangular regions according to the three types: user, role and permission; 2) nodes are placed in each region according to their domain, as Figure 3. The round represents user, the rectangle represents role, and the triangle represents permission. The arrows connecting the elements, according to their different colors and different directions, show different 1. for root Node, size(root)=sum of Size(rootNode)//c of root 2. set O(x 1 ,y 1 ),Q(x 2 ,y 2 ),the upper left and lower right co 3. draw the rectangle 4. for I = 1 to num_children of 1st level, do step 5~6/ child node 5. alculate the size ordinate /for the 1stlevel * 1i1i2 1 1 xxsizechildrootsizeroot )xx i j //co of 1st partition 6. at each (x 1i ,y 1 ),draw vertical line down to (x 1i , y 2 ) 7. for each n ode of the 2nd level, do step 8~11//for th node 8. for I = 1 to num_Children of 1st level 9. for j = 1 to num_C hi ldr e n n 10. ordinate e 2ndlevel child 2 y // he method of 1st * 2j 2j1i1i1 yy(childchild) size childy n kj size coordinate of 2nd panel 11. at each(x 1i ,y 2j ), draw horizontal line to(x 1i ,y 2j ) 12. if the third level exists 13. set root = child j (child 1i ), do step 5~6//according to t level Figure 2. The Tree-maps algorithm. semantic. The one-way arrow means the entities are one- way relations. The two-way arrow means the entities are two-way relations. The steps of semantic substrates are as Figure 4. (a) User assignment (b) Permission assignment (c) Role Hierarchy (d) Role Mapping (e) Permission equality Figure 3. Example for query results. 1. Set 3 rectangles from top to bottom, represent User, Role and permission 2. for each region G i 3. do proportion segm entation from left t o right 4. for each node 5. if i User &(node no&de )G //nodes grouped int o di fferent region 6. do jj iii drawRound(x ,y ,Black),((x ,y)Area(User,G )) 7. else if i (node Role&&node)G 8. do jj jji drawRectangle(x ,y ,Black),((x ,y )Area(Role,G)) 9. else i (nodePermission&&nodeG ) 10. do jj jji drawTriangle(x ,y ,Black)(x ,y )Area(Permissio(n,G),) 11. if ijik (UA(G _U ,G _R)1) //if intra-domain exists UA 12. do ijik drawOneWayArrow(G _U,G _R,Red) 13. if iji k (UA(G _R,G _PR)1) // if intra-domain exists PA 14. do iji k drawOneWayArrow(G _R,G _PR,Green) 15. if ijik (UA(G_R,G_R)1) // if intra-domain exists RH 16. do ijik drawOneWayArrow(G _R,G _R,Black) Figure 4. Semantic substrates algorithm. Copyright © 2012 SciRes. IIM 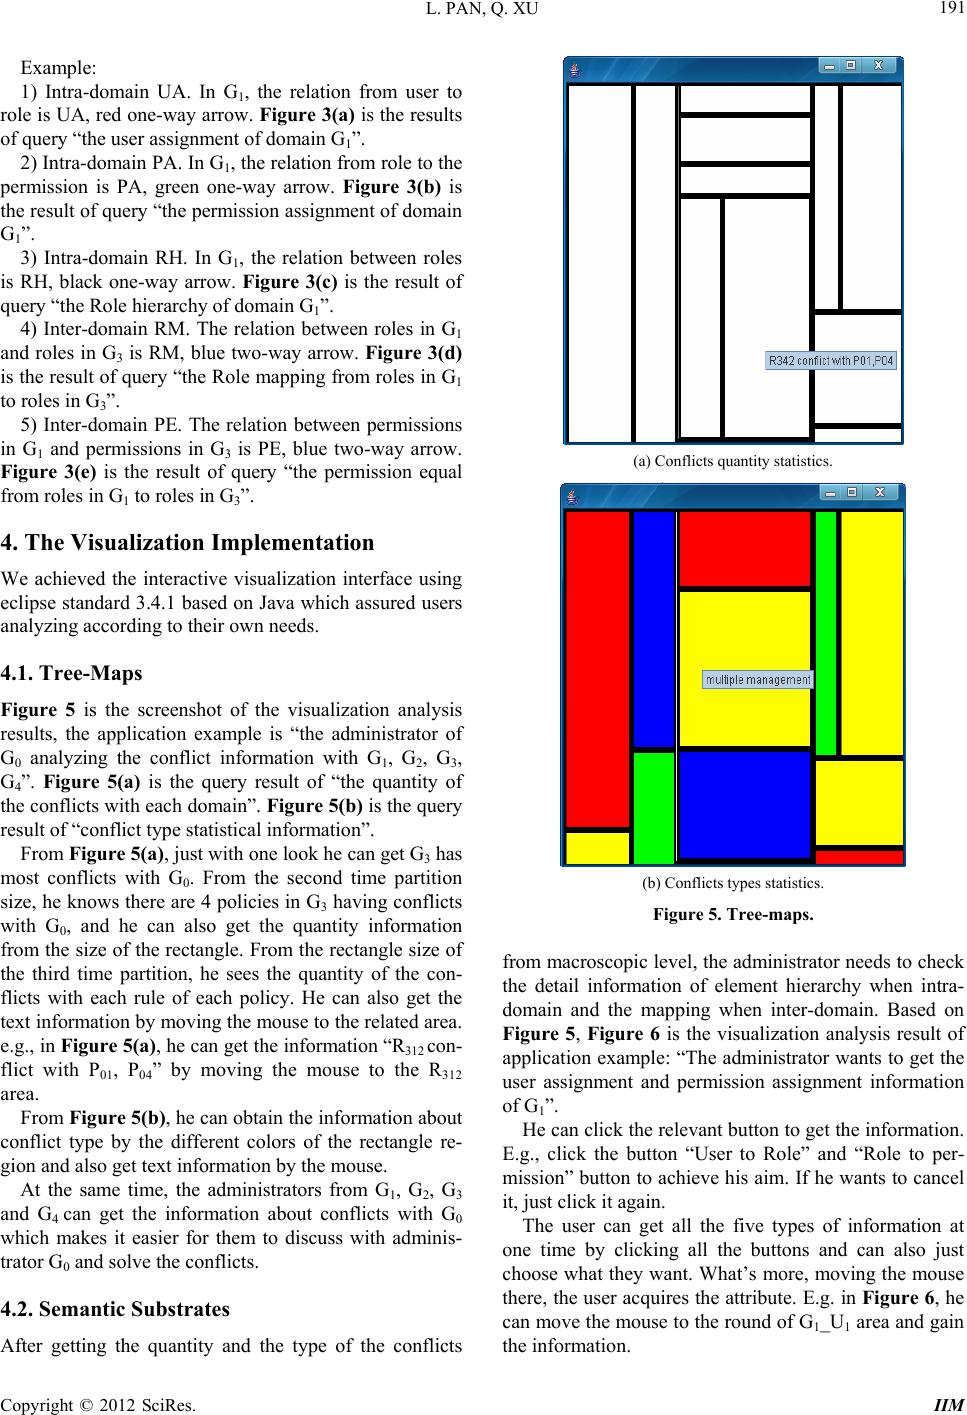 L. PAN, Q. XU 191 Example: 1) Intra-domain UA. In G1, the relation from user to role is UA, red one-way arrow. Figure 3(a) is the results of query “the user assignment of domain G1”. 2) Intra- domai n PA . In G1, the relation from role to the permission is PA, green one-way arrow. Figure 3(b) is the result of quer y “the permission assign ment of domain G1”. 3) Intra-domain RH. In G1, the relation between roles is RH, black one-way arrow. Figure 3(c) is the result of query “the Role hierarchy of domain G1”. 4) Inter-domain RM. The relation between roles in G1 and roles in G3 is RM, blue two-way arrow. Figure 3(d) is the result of query “the Role mapping from r oles in G1 to roles in G3”. 5) Inter-domain PE. The relation between permissions in G1 and permissions in G3 is PE, blue two-way arrow. Figure 3(e) is the result of query “the permission equal from roles in G1 to roles in G3”. 4. The Visualization Implementation We achieved the interactive visualization interface using eclipse standard 3.4.1 based on Java which assured users analyzing according to their own needs. 4.1. Tree-Maps Figure 5 is the screenshot of the visualization analysis results, the application example is “the administrator of G0 analyzing the conflict information with G1, G2, G3, G4”. Figure 5(a) is the query result of “the quantity of the conflicts with each domain”. Figure 5(b) is the query result of “conflict type statistical information”. From Figure 5(a), just with one look he can get G3 has most conflicts with G0. From the second time partition size, he knows there are 4 policies in G3 having conflicts with G0, and he can also get the quantity information from the size of the rectangle. From the rectangle size of the third time partition, he sees the quantity of the con- flicts with each rule of each policy. He can also get the text information by moving the mouse to the related area. e.g., in Figure 5(a), he can get the information “R312 con- flict with P01, P04” by moving the mouse to the R312 area. From Figure 5(b), he can obtain the information about conflict type by the different colors of the rectangle re- gion and also get text information by the mouse. At the same time, the administrators from G1, G2, G3 and G4 can get the information about conflicts with G0 which makes it easier for them to discuss with adminis- trator G0 and solve the conflicts. 4.2. Semantic Substrates After getting the quantity and the type of the conflicts (a) Conflicts quantity statistics. (b) Conflicts types statistics. Figure 5. Tree-maps. from macroscopic level, the administrator needs to check the detail information of element hierarchy when intra- domain and the mapping when inter-domain. Based on Figure 5, Figure 6 is the visualization analysis result of application example: “The administrator wants to get the user assignment and permission assignment information of G1”. He can click the relevant button to get the information. E.g., click the button “User to Role” and “Role to per- mission” button to achieve his aim. If he wants to cancel it, just click it again. The user can get all the five types of information at one time by clicking all the buttons and can also just choose what they want. What’s more, moving the mouse there, the user acquires the attribute. E.g. in Figure 6, he can move the mouse to the round of G1_U1 area and gain the information. Copyright © 2012 SciRes. IIM  L. PAN, Q. XU Copyright © 2012 SciRes. IIM 192 Figure 6. The screenshot of semantic substrates. 5. Conclusion In this paper we analyzed the complexity of the policy integration when facing the cross-domain information exchange and proposed two problems which can guaran- tee the administrator getting proper information intui- tively. Two visualization algorithms, tree-maps and se- mantic substrates, are applied to resolve the two prob- lems. Furthermore, we analyzed how to use them to ana- lyze the information, and we implemented them through Java Graphics. The current future work includes: visu- alization analysis contains other access control model when dealing with the multi-domain information ex- change. 6. Acknowledgements This work in the paper is supported by National Natural Science Foundation of China (Contract No. 60903191). REFERENCES [1] A. Schaad, J. Moffett and J. Jacob, “The Role-Based Ac- cess Control System of a European Bank: A Case Study and Discussion,” Proceedings of the Sixth ACM Sympo- sium on Access Control Models and Technologies, Chan- tilly, 3-4 May 2001, pp. 3-9. doi:10.1145/373256.373257 [2] D. Hahn, R. Shangraw, M. Keith and D. Coursey, “Does Visualization Affect Perceptions of Ethically Complex Policy Decisions: An Experimental Study,” Proceedings of the 40th Annual Hawaii International Conference on System Sciences, Hilton Waikoloa, 3-6 January 2007 p. 96. [3] P. Rao, G. Ghinita, E. Bertino and J. Lobo, “Visualization for Access Control Policy Analysis Results Using Multi- Level Grids,” IEEE International Symposium on Policies for Distributed Systems and Networks, London, 20-22 July 2009. [4] W. J. Xu, M. Shehab and G.-J. Ahn, “Visualization Based Policy Analysis: Case Study in SELinux,” Proceedings of the 13th ACM Symposium on Access Control Models and Technologies, Estes Park, 11-13 June 2008. [5] R. Reeder, L. Bauer, L. Cranor, M. Reiter, K. Bacon, K. How and H. Strong, “Expandable Grids for Visualizing and Authoring Computer Security Policies,” CHI’08: Pro- ceedings of the Twenty-Sixth Annual SIGCHI Conference on Human Factors in Computing Systems, Florence, 5-10 April 2008. [6] K. Ghazinour, M. Majedi and K. Barker, “A Model for Privacy Policy Visualization,” Proceeding of the 4th IEEE International Workshop on Security, Trust, and Privacy for Software Application (STPSA 2009), Seattle, 20-24 July 2009. [7] B. Shafiq, J. B. D. Joshi, E. Bertino and A. Ghafoor, “Se- cure Interoperation in a Multi-Domain Environment Em- ploying RBAC Policies,” IEEE Transactions on Knowl- edge and Data Engineering, Vol. 17, No. 11, 2005, pp. 1557-1577. [8] R. Sandhu, E. Coyne and H. Feinstein, “Role-Based Ac- cess Control Model,” IEEE Computer, Vol. 29, No. 2, 1996, pp. 8-47. [9] B. Johnson and B. Shneiderman, “Tree-Maps: A Space-  L. PAN, Q. XU 193 Filling Approach to the Visualization of Hierarchical In- formation Structures,” Proceedings of the 2nd Conference on IEEE Visualization, San Diego, 22-25 October 1991, pp. 284-291. [10] A. Aris and B. Shneiderman, “Designing Semantic Sub- strate s for Visual Netw ork Explora tion,” Information Vis- ualization, Vol. 6, No. 4, 2007, pp. 281-300. doi:10.1057/palgrave.ivs.9500162 Copyright © 2012 SciRes. IIM
|