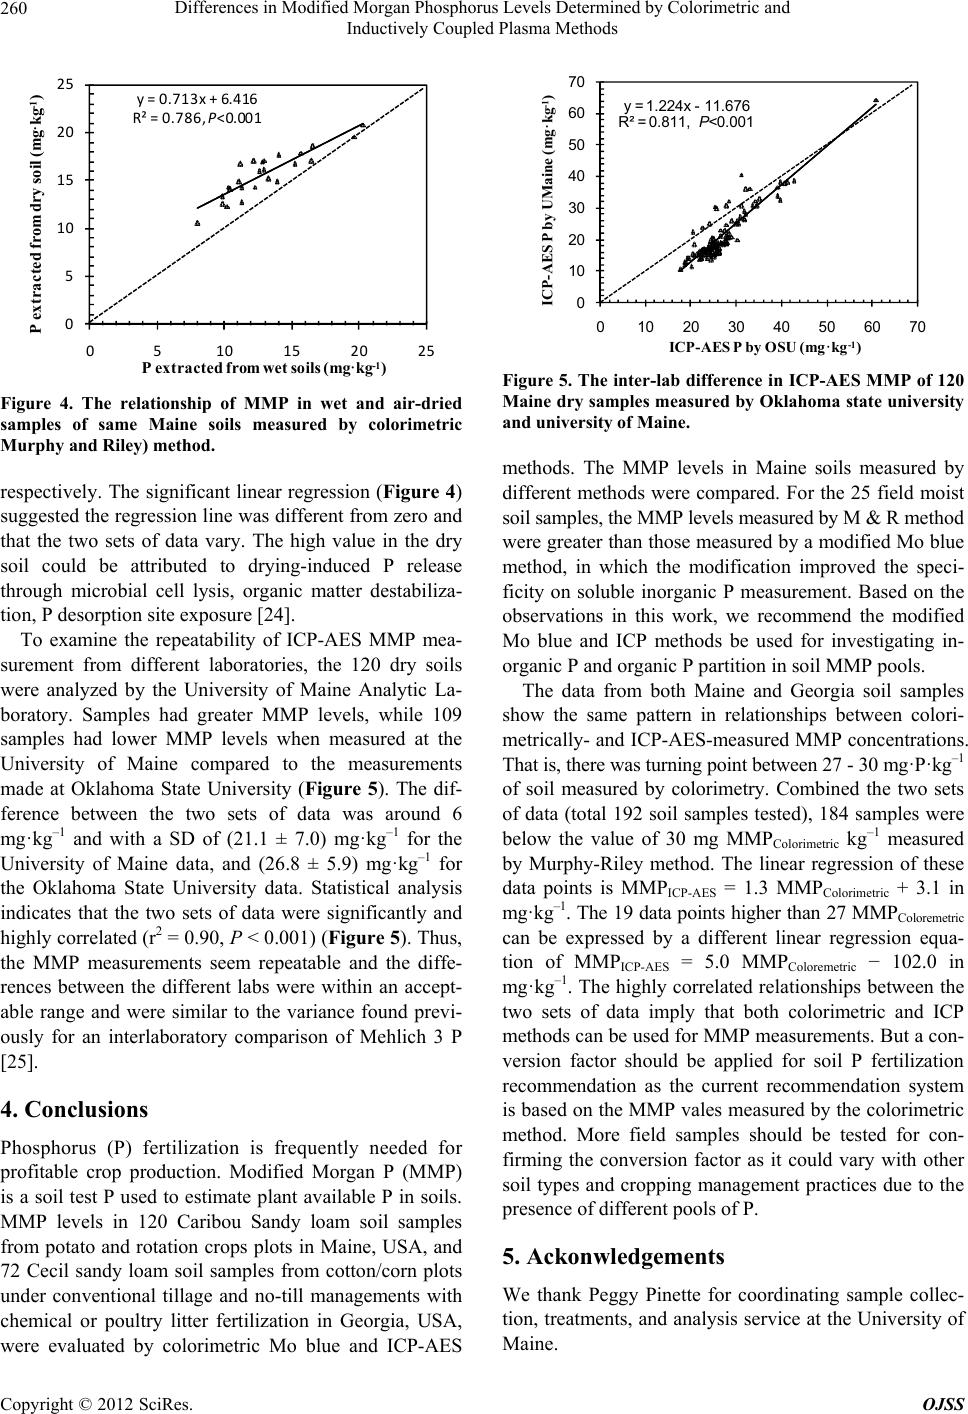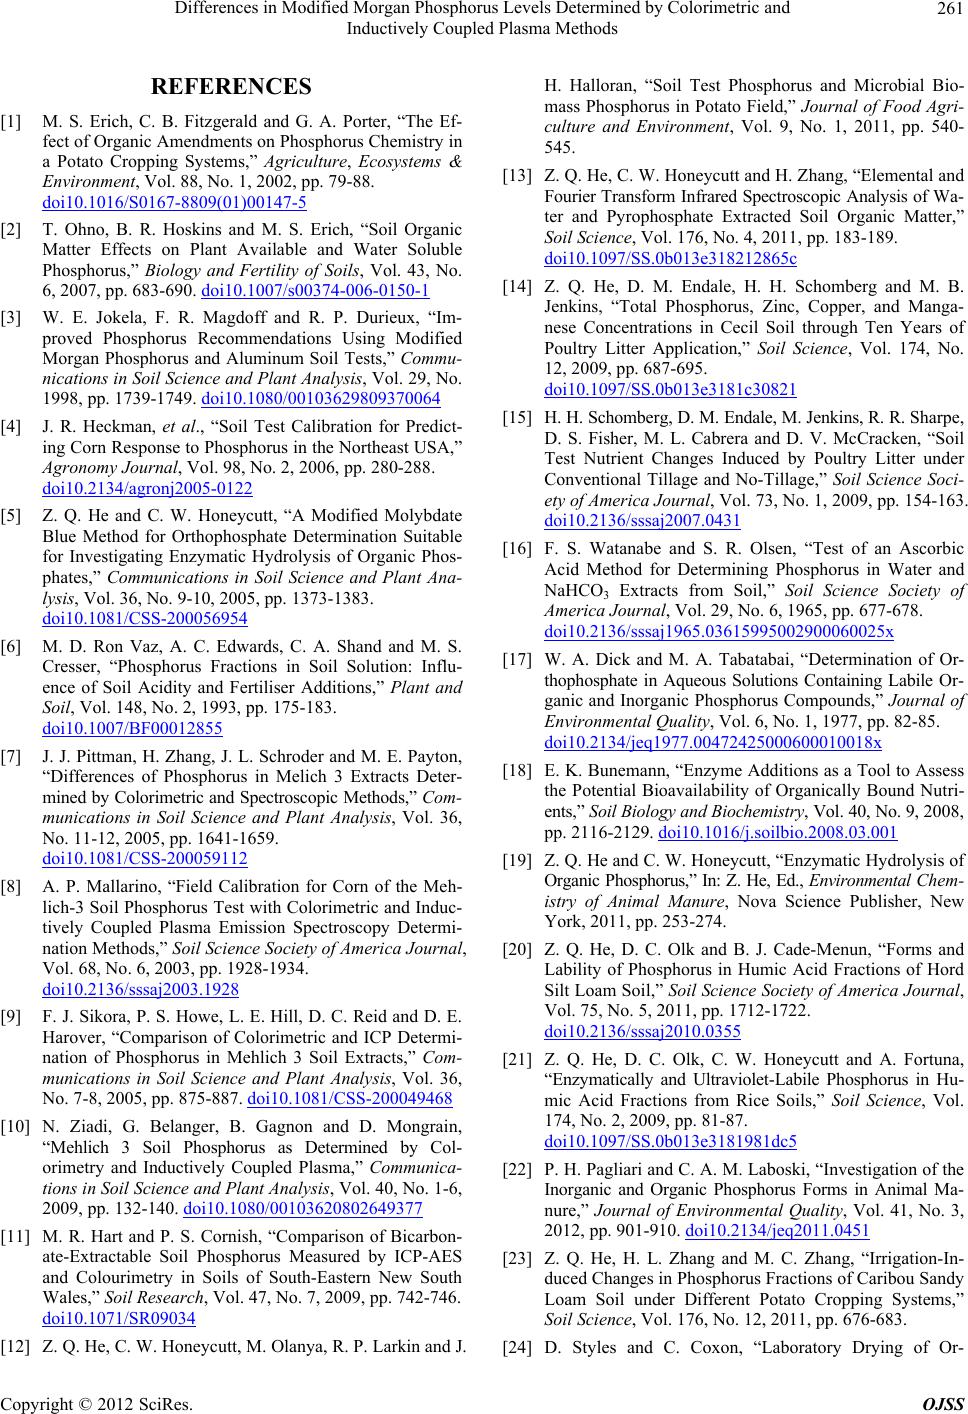
Differences in Modified Morgan Phosphorus Levels Determined by Colorimetric and
Inductively Coupled Plasma Methods
261
REFERENCES
[1] M. S. Erich, C. B. Fitzgerald and G. A. Porter, “The Ef-
fect of Organic Amendments on Phosphorus Chemistry in
a Potato Cropping Systems,” Agriculture, Ecosystems &
Environment, Vol. 88, No. 1, 2002, pp. 79-88.
doi10.1016/S0167-8809(01)00147-5
[2] T. Ohno, B. R. Hoskins and M. S. Erich, “Soil Organic
Matter Effects on Plant Available and Water Soluble
Phosphorus,” Biology and Fertility of Soils, Vol. 43, No.
6, 2007, pp. 683-690. doi10.1007/s00374-006-0150-1
[3] W. E. Jokela, F. R. Magdoff and R. P. Durieux, “Im-
proved Phosphorus Recommendations Using Modified
Morgan Phosphorus and Aluminum Soil Tests,” Commu-
nications in Soil Science and Plant Analysis, Vol. 29, No.
1998, pp. 1739-1749. doi10.1080/00103629809370064
[4] J. R. Heckman, et al., “Soil Test Calibration for Predict-
ing Corn Response to Phosphorus in the Northeast USA,”
Agronomy Journal, Vol. 98, No. 2, 2006, pp. 280-288.
doi10.2134/agronj2005-0122
[5] Z. Q. He and C. W. Honeycutt, “A Modified Molybdate
Blue Method for Orthophosphate Determination Suitable
for Investigating Enzymatic Hydrolysis of Organic Phos-
phates,” Communications in Soil Science and Plant Ana-
lysis, Vol. 36, No. 9-10, 2005, pp. 1373-1383.
doi10.1081/CSS-200056954
[6] M. D. Ron Vaz, A. C. Edwards, C. A. Shand and M. S.
Cresser, “Phosphorus Fractions in Soil Solution: Influ-
ence of Soil Acidity and Fertiliser Additions,” Plant and
Soil, Vol. 148, No. 2, 1993, pp. 175-183.
doi10.1007/BF00012855
[7] J. J. Pittman, H. Zhang, J. L. Schroder and M. E. Payton,
“Differences of Phosphorus in Melich 3 Extracts Deter-
mined by Colorimetric and Spectroscopic Methods,” Com-
munications in Soil Science and Plant Analysis, Vol. 36,
No. 11-12, 2005, pp. 1641-1659.
doi10.1081/CSS-200059112
[8] A. P. Mallarino, “Field Calibration for Corn of the Meh-
lich-3 Soil Phosphorus Test with Colorimetric and Induc-
tively Coupled Plasma Emission Spectroscopy Determi-
nation Methods,” Soil Science Society of America Journal,
Vol. 68, No. 6, 2003, pp. 1928-1934.
doi10.2136/sssaj2003.1928
[9] F. J. Sikora, P. S. Howe, L. E. Hill, D. C. Reid and D. E.
Harover, “Comparison of Colorimetric and ICP Determi-
nation of Phosphorus in Mehlich 3 Soil Extracts,” Com-
munications in Soil Science and Plant Analysis, Vol. 36,
No. 7-8, 2005, pp. 875-887. doi10.1081/CSS-200049468
[10] N. Ziadi, G. Belanger, B. Gagnon and D. Mongrain,
“Mehlich 3 Soil Phosphorus as Determined by Col-
orimetry and Inductively Coupled Plasma,” Communica-
tions in Soil Science and Plant Analysis, Vol. 40, No. 1-6,
2009, pp. 132-140. doi10.1080/00103620802649377
[11] M. R. Hart and P. S. Cornish, “Comparison of Bicarbon-
ate-Extractable Soil Phosphorus Measured by ICP-AES
and Colourimetry in Soils of South-Eastern New South
Wales,” Soil Research, Vol. 47, No. 7, 2009, pp. 742-746.
doi10.1071/SR09034
[12] Z. Q. He, C. W. Honeycutt, M. Olanya, R. P. Larkin and J.
H. Halloran, “Soil Test Phosphorus and Microbial Bio-
mass Phosphorus in Potato Field,” Journal of Food Agri-
culture and Environment, Vol. 9, No. 1, 2011, pp. 540-
545.
[13] Z. Q. He, C. W. Honeycutt and H. Zhang, “Elemental and
Fourier Transform Infrared Spectroscopic Analysis of Wa-
ter and Pyrophosphate Extracted Soil Organic Matter,”
Soil Science, Vol. 176, No. 4, 2011, pp. 183-189.
doi10.1097/SS.0b013e318212865c
[14] Z. Q. He, D. M. Endale, H. H. Schomberg and M. B.
Jenkins, “Total Phosphorus, Zinc, Copper, and Manga-
nese Concentrations in Cecil Soil through Ten Years of
Poultry Litter Application,” Soil Science, Vol. 174, No.
12, 2009, pp. 687-695.
doi10.1097/SS.0b013e3181c30821
[15] H. H. Schomberg, D. M. Endale, M. Jenkins, R. R. Sharpe,
D. S. Fisher, M. L. Cabrera and D. V. McCracken, “Soil
Test Nutrient Changes Induced by Poultry Litter under
Conventional Tillage and No-Tillage,” Soil Science Soci-
ety of America Journal, Vol. 73, No. 1, 2009, pp. 154-163.
doi10.2136/sssaj2007.0431
[16] F. S. Watanabe and S. R. Olsen, “Test of an Ascorbic
Acid Method for Determining Phosphorus in Water and
NaHCO3 Extracts from Soil,” Soil Science Society of
America Journal, Vol. 29, No. 6, 1965, pp. 677-678.
doi10.2136/sssaj1965.03615995002900060025x
[17] W. A. Dick and M. A. Tabatabai, “Determination of Or-
thophosphate in Aqueous Solutions Containing Labile Or-
ganic and Inorganic Phosphorus Compounds,” Journal of
Environmental Quality, Vol. 6, No. 1, 1977, pp. 82-85.
doi10.2134/jeq1977.00472425000600010018x
[18] E. K. Bunemann, “Enzyme Additions as a Tool to Assess
the Potential Bioavailability of Organically Bound Nutri-
ents,” Soil Biol ogy an d Bioche mistry , Vol. 40, No. 9, 2008,
pp. 2116-2129. doi10.1016/j.soilbio.2008.03.001
[19] Z. Q. He and C. W. Honeycutt, “Enzymatic Hydrolysis of
Organic Phosphorus,” In: Z. He, Ed., Environmental Che m-
istry of Animal Manure, Nova Science Publisher, New
York, 2011, pp. 253-274.
[20] Z. Q. He, D. C. Olk and B. J. Cade-Menun, “Forms and
Lability of Phosphorus in Humic Acid Fractions of Hord
Silt Loam Soil,” Soil Science Society of America Journal,
Vol. 75, No. 5, 2011, pp. 1712-1722.
doi10.2136/sssaj2010.0355
[21] Z. Q. He, D. C. Olk, C. W. Honeycutt and A. Fortuna,
“Enzymatically and Ultraviolet-Labile Phosphorus in Hu-
mic Acid Fractions from Rice Soils,” Soil Science, Vol.
174, No. 2, 2009, pp. 81-87.
doi10.1097/SS.0b013e3181981dc5
[22] P. H. Pagliari and C. A. M. Laboski, “Investigation of the
Inorganic and Organic Phosphorus Forms in Animal Ma-
nure,” Journal of Environmental Quality, Vol. 41, No. 3,
2012, pp. 901-910. doi10.2134/jeq2011.0451
[23] Z. Q. He, H. L. Zhang and M. C. Zhang, “Irrigation-In-
duced Changes in Phosphorus Fractions of Caribou Sandy
Loam Soil under Different Potato Cropping Systems,”
Soil Science, Vol. 176, No. 12, 2011, pp. 676-683.
[24] D. Styles and C. Coxon, “Laboratory Drying of Or-
Copyright © 2012 SciRes. OJSS