Paper Menu >>
Journal Menu >>
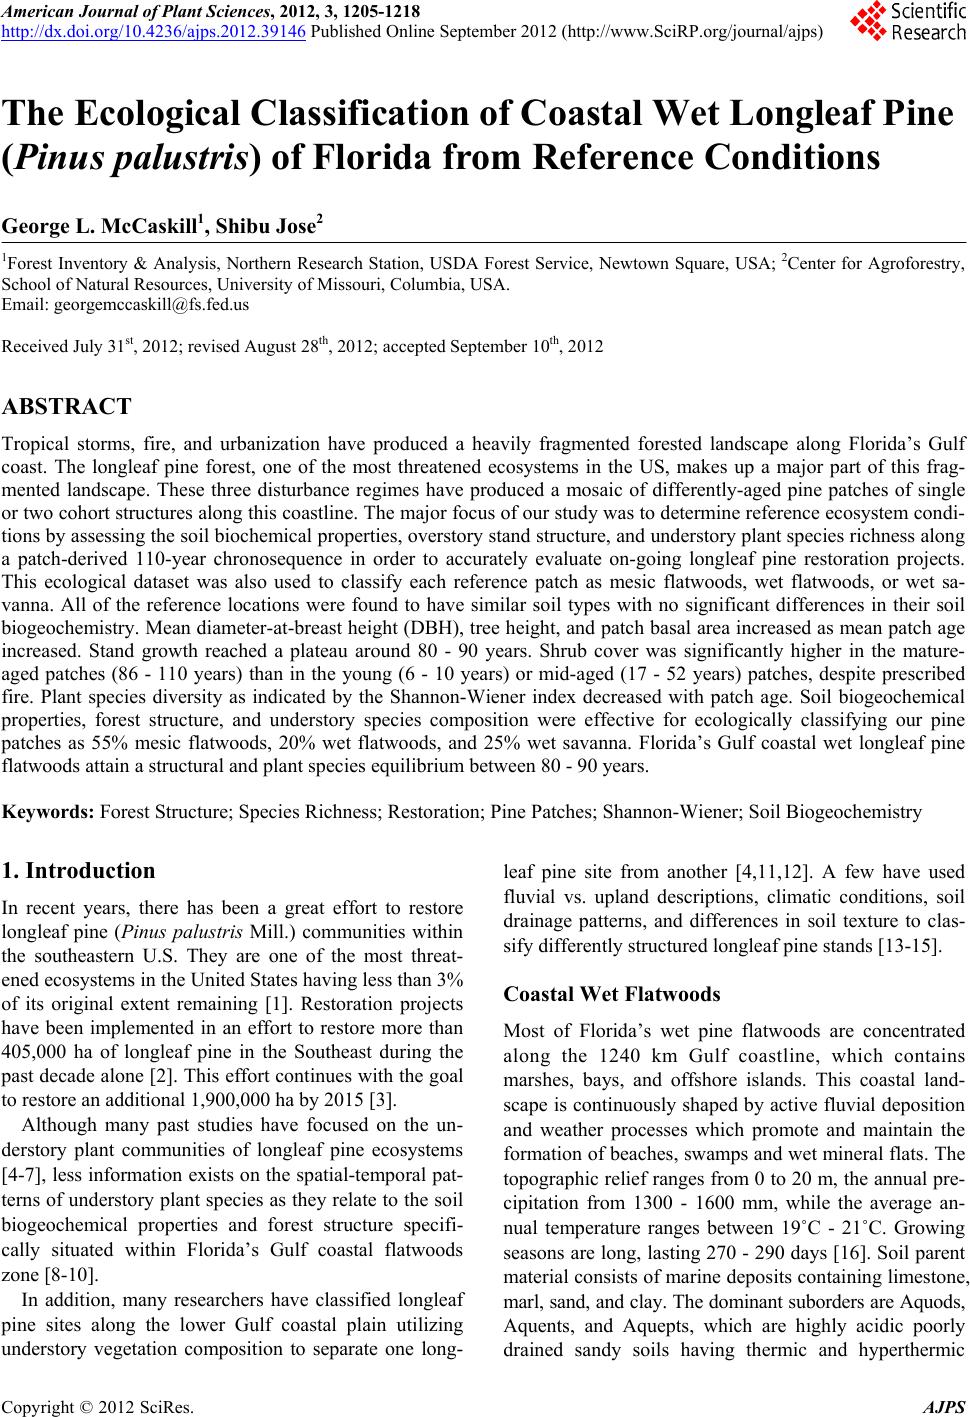 American Journal of Plant Sciences, 2012, 3, 1205-1218 http://dx.doi.org/10.4236/ajps.2012.39146 Published Online September 2012 (http://www.SciRP.org/journal/ajps) 1205 The Ecological Classification of Coastal Wet Longleaf Pine (Pinus palustris) of Florida from Reference Conditions George L. McCaskill1, Shibu Jose2 1Forest Inventory & Analysis, Northern Research Station, USDA Forest Service, Newtown Square, USA; 2Center for Agroforestry, School of Natural Resources, University of Missouri, Columbia, USA. Email: georgemccaskill@fs.fed.us Received July 31st, 2012; revised August 28th, 2012; accepted September 10th, 2012 ABSTRACT Tropical storms, fire, and urbanization have produced a heavily fragmented forested landscape along Florida’s Gulf coast. The longleaf pine forest, one of the most threatened ecosystems in the US, makes up a major part of this frag- mented landscape. These three disturbance regimes have produced a mosaic of differently-aged pine patches of single or two cohort structures along this coastline. The major focus of our study was to determine reference ecosystem condi- tions by assessing the soil biochemical properties, overstory stand structure, and understory plant species richness along a patch-derived 110-year chronosequence in order to accurately evaluate on-going longleaf pine restoration projects. This ecological dataset was also used to classify each reference patch as mesic flatwoods, wet flatwoods, or wet sa- vanna. All of the reference locations were found to have similar soil types with no significant differences in their soil biogeochemistry. Mean diameter-at-breast height (DBH), tree height, and patch basal area increased as mean patch age increased. Stand growth reached a plateau around 80 - 90 years. Shrub cover was significantly higher in the mature- aged patches (86 - 110 years) than in the young (6 - 10 years) or mid-aged (17 - 52 years) patches, despite prescribed fire. Plant species diversity as indicated by the Shannon-Wiener index decreased with patch age. Soil biogeochemical properties, forest structure, and understory species composition were effective for ecologically classifying our pine patches as 55% mesic flatwoods, 20% wet flatwoods, and 25% wet savanna. Florida’s Gulf coastal wet longleaf pine flatwoods attain a structural and plant species equilibrium between 80 - 90 years. Keywords: Forest Structure; Species Richness; Restoration; Pine Patches; Shannon-Wiener; Soil Biogeochemistry 1. Introduction In recent years, there has been a great effort to restore longleaf pine (Pinus palustris Mill.) communities within the southeastern U.S. They are one of the most threat- ened ecosystems in the United States having less than 3% of its original extent remaining [1]. Restoration projects have been implemented in an effort to restore more than 405,000 ha of longleaf pine in the Southeast during the past decade alone [2]. This effort continues with the goal to restore an additional 1,900,000 ha by 2015 [3]. Although many past studies have focused on the un- derstory plant communities of longleaf pine ecosystems [4-7], less information exists on the spatial-temporal pat- terns of understory plant species as they relate to the soil biogeochemical properties and forest structure specifi- cally situated within Florida’s Gulf coastal flatwoods zone [8-10]. In addition, many researchers have classified longleaf pine sites along the lower Gulf coastal plain utilizing understory vegetation composition to separate one long- leaf pine site from another [4,11,12]. A few have used fluvial vs. upland descriptions, climatic conditions, soil drainage patterns, and differences in soil texture to clas- sify differently structured longleaf pine stands [13-15]. Coastal Wet Flatwoods Most of Florida’s wet pine flatwoods are concentrated along the 1240 km Gulf coastline, which contains marshes, bays, and offshore islands. This coastal land- scape is continuously shaped by active fluvial deposition and weather processes which promote and maintain the formation of beaches, swamps and wet mineral flats. The topographic relief ranges from 0 to 20 m, the annual pre- cipitation from 1300 - 1600 mm, while the average an- nual temperature ranges between 19˚C - 21˚C. Growing seasons are long, lasting 270 - 290 days [16]. Soil parent material consists of marine deposits containing limestone, marl, sand, and clay. The dominant suborders are Aquods, Aquents, and Aquepts, which are highly acidic poorly drained sandy soils having thermic and hyperthermic Copyright © 2012 SciRes. AJPS 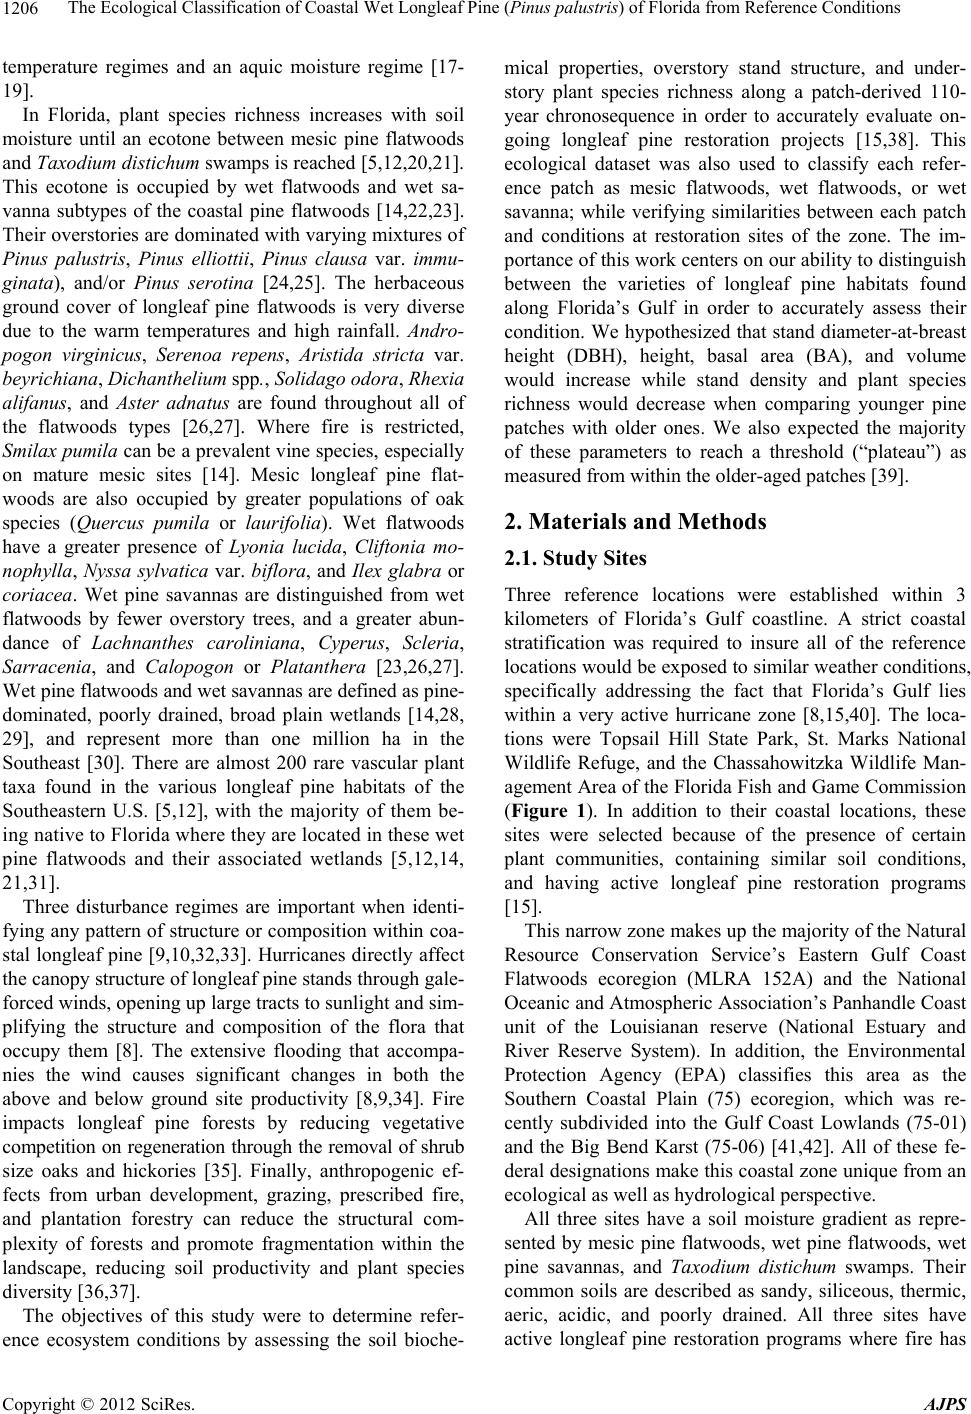 The Ecological Classification of Coastal Wet Longleaf Pine (Pinus palustris) of Florida from Reference Conditions 1206 temperature regimes and an aquic moisture regime [17- 19]. In Florida, plant species richness increases with soil moisture until an ecotone between mesic pine flatwoods and Taxodium distichum swamps is reached [5,12,20,21]. This ecotone is occupied by wet flatwoods and wet sa- vanna subtypes of the coastal pine flatwoods [14,22,23]. Their overstories are dominated with varying mixtures of Pinus palustris, Pinus elliottii, Pinus clausa var. immu- ginata), and/or Pinus serotina [24,25]. The herbaceous ground cover of longleaf pine flatwoods is very diverse due to the warm temperatures and high rainfall. Andro- pogon virginicus, Serenoa repens, Aristida stricta var. beyrichiana, Dichanthelium spp., Solidago odora, Rhexia alifanus, and Aster adnatus are found throughout all of the flatwoods types [26,27]. Where fire is restricted, Smilax pumila can be a prevalent vine species, especially on mature mesic sites [14]. Mesic longleaf pine flat- woods are also occupied by greater populations of oak species (Quercus pumila or laurifolia). Wet flatwoods have a greater presence of Lyonia lucida, Cliftonia mo- nophylla, Nyssa sylvatica var. biflora, and Ilex glabra or coriacea. Wet pine savannas are distinguished from wet flatwoods by fewer overstory trees, and a greater abun- dance of Lachnanthes caroliniana, Cyperus, Scleria, Sarracenia, and Calopogon or Platanthera [23,26,27]. Wet pine flatwoods and wet savannas are defined as pine- dominated, poorly drained, broad plain wetlands [14,28, 29], and represent more than one million ha in the Southeast [30]. There are almost 200 rare vascular plant taxa found in the various longleaf pine habitats of the Southeastern U.S. [5,12], with the majority of them be- ing native to Florida where they are located in these wet pine flatwoods and their associated wetlands [5,12,14, 21,31]. Three disturbance regimes are important when identi- fying any pattern of structure or composition within coa- stal longleaf pine [9,10,32,33]. Hurricanes directly affect the canopy structure of longleaf pine stands through gale- forced winds, opening up large tracts to sunlight and sim- plifying the structure and composition of the flora that occupy them [8]. The extensive flooding that accompa- nies the wind causes significant changes in both the above and below ground site productivity [8,9,34]. Fire impacts longleaf pine forests by reducing vegetative competition on regeneration through the removal of shrub size oaks and hickories [35]. Finally, anthropogenic ef- fects from urban development, grazing, prescribed fire, and plantation forestry can reduce the structural com- plexity of forests and promote fragmentation within the landscape, reducing soil productivity and plant species diversity [36,37]. The objectives of this study were to determine refer- ence ecosystem conditions by assessing the soil bioche- mical properties, overstory stand structure, and under- story plant species richness along a patch-derived 110- year chronosequence in order to accurately evaluate on- going longleaf pine restoration projects [15,38]. This ecological dataset was also used to classify each refer- ence patch as mesic flatwoods, wet flatwoods, or wet savanna; while verifying similarities between each patch and conditions at restoration sites of the zone. The im- portance of this work centers on our ability to distinguish between the varieties of longleaf pine habitats found along Florida’s Gulf in order to accurately assess their condition. We hypothesized that stand diameter-at-breast height (DBH), height, basal area (BA), and volume would increase while stand density and plant species richness would decrease when comparing younger pine patches with older ones. We also expected the majority of these parameters to reach a threshold (“plateau”) as measured from within the older-aged patches [39]. 2. Materials and Methods 2.1. Study Sites Three reference locations were established within 3 kilometers of Florida’s Gulf coastline. A strict coastal stratification was required to insure all of the reference locations would be exposed to similar weather conditions, specifically addressing the fact that Florida’s Gulf lies within a very active hurricane zone [8,15,40]. The loca- tions were Topsail Hill State Park, St. Marks National Wildlife Refuge, and the Chassahowitzka Wildlife Man- agement Area of the Florida Fish and Game Commission (Figure 1). In addition to their coastal locations, these sites were selected because of the presence of certain plant communities, containing similar soil conditions, and having active longleaf pine restoration programs [15]. This narrow zone makes up the majority of the Natural Resource Conservation Service’s Eastern Gulf Coast Flatwoods ecoregion (MLRA 152A) and the National Oceanic and Atmospheric Association’s Panhandle Coast unit of the Louisianan reserve (National Estuary and River Reserve System). In addition, the Environmental Protection Agency (EPA) classifies this area as the Southern Coastal Plain (75) ecoregion, which was re- cently subdivided into the Gulf Coast Lowlands (75-01) and the Big Bend Karst (75-06) [41,42]. All of these fe- deral designations make this coastal zone unique from an ecological as well as hydrological perspective. All three sites have a soil moisture gradient as repre- sented by mesic pine flatwoods, wet pine flatwoods, wet pine savannas, and Taxodium distichum swamps. Their common soils are described as sandy, siliceous, thermic, aeric, acidic, and poorly drained. All three sites have active longleaf pine restoration programs where fire has Copyright © 2012 SciRes. AJPS 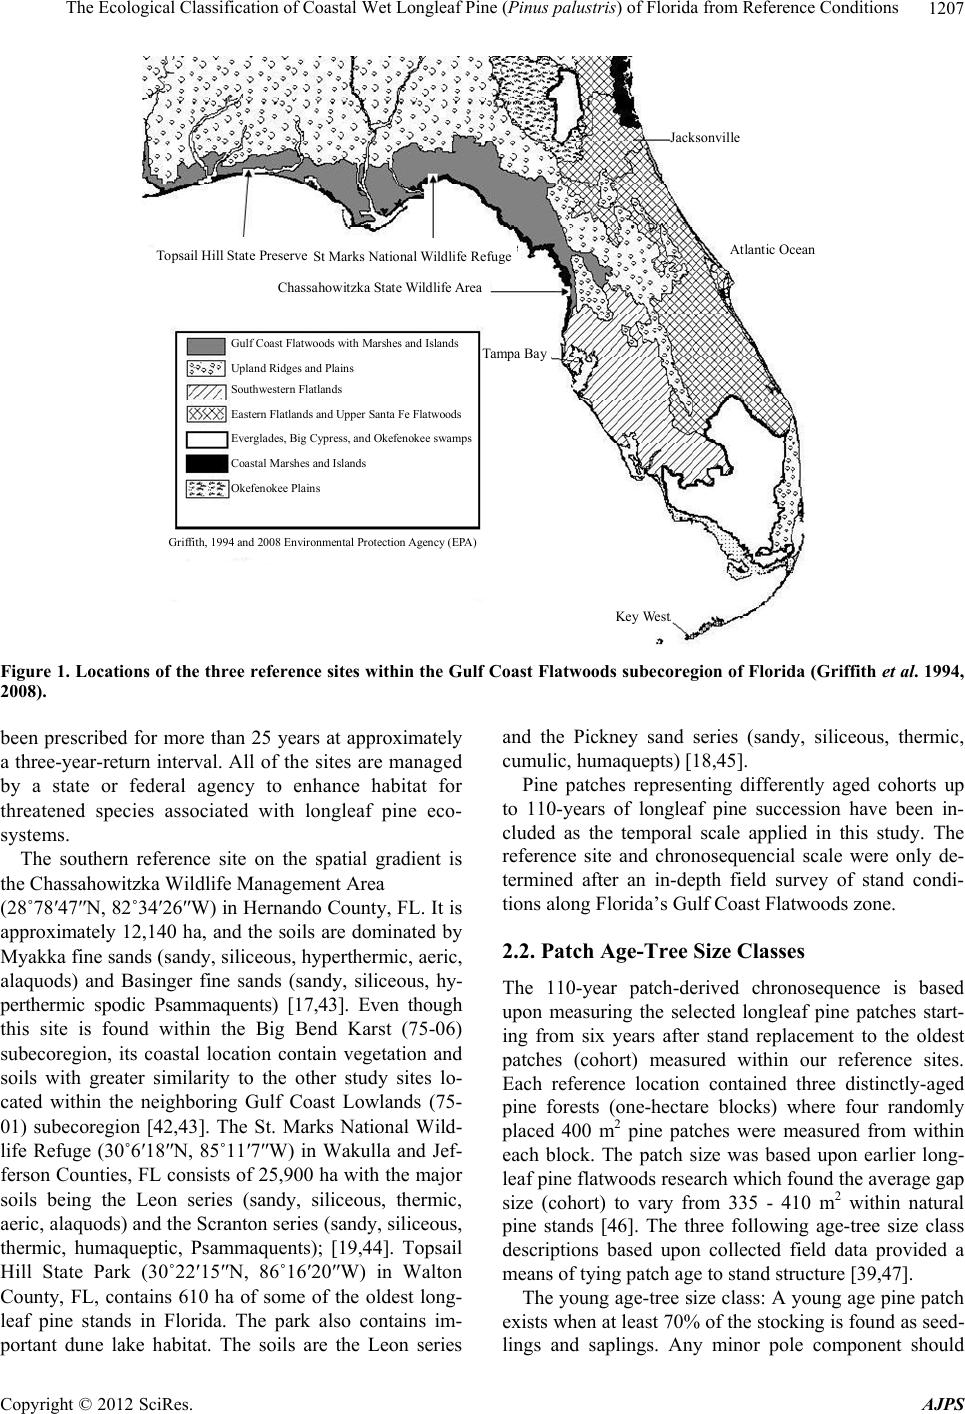 The Ecological Classification of Coastal Wet Longleaf Pine (Pinus palustris) of Florida from Reference Conditions Copyright © 2012 SciRes. AJPS 1207 Topsail Hill State Preserve St Marks National Wildlife Refu g e Chassahowitzka State Wildlife Area Jacksonville Atlantic Ocean Tampa Bay Gulf Coast Flatwoods with Marshes and Islands Upland Ridges and Plains Southwestern Flatlands Eastern Flatlands and Upper Santa Fe Flatwoods Everglades, Big Cypress, and Okefenokee swamps Coastal Marshes and Islands Okefenokee Plains Griffith, 1994 and 2008 Environmental Protection Agency (EPA) Key West Figure 1. Locations of the three reference sites within the Gulf Coast Flatwoods subecoregion of Florida (Griffith et al. 1994, 2008). and the Pickney sand series (sandy, siliceous, thermic, cumulic, humaquepts) [18,45]. been prescribed for more than 25 years at approximately a three-year-return interval. All of the sites are managed by a state or federal agency to enhance habitat for threatened species associated with longleaf pine eco- systems. Pine patches representing differently aged cohorts up to 110-years of longleaf pine succession have been in- cluded as the temporal scale applied in this study. The reference site and chronosequencial scale were only de- termined after an in-depth field survey of stand condi- tions along Florida’s Gulf Coast Flatwoods zone. The southern reference site on the spatial gradient is the Chassahowitzka Wildlife Management Area (28˚78′47″N, 82˚34′26″W) in Hernando County, FL. It is approximately 12,140 ha, and the soils are dominated by Myakka fine sands (sandy, siliceous, hyperthermic, aeric, alaquods) and Basinger fine sands (sandy, siliceous, hy- perthermic spodic Psammaquents) [17,43]. Even though this site is found within the Big Bend Karst (75-06) subecoregion, its coastal location contain vegetation and soils with greater similarity to the other study sites lo- cated within the neighboring Gulf Coast Lowlands (75- 01) subecoregion [42,43]. The St. Marks National Wild- life Refuge (30˚6′18″N, 85˚11′7″W) in Wakulla and Jef- ferson Counties, FL consists of 25,900 ha with the major soils being the Leon series (sandy, siliceous, thermic, aeric, alaquods) and the Scranton series (sandy, siliceous, thermic, humaqueptic, Psammaquents); [19,44]. Topsail Hill State Park (30˚22′15″N, 86˚16′20″W) in Walton County, FL, contains 610 ha of some of the oldest long- leaf pine stands in Florida. The park also contains im- portant dune lake habitat. The soils are the Leon series 2.2. Patch Age-Tree Size Classes The 110-year patch-derived chronosequence is based upon measuring the selected longleaf pine patches start- ing from six years after stand replacement to the oldest patches (cohort) measured within our reference sites. Each reference location contained three distinctly-aged pine forests (one-hectare blocks) where four randomly placed 400 m2 pine patches were measured from within each block. The patch size was based upon earlier long- leaf pine flatwoods research which found the average gap size (cohort) to vary from 335 - 410 m2 within natural pine stands [46]. The three following age-tree size class descriptions based upon collected field data provided a means of tying patch age to stand structure [39,47]. The young age-tree size class: A young age pine patch exists when at least 70% of the stocking is found as seed- lings and saplings. Any minor pole component should 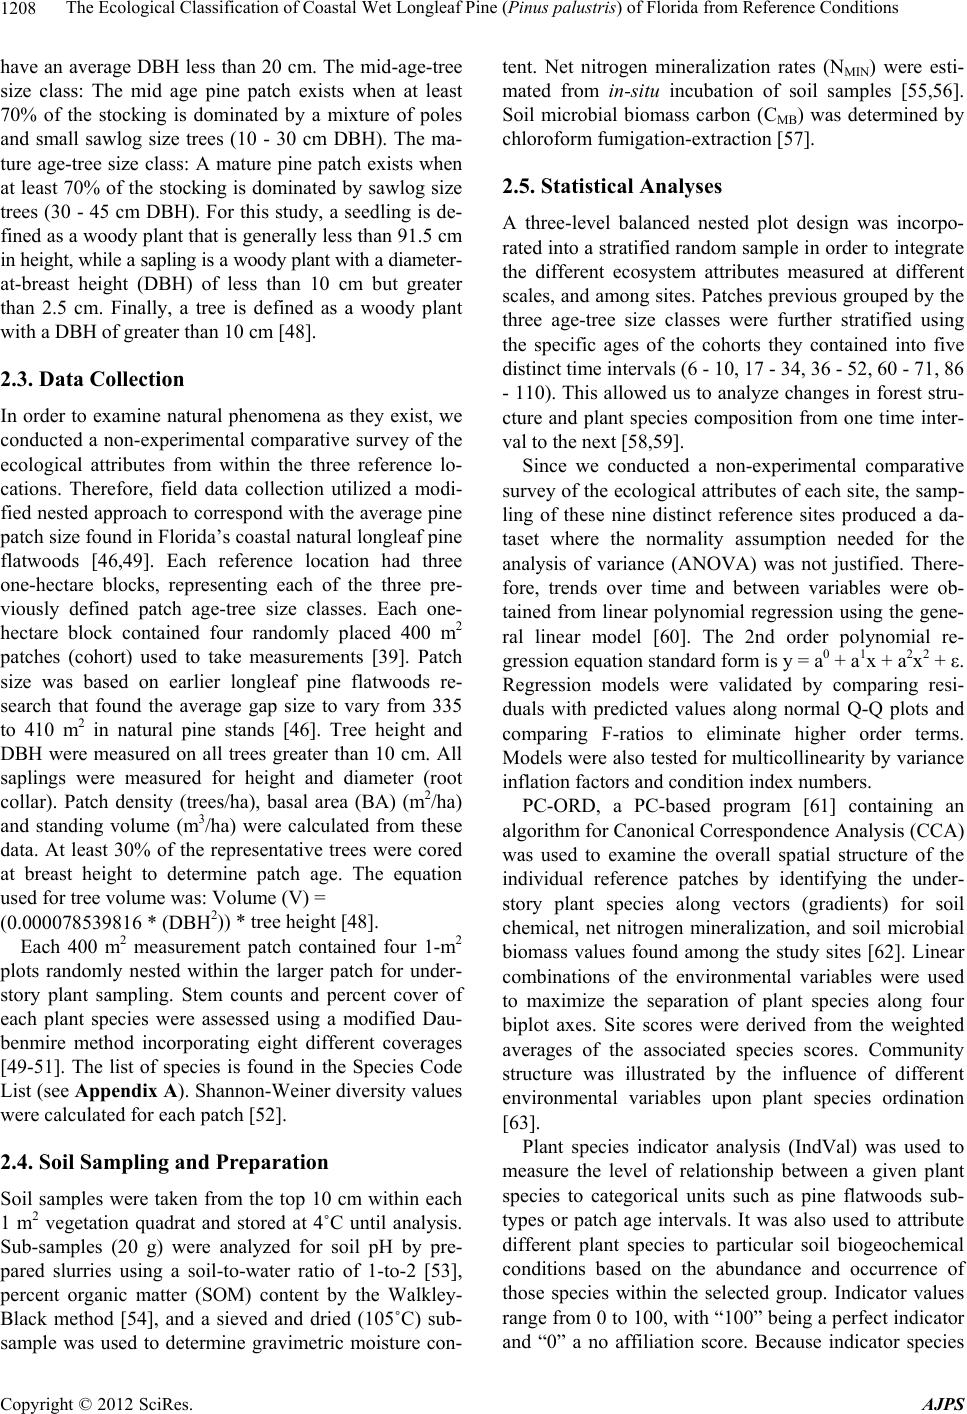 The Ecological Classification of Coastal Wet Longleaf Pine (Pinus palustris) of Florida from Reference Conditions 1208 have an average DBH less than 20 cm. The mid-age-tree size class: The mid age pine patch exists when at least 70% of the stocking is dominated by a mixture of poles and small sawlog size trees (10 - 30 cm DBH). The ma- ture age-tree size class: A mature pine patch exists when at least 70% of the stocking is dominated by sawlog size trees (30 - 45 cm DBH). For this study, a seedling is de- fined as a woody plant that is generally less than 91.5 cm in height, while a sapling is a woody plant with a diameter- at-breast height (DBH) of less than 10 cm but greater than 2.5 cm. Finally, a tree is defined as a woody plant with a DBH of greater than 10 cm [48]. 2.3. Data Collection In order to examine natural phenomena as they exist, we conducted a non-experimental comparative survey of the ecological attributes from within the three reference lo- cations. Therefore, field data collection utilized a modi- fied nested approach to correspond with the average pine patch size found in Florida’s coastal natural longleaf pine flatwoods [46,49]. Each reference location had three one-hectare blocks, representing each of the three pre- viously defined patch age-tree size classes. Each one- hectare block contained four randomly placed 400 m2 patches (cohort) used to take measurements [39]. Patch size was based on earlier longleaf pine flatwoods re- search that found the average gap size to vary from 335 to 410 m2 in natural pine stands [46]. Tree height and DBH were measured on all trees greater than 10 cm. All saplings were measured for height and diameter (root collar). Patch density (trees/ha), basal area (BA) (m2/ha) and standing volume (m3/ha) were calculated from these data. At least 30% of the representative trees were cored at breast height to determine patch age. The equation used for tree volume was: Volume (V) = (0.000078539816 * (DBH2)) * tree height [48]. Each 400 m2 measurement patch contained four 1-m2 plots randomly nested within the larger patch for under- story plant sampling. Stem counts and percent cover of each plant species were assessed using a modified Dau- benmire method incorporating eight different coverages [49-51]. The list of species is found in the Species Code List (see Appendix A). Shannon-Weiner diversity values were calculated for each patch [52]. 2.4. Soil Sampling and Preparation Soil samples were taken from the top 10 cm within each 1 m2 vegetation quadrat and stored at 4˚C until analysis. Sub-samples (20 g) were analyzed for soil pH by pre- pared slurries using a soil-to-water ratio of 1-to-2 [53], percent organic matter (SOM) content by the Walkley- Black method [54], and a sieved and dried (105˚C) sub- sample was used to determine gravimetric moisture con- tent. Net nitrogen mineralization rates (NMIN) were esti- mated from in-situ incubation of soil samples [55,56]. Soil microbial biomass carbon (CMB) was determined by chloroform fumigation-extraction [57]. 2.5. Statistical Analyses A three-level balanced nested plot design was incorpo- rated into a stratified random sample in order to integrate the different ecosystem attributes measured at different scales, and among sites. Patches previous grouped by the three age-tree size classes were further stratified using the specific ages of the cohorts they contained into five distinct time intervals (6 - 10, 17 - 34, 36 - 52, 60 - 71, 86 - 110). This allowed us to analyze changes in forest stru- cture and plant species composition from one time inter- val to the next [58,59]. Since we conducted a non-experimental comparative survey of the ecological attributes of each site, the samp- ling of these nine distinct reference sites produced a da- taset where the normality assumption needed for the analysis of variance (ANOVA) was not justified. There- fore, trends over time and between variables were ob- tained from linear polynomial regression using the gene- ral linear model [60]. The 2nd order polynomial re- gression equation standard form is y = a0 + a1x + a2x2 + ε. Regression models were validated by comparing resi- duals with predicted values along normal Q-Q plots and comparing F-ratios to eliminate higher order terms. Models were also tested for multicollinearity by variance inflation factors and condition index numbers. PC-ORD, a PC-based program [61] containing an algorithm for Canonical Correspondence Analysis (CCA) was used to examine the overall spatial structure of the individual reference patches by identifying the under- story plant species along vectors (gradients) for soil chemical, net nitrogen mineralization, and soil microbial biomass values found among the study sites [62]. Linear combinations of the environmental variables were used to maximize the separation of plant species along four biplot axes. Site scores were derived from the weighted averages of the associated species scores. Community structure was illustrated by the influence of different environmental variables upon plant species ordination [63]. Plant species indicator analysis (IndVal) was used to measure the level of relationship between a given plant species to categorical units such as pine flatwoods sub- types or patch age intervals. It was also used to attribute different plant species to particular soil biogeochemical conditions based on the abundance and occurrence of those species within the selected group. Indicator values range from 0 to 100, with “100” being a perfect indicator and “0” a no affiliation score. Because indicator species Copyright © 2012 SciRes. AJPS 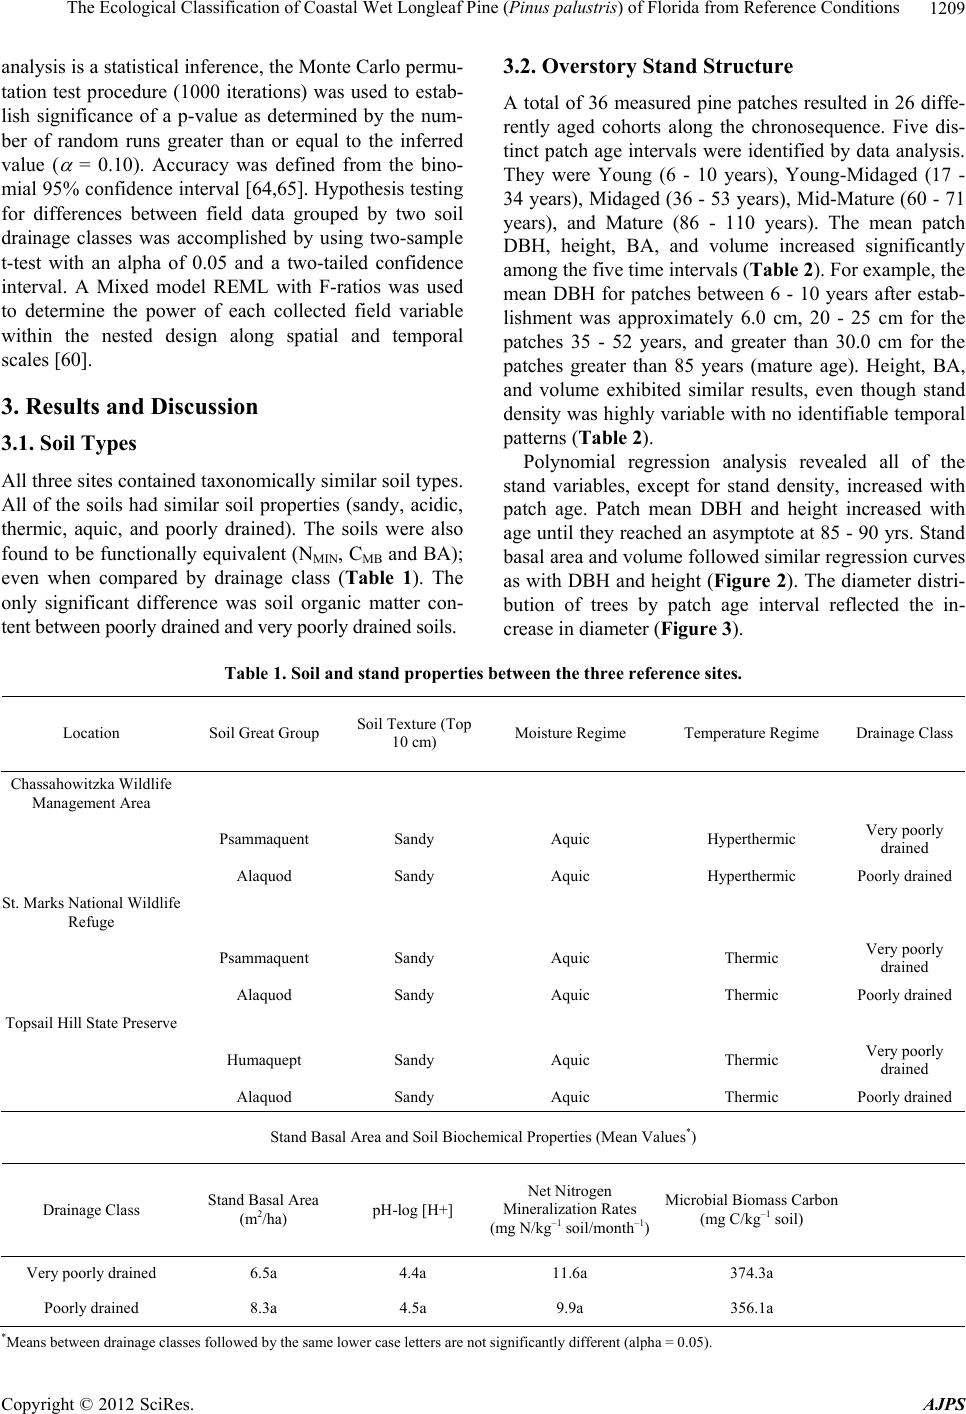 The Ecological Classification of Coastal Wet Longleaf Pine (Pinus palustris) of Florida from Reference Conditions Copyright © 2012 SciRes. AJPS 1209 analysis is a statistical inference, the Monte Carlo permu- tation test procedure (1000 iterations) was used to estab- lish significance of a p-value as determined by the num- ber of random runs greater than or equal to the inferred value ( = 0.10). Accuracy was defined from the bino- mial 95% confidence interval [64,65]. Hypothesis testing for differences between field data grouped by two soil drainage classes was accomplished by using two-sample t-test with an alpha of 0.05 and a two-tailed confidence interval. A Mixed model REML with F-ratios was used to determine the power of each collected field variable within the nested design along spatial and temporal scales [60]. 3. Results and Discussion 3.1. Soil Types All three sites contained taxonomically similar soil types. All of the soils had similar soil properties (sandy, acidic, thermic, aquic, and poorly drained). The soils were also found to be functionally equivalent (NMIN, CMB and BA); even when compared by drainage class (Table 1). The only significant difference was soil organic matter con- tent between poorly drained and very poorly drained soils. 3.2. Overstory Stand Structure A total of 36 measured pine patches resulted in 26 diffe- rently aged cohorts along the chronosequence. Five dis- tinct patch age intervals were identified by data analysis. They were Young (6 - 10 years), Young-Midaged (17 - 34 years), Midaged (36 - 53 years), Mid-Mature (60 - 71 years), and Mature (86 - 110 years). The mean patch DBH, height, BA, and volume increased significantly among the five time intervals (Table 2). For example, the mean DBH for patches between 6 - 10 years after estab- lishment was approximately 6.0 cm, 20 - 25 cm for the patches 35 - 52 years, and greater than 30.0 cm for the patches greater than 85 years (mature age). Height, BA, and volume exhibited similar results, even though stand density was highly variable with no identifiable temporal patterns (Table 2). Polynomial regression analysis revealed all of the stand variables, except for stand density, increased with patch age. Patch mean DBH and height increased with age until they reached an asymptote at 85 - 90 yrs. Stand basal area and volume followed similar regression curves as with DBH and height (Figure 2). The diameter distri- bution of trees by patch age interval reflected the in- crease in diameter (Figure 3). Table 1. Soil and stand properties between the three reference sites. Location Soil Great Group Soil Texture (Top 10 cm) Moisture Regime Temperature Regime Drainage Class Chassahowitzka Wildlife Management Area Psammaquent Sandy Aquic Hyperthermic Very poorly drained Alaquod Sandy Aquic Hyperthermic Poorly drained St. Marks National Wildlife Refuge Psammaquent Sandy Aquic Thermic Very poorly drained Alaquod Sandy Aquic Thermic Poorly drained Topsail Hill State Preserve Humaquept Sandy Aquic Thermic Very poorly drained Alaquod Sandy Aquic Thermic Poorly drained Stand Basal Area and Soil Biochemical Properties (Mean Values*) Drainage Class Stand Basal Area (m2/ha) pH-log [H+] Net Nitrogen Mineralization Rates (mg N/kg–1 soil/month–1) Microbial Biomass Carbon (mg C/kg–1 soil) Very poorly drained 6.5a 4.4a 11.6a 374.3a Poorly drained 8.3a 4.5a 9.9a 356.1a *Means between drainage classes followed by the same lower case letters are not significantly different (alpha = 0.05). 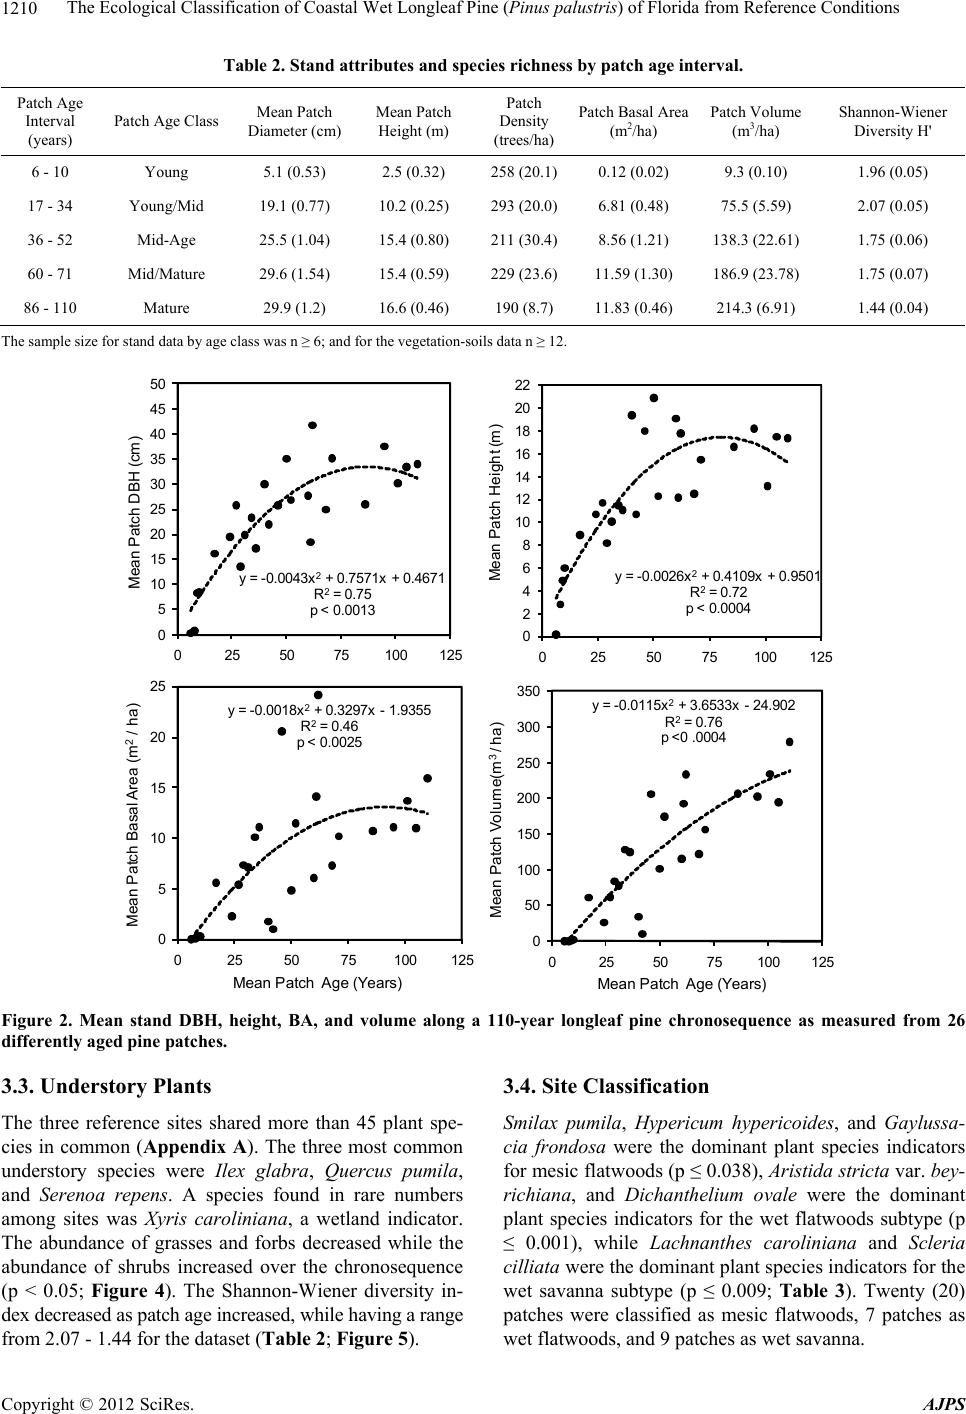 The Ecological Classification of Coastal Wet Longleaf Pine (Pinus palustris) of Florida from Reference Conditions 1210 Table 2. Stand attributes and specie s ri c hness by patch age interval. Patch Age Interval (years) Patch Age Class Mean Patch Diameter (cm) Mean Patch Height (m) Patch Density (trees/ha) Patch Basal Area (m2/ha) Patch Volume (m3/ha) Shannon-Wiener Diversity H' 6 - 10 Young 5.1 (0.53) 2.5 (0.32) 258 (20.1) 0.12 (0.02) 9.3 (0.10) 1.96 (0.05) 17 - 34 Young/Mid 19.1 (0.77) 10.2 (0.25) 293 (20.0) 6.81 (0.48) 75.5 (5.59) 2.07 (0.05) 36 - 52 Mid-Age 25.5 (1.04) 15.4 (0.80) 211 (30.4) 8.56 (1.21) 138.3 (22.61) 1.75 (0.06) 60 - 71 Mid/Mature 29.6 (1.54) 15.4 (0.59) 229 (23.6) 11.59 (1.30) 186.9 (23.78) 1.75 (0.07) 86 - 110 Mature 29.9 (1.2) 16.6 (0.46) 190 (8.7) 11.83 (0.46) 214.3 (6.91) 1.44 (0.04) The sample size for stand data by age class was n ≥ 6; and for the vegetation-soils data n ≥ 12. y = -0.0043x 2 + 0.7571x + 0.4671 R 2 = 0.75 p < 0.0013 0 5 10 15 20 25 30 35 40 45 50 025 50 75100125 Mean Patch DBH (cm) y = -0.0026x 2 + 0.4109x + 0.9501 R 2 = 0.72 p < 0.0004 0 2 4 6 8 10 12 14 16 18 20 22 0255075100 125 M e an Pa t c h He ig ht ( m) y = -0.0018x 2 + 0.3297x -1.9355 R 2 = 0.46 p < 0.0025 0 5 10 15 20 25 025 50 75100125 Mean Patch Basal Area ( m 2 / ha) Mean Patch Age (Years) y = -0.0115x 2 + 3.6533x -24.902 R 2 = 0.76 p <0 .0004 0 50 100 150 200 250 300 350 0255075100 125 Mean Patch V olume(m 3 / ha) Mean Patch Age (Years) Figure 2. Mean stand DBH, height, BA, and volume along a 110-year longleaf pine chronosequence as measured from 26 differently aged pine patches. 3.3. Understory Plants The three reference sites shared more than 45 plant spe- cies in common (Appendix A). The three most common understory species were Ilex glabra, Quercus pumila, and Serenoa repens. A species found in rare numbers among sites was Xyris caroliniana, a wetland indicator. The abundance of grasses and forbs decreased while the abundance of shrubs increased over the chronosequence (p < 0.05; Figure 4). The Shannon-Wiener diversity in- dex decreased as patch age increased, while having a range from 2.07 - 1.44 for the dataset (Table 2; Figure 5). 3.4. Site Classification Smilax pumila, Hypericum hypericoides, and Gaylussa- cia frondosa were the dominant plant species indicators for mesic flatwoods (p ≤ 0.038), Aristida stricta var. bey- richiana, and Dichanthelium ovale were the dominant plant species indicators for the wet flatwoods subtype (p ≤ 0.001), while Lachnanthes caroliniana and Scleria cilliata were the dominant plant species indicators for the wet savanna subtype (p ≤ 0.009; Table 3). Twenty (20) patches were classified as mesic flatwoods, 7 patches as wet flatwoods, and 9 patches as wet savanna. Copyright © 2012 SciRes. AJPS 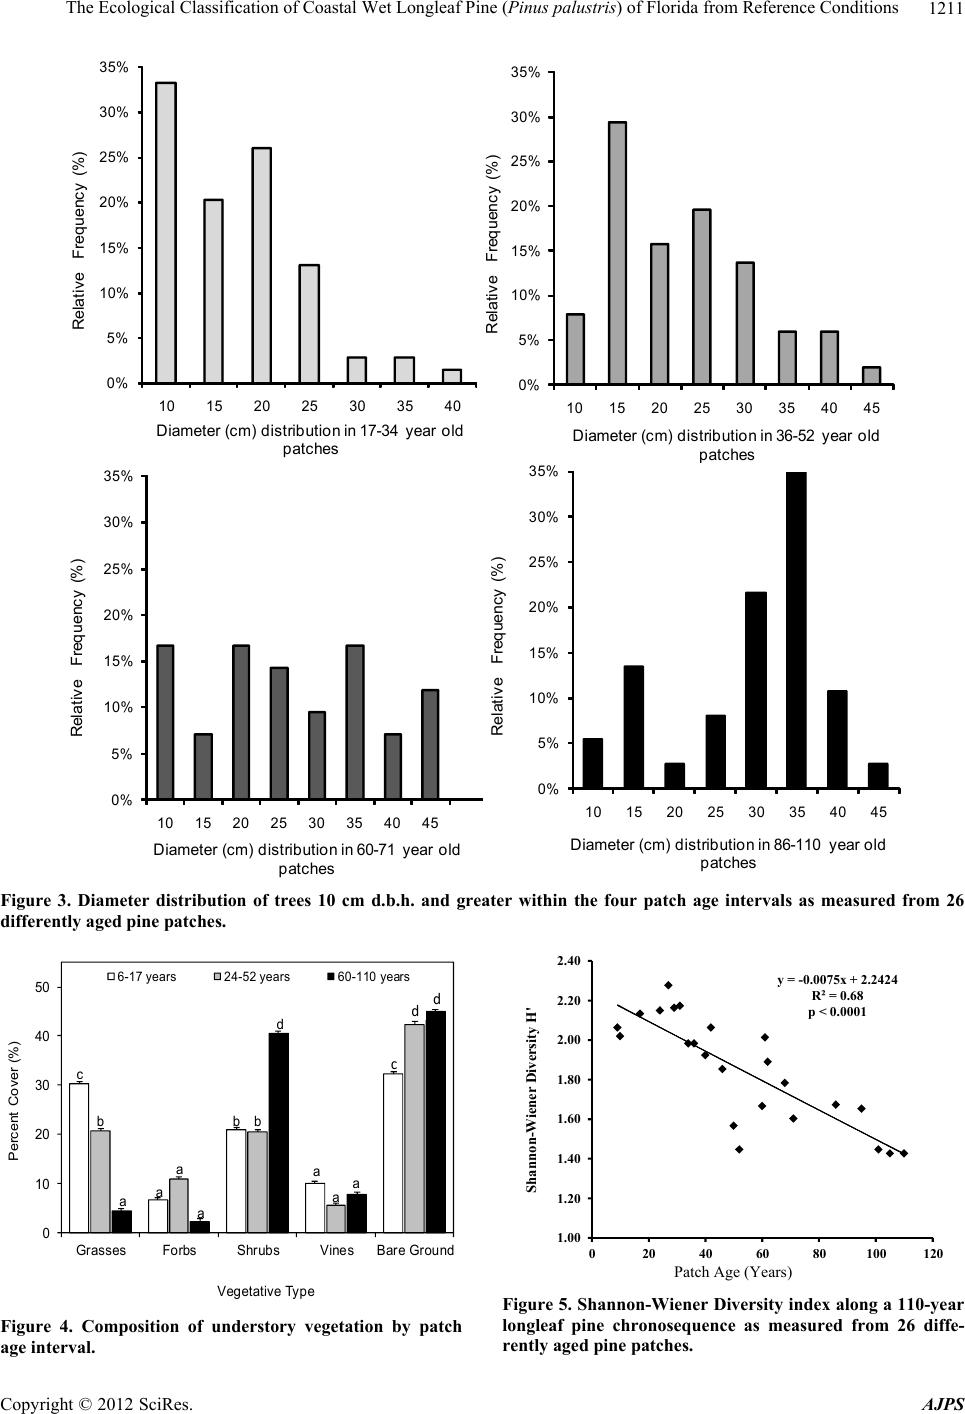 The Ecological Classification of Coastal Wet Longleaf Pine (Pinus palustris) of Florida from Reference Conditions 1211 0% 5% 10% 15% 20% 25% 30% 35% 10 15 20 2530 35 40 Relat i ve Frequency (% ) Diam e t er (cm ) di stributi on in 17-34 y ear o l d patches 0% 5% 10% 15% 20% 25% 30% 35% 10 15 20 25 30 35 40 45 Relat i ve F requency (%) Diam eter (cm) di stri bu t i on i n 36-52 year ol d patches 0% 5% 10% 15% 20% 25% 30% 35% 10 15 20 25 30 3540 45 Relat i ve F requency (% ) D i am et er (cm) d i st ri but i on in 60-71 y ear ol d patches 0% 5% 10% 15% 20% 25% 30% 35% 10 15 20 25 30 35 40 45 Relative Freq uency (%) Diameter (cm) distribution in 86-110 year old patches Figure 3. Diameter distribution of trees 10 cm d.b.h. and greater within the four patch age intervals as measured from 26 differently aged pine patches. 0 10 20 30 40 50 Gras sesForbsS hrubsVinesB are Ground Perc ent Co ver (%) Vegetative Typ e 6-1 7 yea rs24-52 years60-110 years c b a a a bb d a aa a c d d Figure 4. Composition of understory vegetation by patch age interval. y = -0.0075x + 2.2424 R²= 0.68 p < 0.0001 1.00 1.20 1.40 1.60 1.80 2.00 2.20 2.40 0 204060801001 Shannon-Wiener Diversity H' 20 Patch Age (Years) Figure 5. Shannon-Wiener Diversity index along a 110-year longleaf pine chronosequence as measured from 26 diffe- rently aged pine patches. Copyright © 2012 SciRes. AJPS 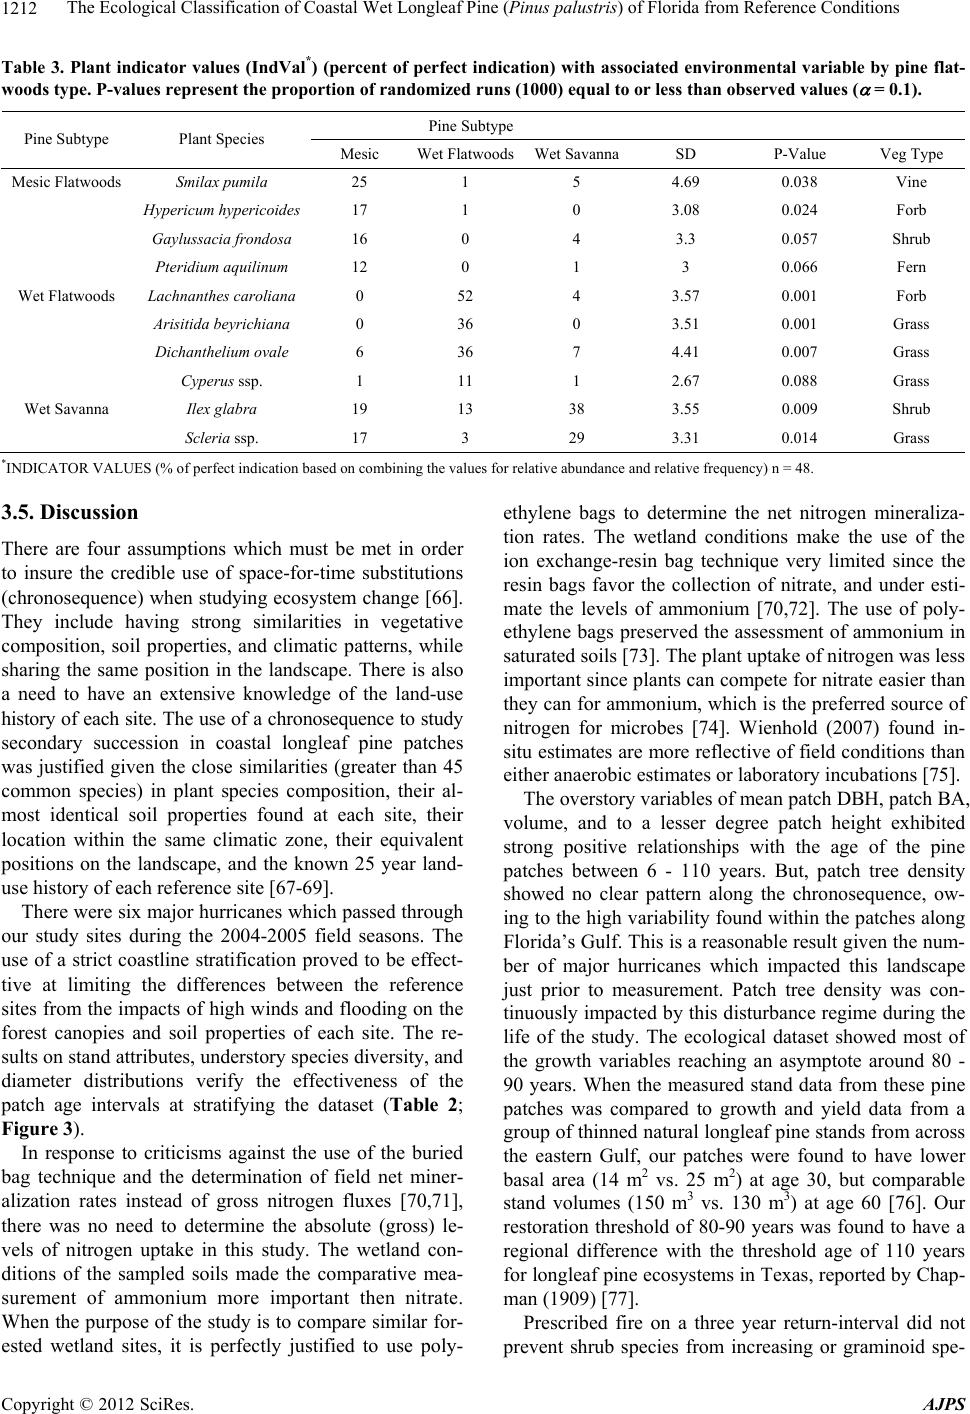 The Ecological Classification of Coastal Wet Longleaf Pine (Pinus palustris) of Florida from Reference Conditions 1212 Table 3. Plant indicator values (IndVal*) (percent of perfect indication) with associated environmental variable by pine flat- woods type. P-values represent the proportion of randomized runs (1000) equal to or less than observed values ( = 0.1). Pine Subtype Pine Subtype Plant Species Mesic Wet FlatwoodsWet SavannaSD P-Value Veg Type Mesic Flatwoods Smilax pumila 25 1 5 4.69 0.038 Vine Hypericum hypericoides 17 1 0 3.08 0.024 Forb Gaylussacia frondosa 16 0 4 3.3 0.057 Shrub Pteridium aquilinum 12 0 1 3 0.066 Fern Wet Flatwoods Lachnanthes caroliana 0 52 4 3.57 0.001 Forb Arisitida beyrichiana 0 36 0 3.51 0.001 Grass Dichanthelium ovale 6 36 7 4.41 0.007 Grass Cyperus ssp. 1 11 1 2.67 0.088 Grass Wet Savanna Il ex gl abra 19 13 38 3.55 0.009 Shrub Scleria ssp. 17 3 29 3.31 0.014 Grass *INDICATOR VALUES (% of perfect indication based on combining the values for relative abundance and relative frequency) n = 48. 3.5. Discussion There are four assumptions which must be met in order to insure the credible use of space-for-time substitutions (chronosequence) when studying ecosystem change [66]. They include having strong similarities in vegetative composition, soil properties, and climatic patterns, while sharing the same position in the landscape. There is also a need to have an extensive knowledge of the land-use history of each site. The use of a chronosequence to study secondary succession in coastal longleaf pine patches was justified given the close similarities (greater than 45 common species) in plant species composition, their al- most identical soil properties found at each site, their location within the same climatic zone, their equivalent positions on the landscape, and the known 25 year land- use history of each reference site [67-69]. There were six major hurricanes which passed through our study sites during the 2004-2005 field seasons. The use of a strict coastline stratification proved to be effect- tive at limiting the differences between the reference sites from the impacts of high winds and flooding on the forest canopies and soil properties of each site. The re- sults on stand attributes, understory species diversity, and diameter distributions verify the effectiveness of the patch age intervals at stratifying the dataset (Table 2; Figure 3). In response to criticisms against the use of the buried bag technique and the determination of field net miner- alization rates instead of gross nitrogen fluxes [70,71], there was no need to determine the absolute (gross) le- vels of nitrogen uptake in this study. The wetland con- ditions of the sampled soils made the comparative mea- surement of ammonium more important then nitrate. When the purpose of the study is to compare similar for- ested wetland sites, it is perfectly justified to use poly- ethylene bags to determine the net nitrogen mineraliza- tion rates. The wetland conditions make the use of the ion exchange-resin bag technique very limited since the resin bags favor the collection of nitrate, and under esti- mate the levels of ammonium [70,72]. The use of poly- ethylene bags preserved the assessment of ammonium in saturated soils [73]. The plant uptake of nitrogen was less important since plants can compete for nitrate easier than they can for ammonium, which is the preferred source of nitrogen for microbes [74]. Wienhold (2007) found in- situ estimates are more reflective of field conditions than either anaerobic estimates or laboratory incubations [75]. The overstory variables of mean patch DBH, patch BA, volume, and to a lesser degree patch height exhibited strong positive relationships with the age of the pine patches between 6 - 110 years. But, patch tree density showed no clear pattern along the chronosequence, ow- ing to the high variability found within the patches along Florida’s Gulf. This is a reasonable result given the num- ber of major hurricanes which impacted this landscape just prior to measurement. Patch tree density was con- tinuously impacted by this disturbance regime during the life of the study. The ecological dataset showed most of the growth variables reaching an asymptote around 80 - 90 years. When the measured stand data from these pine patches was compared to growth and yield data from a group of thinned natural longleaf pine stands from across the eastern Gulf, our patches were found to have lower basal area (14 m2 vs. 25 m2) at age 30, but comparable stand volumes (150 m3 vs. 130 m3) at age 60 [76]. Our restoration threshold of 80-90 years was found to have a regional difference with the threshold age of 110 years for longleaf pine ecosystems in Texas, reported by Chap- man (1909) [77]. Prescribed fire on a three year return-interval did not prevent shrub species from increasing or graminoid spe- Copyright © 2012 SciRes. AJPS 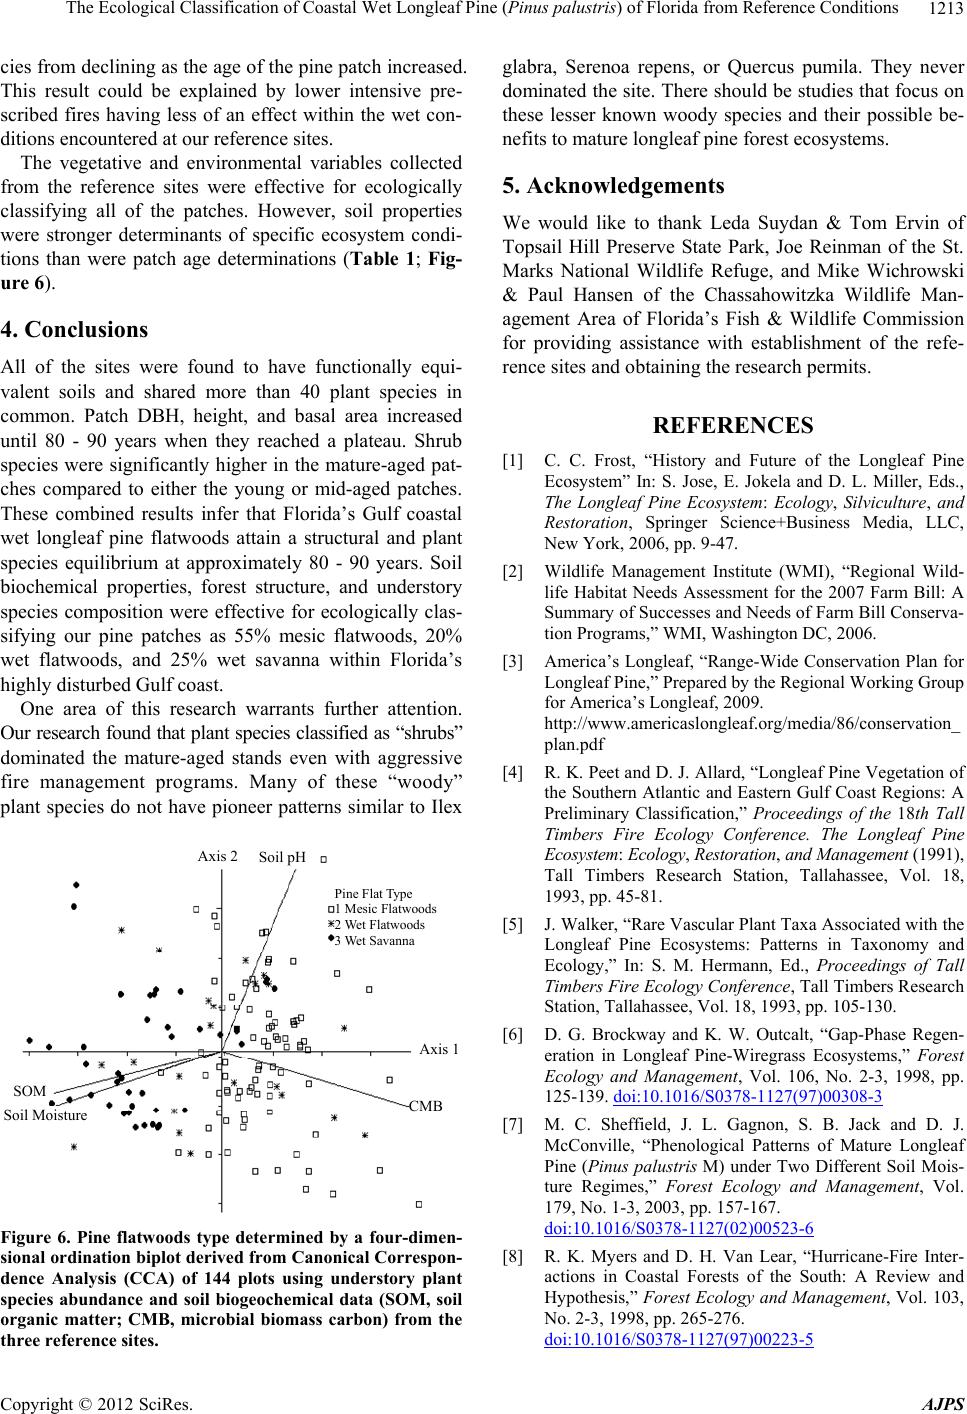 The Ecological Classification of Coastal Wet Longleaf Pine (Pinus palustris) of Florida from Reference Conditions 1213 cies from declining as the age of the pine patch increased. This result could be explained by lower intensive pre- scribed fires having less of an effect within the wet con- ditions encountered at our reference sites. The vegetative and environmental variables collected from the reference sites were effective for ecologically classifying all of the patches. However, soil properties were stronger determinants of specific ecosystem condi- tions than were patch age determinations (Table 1; Fig- ure 6). 4. Conclusions All of the sites were found to have functionally equi- valent soils and shared more than 40 plant species in common. Patch DBH, height, and basal area increased until 80 - 90 years when they reached a plateau. Shrub species were significantly higher in the mature-aged pat- ches compared to either the young or mid-aged patches. These combined results infer that Florida’s Gulf coastal wet longleaf pine flatwoods attain a structural and plant species equilibrium at approximately 80 - 90 years. Soil biochemical properties, forest structure, and understory species composition were effective for ecologically clas- sifying our pine patches as 55% mesic flatwoods, 20% wet flatwoods, and 25% wet savanna within Florida’s highly disturbed Gulf coast. One area of this research warrants further attention. Our research found that plant species classified as “shrubs” dominated the mature-aged stands even with aggressive fire management programs. Many of these “woody” plant species do not have pioneer patterns similar to Ilex Axis 2Soil pH Pine Flat Type 1 Mesic Flatwoods 2 Wet Flatwoods 3 Wet Savanna Axis 1 CMB SOM Soil Moisture Figure 6. Pine flatwoods type determined by a four-dimen- sional ordination biplot derived from Canonical Correspon- dence Analysis (CCA) of 144 plots using understory plant species abundance and soil biogeochemical data (SOM, soil organic matter; CMB, microbial biomass carbon) from the three reference sites . glabra, Serenoa repens, or Quercus pumila. They never dominated the site. There should be studies that focus on these lesser known woody species and their possible be- nefits to mature longleaf pine forest ecosystems. 5. Acknowledgements We would like to thank Leda Suydan & Tom Ervin of Topsail Hill Preserve State Park, Joe Reinman of the St. Marks National Wildlife Refuge, and Mike Wichrowski & Paul Hansen of the Chassahowitzka Wildlife Man- agement Area of Florida’s Fish & Wildlife Commission for providing assistance with establishment of the refe- rence sites and obtaining the research permits. REFERENCES [1] C. C. Frost, “History and Future of the Longleaf Pine Ecosystem” In: S. Jose, E. Jokela and D. L. Miller, Eds., The Longleaf Pine Ecosystem: Ecology, Silviculture, and Restoration, Springer Science+Business Media, LLC, New York, 2006, pp. 9-47. [2] Wildlife Management Institute (WMI), “Regional Wild- life Habitat Needs Assessment for the 2007 Farm Bill: A Summary of Successes and Needs of Farm Bill Conserva- tion Programs,” WMI, Washington DC, 2006. [3] America’s Longleaf, “Range-Wide Conservation Plan for Longleaf Pine,” Prepared by the Regional Working Group for America’s Longleaf, 2009. http://www.americaslongleaf.org/media/86/conservation_ plan.pdf [4] R. K. Peet and D. J. Allard, “Longleaf Pine Vegetation of the Southern Atlantic and Eastern Gulf Coast Regions: A Preliminary Classification,” Proceedings of the 18th Tall Timbers Fire Ecology Conference. The Longleaf Pine Ecosystem: Ecology, Restoration, and Management (1991), Tall Timbers Research Station, Tallahassee, Vol. 18, 1993, pp. 45-81. [5] J. Walker, “Rare Vascular Plant Taxa Associated with the Longleaf Pine Ecosystems: Patterns in Taxonomy and Ecology,” In: S. M. Hermann, Ed., Proceedings of Tall Timbers Fire Ecology Conference, Tall Timbers Research Station, Tallahassee, Vol. 18, 1993, pp. 105-130. [6] D. G. Brockway and K. W. Outcalt, “Gap-Phase Regen- eration in Longleaf Pine-Wiregrass Ecosystems,” Forest Ecology and Management, Vol. 106, No. 2-3, 1998, pp. 125-139. doi:10.1016/S0378-1127(97)00308-3 [7] M. C. Sheffield, J. L. Gagnon, S. B. Jack and D. J. McConville, “Phenological Patterns of Mature Longleaf Pine (Pinus palustris M) under Two Different Soil Mois- ture Regimes,” Forest Ecology and Management, Vol. 179, No. 1-3, 2003, pp. 157-167. doi:10.1016/S0378-1127(02)00523-6 [8] R. K. Myers and D. H. Van Lear, “Hurricane-Fire Inter- actions in Coastal Forests of the South: A Review and Hypothesis,” Forest Ecology and Management, Vol. 103, No. 2-3, 1998, pp. 265-276. doi:10.1016/S0378-1127(97)00223-5 Copyright © 2012 SciRes. AJPS 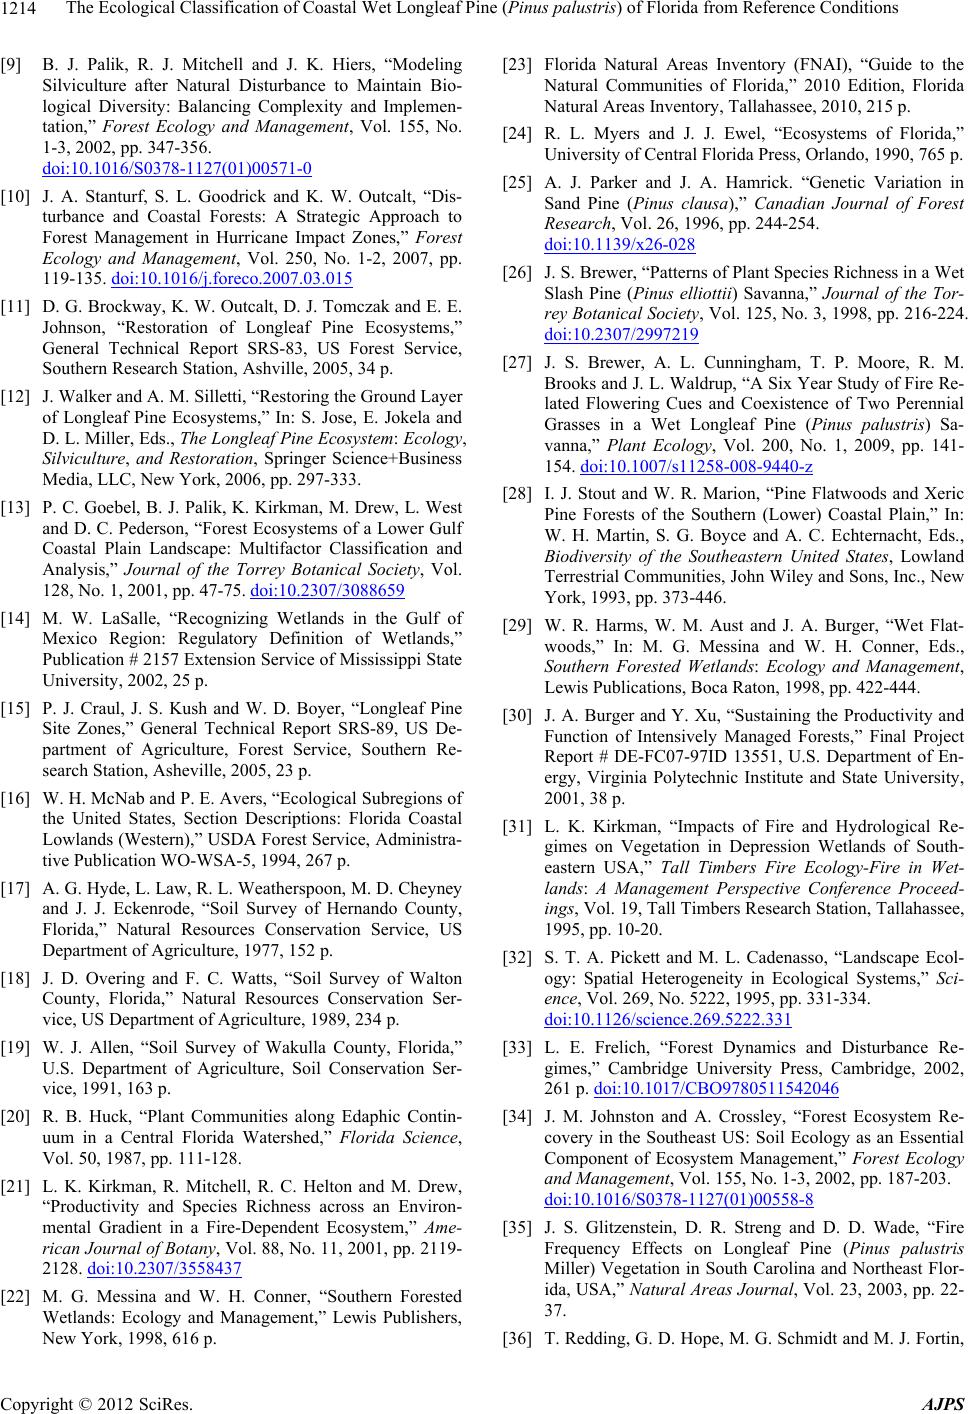 The Ecological Classification of Coastal Wet Longleaf Pine (Pinus palustris) of Florida from Reference Conditions 1214 [9] B. J. Palik, R. J. Mitchell and J. K. Hiers, “Modeling Silviculture after Natural Disturbance to Maintain Bio- logical Diversity: Balancing Complexity and Implemen- tation,” Forest Ecology and Management, Vol. 155, No. 1-3, 2002, pp. 347-356. doi:10.1016/S0378-1127(01)00571-0 [10] J. A. Stanturf, S. L. Goodrick and K. W. Outcalt, “Dis- turbance and Coastal Forests: A Strategic Approach to Forest Management in Hurricane Impact Zones,” Forest Ecology and Management, Vol. 250, No. 1-2, 2007, pp. 119-135. doi:10.1016/j.foreco.2007.03.015 [11] D. G. Brockway, K. W. Outcalt, D. J. Tomczak and E. E. Johnson, “Restoration of Longleaf Pine Ecosystems,” General Technical Report SRS-83, US Forest Service, Southern Research Station, Ashville, 2005, 34 p. [12] J. Walker and A. M. Silletti, “Restoring the Ground Layer of Longleaf Pine Ecosystems,” In: S. Jose, E. Jokela and D. L. Miller, Eds., The Longleaf Pine Ecosystem: Ecology, Silviculture, and Restoration, Springer Science+Business Media, LLC, New York, 2006, pp. 297-333. [13] P. C. Goebel, B. J. Palik, K. Kirkman, M. Drew, L. West and D. C. Pederson, “Forest Ecosystems of a Lower Gulf Coastal Plain Landscape: Multifactor Classification and Analysis,” Journal of the Torrey Botanical Society, Vol. 128, No. 1, 2001, pp. 47-75. doi:10.2307/3088659 [14] M. W. LaSalle, “Recognizing Wetlands in the Gulf of Mexico Region: Regulatory Definition of Wetlands,” Publication # 2157 Extension Service of Mississippi State University, 2002, 25 p. [15] P. J. Craul, J. S. Kush and W. D. Boyer, “Longleaf Pine Site Zones,” General Technical Report SRS-89, US De- partment of Agriculture, Forest Service, Southern Re- search Station, Asheville, 2005, 23 p. [16] W. H. McNab and P. E. Avers, “Ecological Subregions of the United States, Section Descriptions: Florida Coastal Lowlands (Western),” USDA Forest Service, Administra- tive Publication WO-WSA-5, 1994, 267 p. [17] A. G. Hyde, L. Law, R. L. Weatherspoon, M. D. Cheyney and J. J. Eckenrode, “Soil Survey of Hernando County, Florida,” Natural Resources Conservation Service, US Department of Agriculture, 1977, 152 p. [18] J. D. Overing and F. C. Watts, “Soil Survey of Walton County, Florida,” Natural Resources Conservation Ser- vice, US Department of Agriculture, 1989, 234 p. [19] W. J. Allen, “Soil Survey of Wakulla County, Florida,” U.S. Department of Agriculture, Soil Conservation Ser- vice, 1991, 163 p. [20] R. B. Huck, “Plant Communities along Edaphic Contin- uum in a Central Florida Watershed,” Florida Science, Vol. 50, 1987, pp. 111-128. [21] L. K. Kirkman, R. Mitchell, R. C. Helton and M. Drew, “Productivity and Species Richness across an Environ- mental Gradient in a Fire-Dependent Ecosystem,” Ame- rican Journal of Botany, Vol. 88, No. 11, 2001, pp. 2119- 2128. doi:10.2307/3558437 [22] M. G. Messina and W. H. Conner, “Southern Forested Wetlands: Ecology and Management,” Lewis Publishers, New York, 1998, 616 p. [23] Florida Natural Areas Inventory (FNAI), “Guide to the Natural Communities of Florida,” 2010 Edition, Florida Natural Areas Inventory, Tallahassee, 2010, 215 p. [24] R. L. Myers and J. J. Ewel, “Ecosystems of Florida,” University of Central Florida Press, Orlando, 1990, 765 p. [25] A. J. Parker and J. A. Hamrick. “Genetic Variation in Sand Pine (Pinus clausa),” Canadian Journal of Forest Research, Vol. 26, 1996, pp. 244-254. doi:10.1139/x26-028 [26] J. S. Brewer, “Patterns of Plant Species Richness in a Wet Slash Pine (Pinus elliottii) Savanna,” Journal of the Tor- rey Botanical Society, Vol. 125, No. 3, 1998, pp. 216-224. doi:10.2307/2997219 [27] J. S. Brewer, A. L. Cunningham, T. P. Moore, R. M. Brooks and J. L. Waldrup, “A Six Year Study of Fire Re- lated Flowering Cues and Coexistence of Two Perennial Grasses in a Wet Longleaf Pine (Pinus palustris) Sa- vanna,” Plant Ecology, Vol. 200, No. 1, 2009, pp. 141- 154. doi:10.1007/s11258-008-9440-z [28] I. J. Stout and W. R. Marion, “Pine Flatwoods and Xeric Pine Forests of the Southern (Lower) Coastal Plain,” In: W. H. Martin, S. G. Boyce and A. C. Echternacht, Eds., Biodiversity of the Southeastern United States, Lowland Terrestrial Communities, John Wiley and Sons, Inc., New York, 1993, pp. 373-446. [29] W. R. Harms, W. M. Aust and J. A. Burger, “Wet Flat- woods,” In: M. G. Messina and W. H. Conner, Eds., Southern Forested Wetlands: Ecology and Management, Lewis Publications, Boca Raton, 1998, pp. 422-444. [30] J. A. Burger and Y. Xu, “Sustaining the Productivity and Function of Intensively Managed Forests,” Final Project Report # DE-FC07-97ID 13551, U.S. Department of En- ergy, Virginia Polytechnic Institute and State University, 2001, 38 p. [31] L. K. Kirkman, “Impacts of Fire and Hydrological Re- gimes on Vegetation in Depression Wetlands of South- eastern USA,” Tall Timbers Fire Ecology-Fire in Wet- lands: A Management Perspective Conference Proceed- ings, Vol. 19, Tall Timbers Research Station, Tallahassee, 1995, pp. 10-20. [32] S. T. A. Pickett and M. L. Cadenasso, “Landscape Ecol- ogy: Spatial Heterogeneity in Ecological Systems,” Sci- ence, Vol. 269, No. 5222, 1995, pp. 331-334. doi:10.1126/science.269.5222.331 [33] L. E. Frelich, “Forest Dynamics and Disturbance Re- gimes,” Cambridge University Press, Cambridge, 2002, 261 p. doi:10.1017/CBO9780511542046 [34] J. M. Johnston and A. Crossley, “Forest Ecosystem Re- covery in the Southeast US: Soil Ecology as an Essential Component of Ecosystem Management,” Forest Ecology and Management, Vol. 155, No. 1-3, 2002, pp. 187-203. doi:10.1016/S0378-1127(01)00558-8 [35] J. S. Glitzenstein, D. R. Streng and D. D. Wade, “Fire Frequency Effects on Longleaf Pine (Pinus palustris Miller) Vegetation in South Carolina and Northeast Flor- ida, USA,” Natural Areas Journal, Vol. 23, 2003, pp. 22- 37. [36] T. Redding, G. D. Hope, M. G. Schmidt and M. J. Fortin, Copyright © 2012 SciRes. AJPS  The Ecological Classification of Coastal Wet Longleaf Pine (Pinus palustris) of Florida from Reference Conditions 1215 “Analytical Methods for Defining Stand-Clearcut Edge Effects Demonstrated for Nitrogen Mineralization,” Ca- nadian Journal of Forest Research, Vol. 34, No. 5, 2004, pp. 1018-1024. doi:10.1139/x03-282 [37] D. H. Van Lear, W. D. Carroll, P. R. Kapeluch and R. Johnson, “History and Restoration of Longleaf Pine- Grassland Ecosystem: Implications for Species at Risk,” Forest Ecology and Management, Vol. 211, No. 1-2, 2005, 150-165. doi:10.1016/j.foreco.2005.02.014 [38] P. F. Fulé, W. W. Covington and M. M. Moore, “Deter- mining Reference Conditions for Ecosystem Management of Southwestern Ponderosa Pine Forests,” Ecological Ap- plications (ESA), Vol. 7, No. 3, 1997, pp. 895-908. doi:10.1890/1051-0761(1997)007[0895:DRCFEM]2.0.C O;2 [39] G. L. McCaskill, “Longleaf Pine (Pinus palustris Mill) Ecosystem Restoration on Coastal Wet Pine Flats: De- veloping a Monitoring Program Using Vegetation and Soil Characteristics,” Ph.D. Dissertation, University of Florida, Gainesville, 2008. http://ufdcimages.uflib.ufl.edu/UF/E0/01/60/63/00001/mc caskill_g.pdf [40] R. R. Harris, “Defining Reference Conditions for Resto- ration of Riparian Plant Communities: Examples from California, USA,” Environmental Management, Vol. 24, No. 1, 1999, pp. 55-63. doi:10.1007/s002679900214 [41] G. E. Griffith, J. M. Omemik, C. M. Rohm and S. M. Pierson, “Florida Regionalization Project,” U.S. Environ- mental Protection Agency, National Health and Environ- mental Effects Research Laboratory, Corvallis, Oregon, EPA/600/Q-95/002, 1994, 83 p. [42] G. E. Griffith and J. M. Omernik, “Ecoregions of Florida (EPA),” In: C. J. Cleveland, Ed., Encyclopedia of Earth, Environmental Information Coalition, National Council for Science and the Environment, Washington DC, Last revised 11 December 2008. http://www.eoearth.org/article/Ecoregions_of_Florida_(E PA) [43] S. Spencer, “Plant Communities of Chassahowitzka Wild- life Management Area,” Division of Wildlife and Florida Natural Areas Inventory, Florida Fish and Wildlife Con- servation Commission, 2004, 31 p. [44] J. P. Reinman, “A Survey of the Understory Vegetation Communities of the St. Marks National Wildlife Refuge,” Technical Report # 41640-79-1, US Fish and Wildlife Service, 1985, 89 p. [45] B. A. White, et al., “Topsail Hill Preserve State Park Unit Management Plan,” Division of Recreation and Parks, Florida Department of Environmental Protection, 2000, 104 p. [46] J. L. Gagnon, E. J. Jokela, W. K. Moser and D. F. Huber, “Characteristics of Gaps and Natural Regeneration in Mature Longleaf Pine Flatwoods Ecosystems,” Forest Ecology and Management, Vol. 187, No. 2-3, 2004, pp. 373-380. doi:10.1016/j.foreco.2003.07.002 [47] A. Youngblood, T. Max and K. Coe, “Stand Structure in Eastside Old-Growth Ponderosa Pine Forests of Oregon and Northern California,” Forest Ecology and Manage- ment, Vol. 199, No. 2-3, 2004, pp. 191-217. doi:10.1016/j.foreco.2004.05.056 [48] K. F. Wenger, “Forestry Handbook,” 2nd Edition, Society of American Foresters, John Wiley & Sons, New York, 1984, 1335 p. [49] R. K. Peet, T. R. Wentworth and P. S. White, “A Flexible Multipurpose Method for Recording Vegetation Compo- sition and Structure,” Castanea, Vol. 63, 1998, pp. 262- 274. [50] R. F. Daubenmire, “Canopy Coverage Method of Vegeta- tion Analysis,” Northwest Science, Vol. 33, 1959, pp. 43- 64. [51] G. Spyreas and J. W. Mathews, “Floristic Conservation Value, Nested Understory Floras, and the Development of Second Growth Forests,” Ecological Applications, Vol. 16, No. 4, 2006, pp. 1351-1366. doi:10.1890/1051-0761(2006)016[1351:FCVNUF]2.0.C O;2 [52] R. K. Colwell, “Estimates: Statistical Estimation of Spe- cies Richness and Shared Species from Samples,” Ver- sion 8, 2006. http://viceroy.eeb.uconn.edu/estimates/ [53] E. O. McLean, “Soil pH and Lime Requirement,” In: Methods in Soil Analysis, Part 2. Chemical and Microbi- ological Properties, 2nd Edition, Soil Science Society of America, Madison, 1982, pp. 199-244. [54] A. Walkley, “A Critical Examination of a Rapid Method for Determining Organic Carbon in Soils: Effect of Variation in Digestion Conditions and of Inorganic Soil Constituents,” Soil Sc ience, Vol. 63, 1947, pp. 251-263. doi:10.1097/00010694-194704000-00001 [55] C. Eno, “Nitrate Production in the Field by Incubating the Soil in Polyethylene Bags,” Soil Science Society Ameri- can Journal, Vol. 24, No. 4, 1960, pp. 277-279. doi:10.2136/sssaj1960.03615995002400040019x [56] D. R. Keeney and D. W. Nelson, “Nitrogen-Inorganic Forms,” In: Methods in Soil Analysis, Part 2. Chemical and Microbiological Properties, 2nd Edition, Soil Sci- ence Society of America, Madison, 1982. [57] E. D. Vance, P. C. Brookes and D. S. Jenkinson, “An Extraction Method for Measuring Soil Microbial Biomass Carbon,” Soil Biology and Biochemistry, Vol. 19, No. 6, 1987, pp. 703-707. doi:10.1016/0038-0717(87)90052-6 [58] F. Müller, “Gradients in Ecological Systems,” Ecological Modelling, Vol. 108, No. 1-3, 1998, pp. 3-21. doi:10.1016/S0304-3800(98)00015-5 [59] J. C. Aravena, M. R. Carmona, C. A. Perez and J. J. Armesto, “Changes in Tree Species Richness, Stand Struc- ture and Soil Properties in a Successional Chronosequence in Northern Chiloe’ Island, Chile,” Revista Chilena de Histo r ia N a tu ral , Vol. 52, 2002, pp. 1-30. [60] SAS Institute Inc., “SAS/STAT® 9.2 User’s Guide,” SAS Institute Inc., Cary, 2008. [61] B. McCune and M. J. Meffrod, “PC-ORD: Multivariate Analysis of Ecological Data,” Version 4.0. MjM Software, Gleneden Beach, 1999. [62] M. W. Palmer, “Putting Things in Even Better Order: The Advantages of Canonical Correspondence Analysis,” Ecology, Vol. 74, No. 8, 1993, pp. 2215-2230. doi:10.2307/1939575 Copyright © 2012 SciRes. AJPS  The Ecological Classification of Coastal Wet Longleaf Pine (Pinus palustris) of Florida from Reference Conditions Copyright © 2012 SciRes. AJPS 1216 [63] C. J. F. Ter Braak, “Canonical Correspondence Analysis: A New Eigenvector Technique for Multivariate Direct Gradient Analysis,” Ecology, Vol. 67, No. 5, 1986, pp. 1167-1179. doi:10.2307/1938672 [64] R. E. Strauss, “Statistical Significance of Species Clusters in Association Analysis,” Ecology, Vol. 63, No. 3, 1982, pp. 634-639. doi:10.2307/1936782 [65] M. Dufrene and P. Legendre, “Species Assemblages and Indicator Species: The Need for a Flexible Asymmetrical Approach,” Ecological Monographs, Vol. 67, 1997, pp. 345-366. [66] E. A. Johnson and K. Miyanishi, “Testing the Assump- tions of Chronosequences in Succession,” Ecology Letters, Vol. 11, 2008, pp. 419-431. doi:10.1111/j.1461-0248.2008.01173.x [67] B. L. Foster and D. Tilman, “Dynamic and Static Views of Succession: Testing the Descriptive Power of the Chronosequence Approach,” Plant Ecology, Vol. 146, No. 1, 2000, pp. 1-10. doi:10.1023/A:1009895103017 [68] R. W. Myster and M. P. Malahy, “Is There a Middle Way between Permanent Plots and Chronosequences?” Cana- dian Journal of Forest Research, Vol. 38, 1998, pp. 3133-3138. [69] L. R. Walker, D. A. Wardle, R. D. Bardgett and B. D. Clarkson, “The Use of Chronosequences in Studies of Ecological Succession and Soil Development,” Journal of Ecology, Vol. 98, 2010, pp. 725-736. doi:10.1111/j.1365-2745.2010.01664.x [70] D. Binkley, “Ion Exchange Resin Bags: Factors Affecting Estimates of Nitrogen Availability,” Soil Science Society American Journal, Vol. 48, No. 5, 1984, pp. 1181-1184. doi:10.2136/sssaj1984.03615995004800050046x [71] R. F. Powers, “Biomass Nitrogen Mineralization along an Altitudinal Gradient: Interactions of Soil Temperature, Moisture, and Substrate Quality,” Forest Ecology and Management, Vol. 30, No. 1-4, 1990, pp. 19-29. doi:10.1016/0378-1127(90)90123-S [72] M. F. Isaac and V. R. Timmer, “Comparing in-Situ Methods for Measuring Nitrogen Mineralization under Mock Precipitation Regimes,” Canadian Journal of Soil Science, Vol. 87, No. 1, 2007, pp. 39-42. doi:10.4141/S06-024 [73] G. B. Noe, “Measurement of Net Nitrogen and Phospho- rus Mineralization in Wetland Soils Using a Modification of the Resin-Core Technique,” Soil Science Society American Journal, Vol. 75, 2011, pp. 760-770. [74] D. Wedin and D. Tilman, “Competition among Grasses along a Nitrogen Gradient: Initial Conditions and Mecha- nisms of Competition,” Ecological Monographs, Vol. 63, No. 2, 1993, pp. 199-229. doi:10.2307/2937180 [75] B. J. Wienhold, “Comparison of Laboratory Methods and an in Situ Method for Estimating Nitrogen Mineralization in an Irrigated Silt-Loam Soil,” Communications in Soil Scie nce an d Plant Anal ysi s, Vol. 38, No. 13-14, 2007, pp. 1721-1732. doi:10.1080/00103620701435498 [76] R. M. Farrar, “Volume and Growth Predictions for Thinned Even-Aged Natural Longleaf Pine Stands in the East Gulf Area,” USDA Forest Service, Research Paper SO-220, Southern Forest Experiment Station, New Or- leans, 1985, 171 p. [77] H. H. Chapman, “A Method of Studying Growth and Yield of Longleaf Pine Applied in Tyler County, Texas,” Proceedings: Society of American Foresters National Convention, Vol. 4, 1909, pp. 207-220. 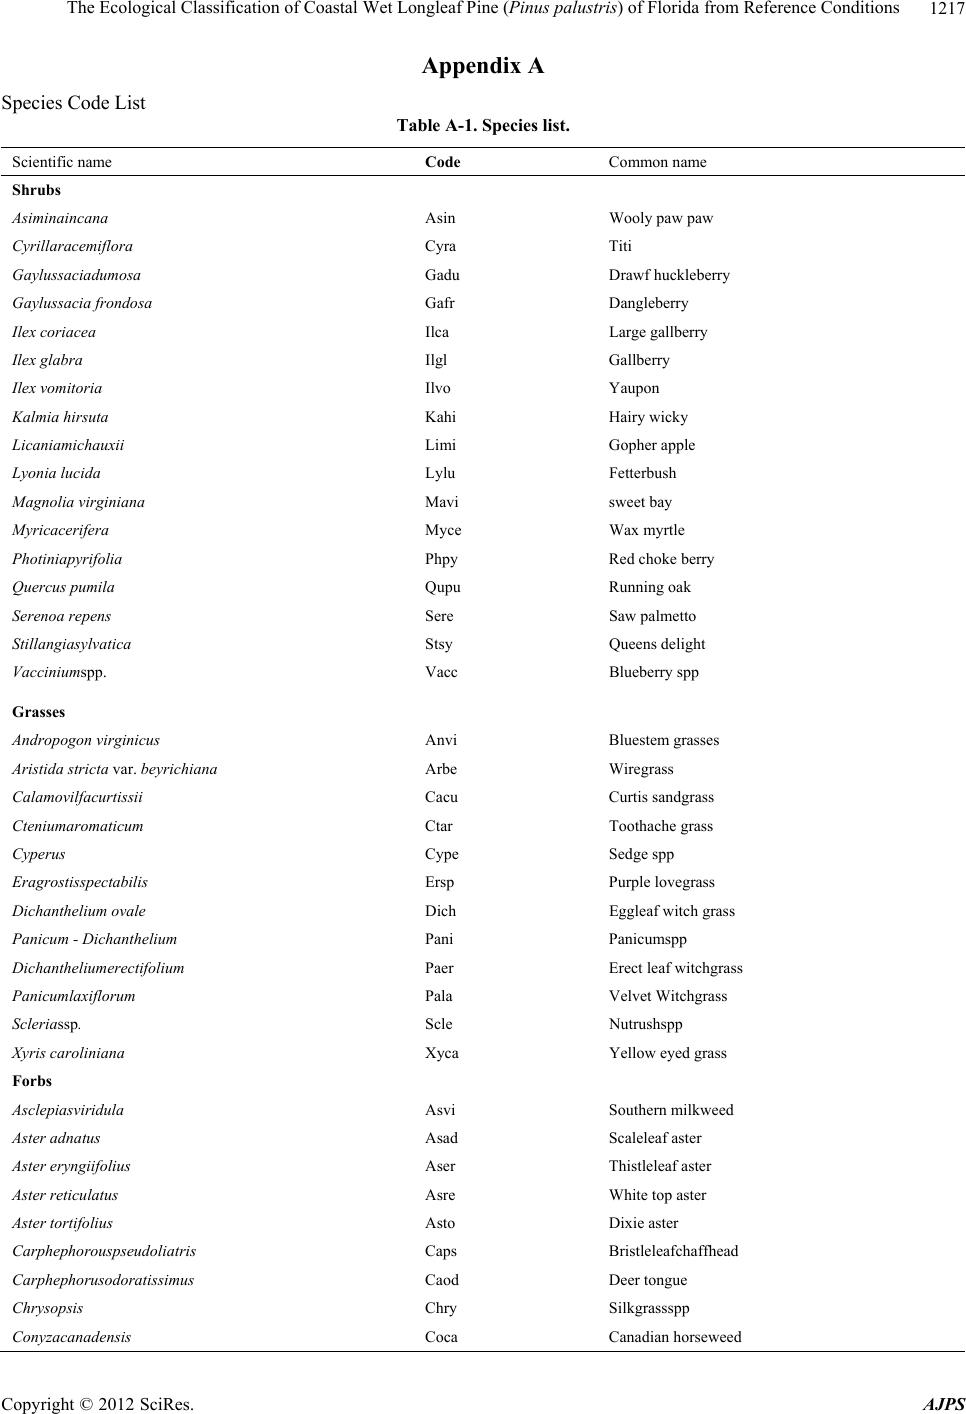 The Ecological Classification of Coastal Wet Longleaf Pine (Pinus palustris) of Florida from Reference Conditions 1217 Appendix A Species Code List Table A-1. Species list. Scientific name Code Common name Shrubs Asiminaincana Asin Wooly paw paw Cyrillaracemiflora Cyra Titi Gaylussaciadumosa Gadu Drawf huckleberry Gaylussacia frondosa Gafr Dangleberry Ilex coriacea Ilca Large gallberry Ilex glabra Ilgl Gallberry Ilex vomitoria Ilvo Yaupon Kalmia hirsuta Kahi Hairy wicky Licaniamichauxii Limi Gopher apple Lyonia lucida Lylu Fetterbush Magnolia virginiana Mavi sweet bay Myricacerifera Myce Wax myrtle Photiniapyrifolia Phpy Red choke berry Quercus pumila Qupu Running oak Serenoa repens Sere Saw palmetto Stillangiasylvatica Stsy Queens delight Vacciniumspp. Vacc Blueberry spp Grasses Andropogon virginicus Anvi Bluestem grasses Aristida stricta var. beyrichiana Arbe Wiregrass Calamovilfacurtissii Cacu Curtis sandgrass Cteniumaromaticum Ctar Toothache grass Cyperus Cype Sedge spp Eragrostisspectabilis Ersp Purple lovegrass Dichanthelium ovale Dich Eggleaf witch grass Panicum - Dichanthelium Pani Panicumspp Dichantheliumerectifolium Paer Erect leaf witchgrass Panicumlaxiflorum Pala Velvet Witchgrass Scleriassp. Scle Nutrushspp Xyris caroliniana Xyca Yellow eyed grass Forbs Asclepiasviridula Asvi Southern milkweed Aster adnatus Asad Scaleleaf aster Aster eryngiifolius Aser Thistleleaf aster Aster reticulatus Asre White top aster Aster tortifolius Asto Dixie aster Carphephorouspseudoliatris Caps Bristleleafchaffhead Carphephorusodoratissimus Caod Deer tongue Chrysopsis Chry Silkgrassspp Conyzacanadensis Coca Canadian horseweed Copyright © 2012 SciRes. AJPS 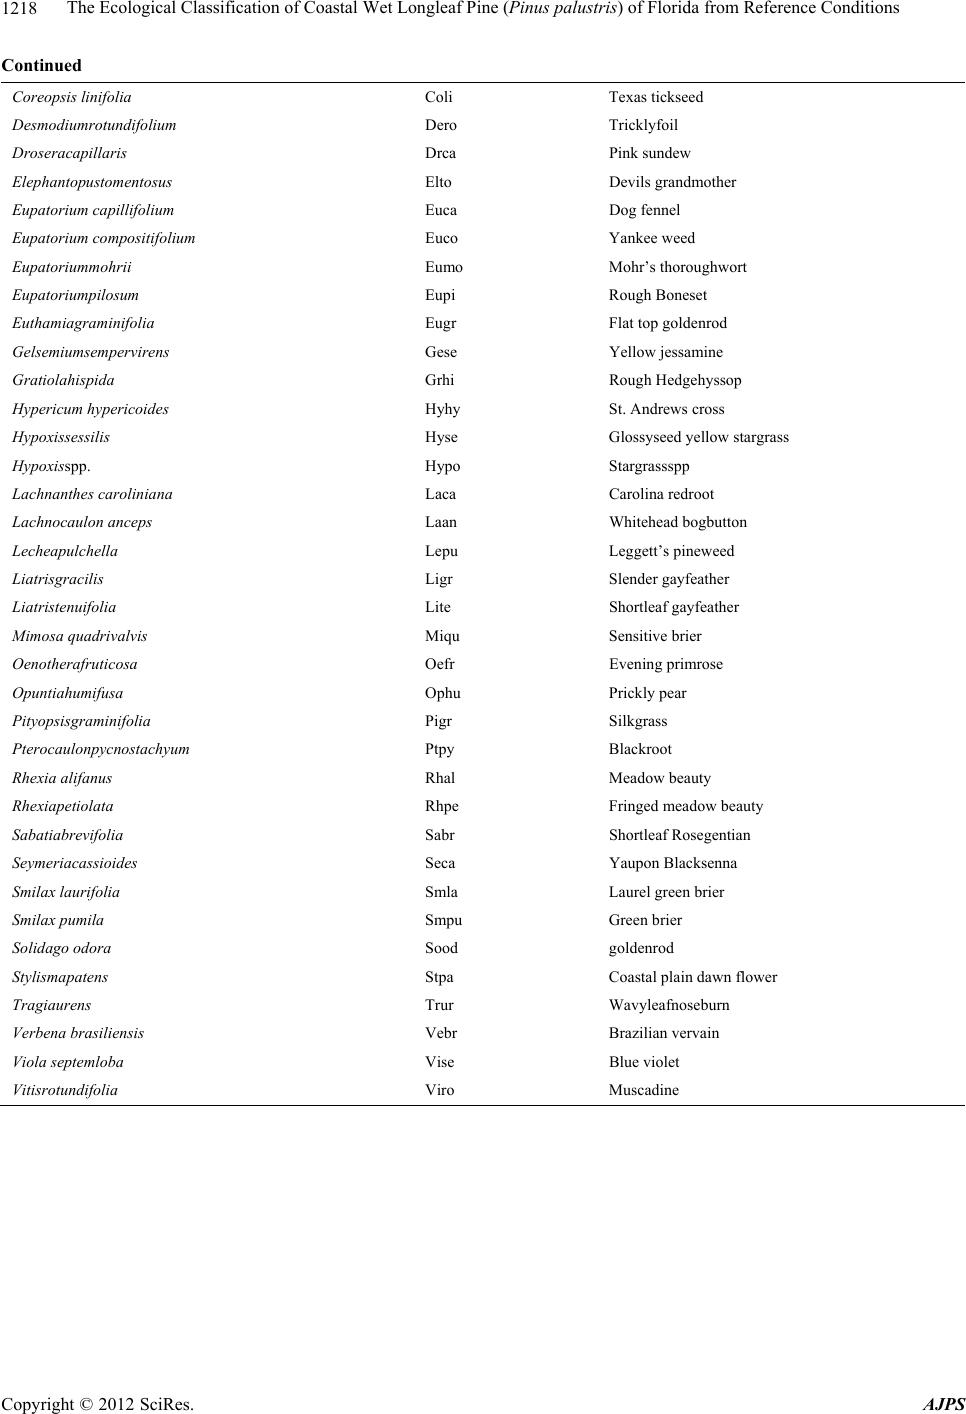 The Ecological Classification of Coastal Wet Longleaf Pine (Pinus palustris) of Florida from Reference Conditions Copyright © 2012 SciRes. AJPS 1218 Continued Coreopsis linifolia Coli Texas tickseed Desmodiumrotundifolium Dero Tricklyfoil Droseracapillaris Drca Pink sundew Elephantopustomentosus Elto Devils grandmother Eupatorium capillifoliu m Euca Dog fennel Eupatorium compositifolium Euco Yankee weed Eupatoriummohrii Eumo Mohr’s thoroughwort Eupatoriumpilosum Eupi Rough Boneset Euthamiagraminifolia Eugr Flat top goldenrod Gelsemiumsempervirens Gese Yellow jessamine Gratiolahispida Grhi Rough Hedgehyssop Hypericum hypericoides Hyhy St. Andrews cross Hypoxissessilis Hyse Glossyseed yellow stargrass Hypoxisspp. Hypo Stargrassspp Lachnanthes caroliniana Laca Carolina redroot Lachnocaulon anceps Laan Whitehead bogbutton Lecheapulchella Lepu Leggett’s pineweed Liatrisgracilis Ligr Slender gayfeather Liatristenuifolia Lite Shortleaf gayfeather Mimosa quadrivalvis Miqu Sensitive brier Oenotherafruticosa Oefr Evening primrose Opuntiahumifusa Ophu Prickly pear Pityopsisgraminifolia Pigr Silkgrass Pterocaulonpycnostachyum Ptpy Blackroot Rhexia alifanus Rhal Meadow beauty Rhexiapetiolata Rhpe Fringed meadow beauty Sabatiabrevifolia Sabr Shortleaf Rosegentian Seymeriacassioides Seca Yaupon Blacksenna Smilax laurifolia Smla Laurel green brier Smilax pumila Smpu Green brier Solidago odora Sood goldenrod Stylismapatens Stpa Coastal plain dawn flower Tragiaurens Trur Wavyleafnoseburn Verbena brasiliensis Vebr Brazilian vervain Viola septemloba Vise Blue violet Vitisrotundifolia Viro Muscadine |