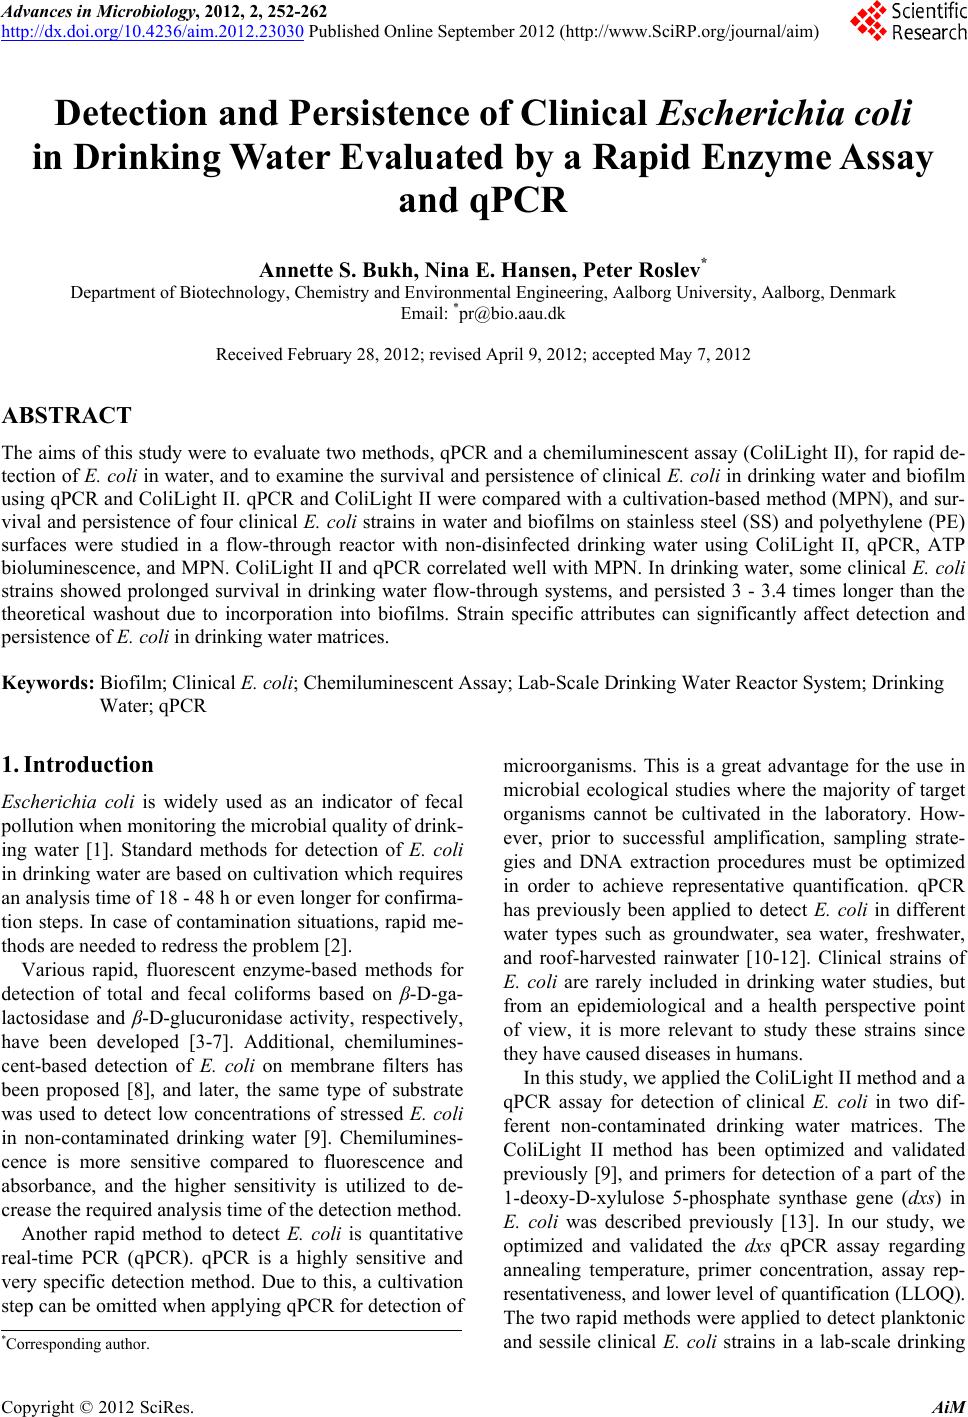
 Advances in Microbiology, 2012, 2, 252-262 http://dx.doi.org/10.4236/aim.2012.23030 Published Online September 2012 (http://www.SciRP.org/journal/aim) Detection and Persistence of Clinical Escherichia coli in Drinking Water Evaluated by a Rapid Enzyme Assay and qPCR Annette S. Bukh, Nina E. Hansen, Peter Roslev* Department of Biotechnology, Chemistry and Environmental Engineering, Aalborg University, Aalborg, Denmark Email: *pr@bio.aau.dk Received February 28, 2012; revised April 9, 2012; accepted May 7, 2012 ABSTRACT The aims of this study were to evaluate two methods, qPCR and a chemiluminescent assay (ColiLight II), for rapid de- tection of E. coli in water, and to examine the survival and persistence of clinical E. coli in drinking water and biofilm using qPCR and ColiLight II. qPCR and ColiLight II were compared with a cultivation-based method (MPN), and sur- vival and persistence of four clinical E. coli strains in water and biofilms on stainless steel (SS) and polyethylene (PE) surfaces were studied in a flow-through reactor with non-disinfected drinking water using ColiLight II, qPCR, ATP bioluminescence, and MPN. ColiLight II and qPCR correlated well with MPN. In drinking water, some clinical E. coli strains showed prolonged survival in drinking water flow-through systems, and persisted 3 - 3.4 times longer than the theoretical washout due to incorporation into biofilms. Strain specific attributes can significantly affect detection and persistence of E. coli in drinking water matrices. Keywords: Biofilm; Clinical E. coli; Chemiluminescent Assay; Lab-Scale Drinking Water Reactor System; Drinking Water; qPCR 1. Introduction Escherichia coli is widely used as an indicator of fecal pollution when monitoring the microbial quality of drink- ing water [1]. Standard methods for detection of E. coli in drinking water are based on cultivation which requires an analysis time of 18 - 48 h or even longer for confirma- tion steps. In case of contamination situations, rapid me- thods are needed to redress the problem [2]. Various rapid, fluorescent enzyme-based methods for detection of total and fecal coliforms based on β-D-ga- lactosidase and β-D-glucuronidase activity, respectively, have been developed [3-7]. Additional, chemilumines- cent-based detection of E. coli on membrane filters has been proposed [8], and later, the same type of substrate was used to detect low concentrations of stressed E. coli in non-contaminated drinking water [9]. Chemilumines- cence is more sensitive compared to fluorescence and absorbance, and the higher sensitivity is utilized to de- crease the required analysis time of the detection method. Another rapid method to detect E. coli is quantitative real-time PCR (qPCR). qPCR is a highly sensitive and very specific detection method. Due to this, a cultivation step can be omitted when applying qPCR for detection of microorganisms. This is a great advantage for the use in microbial ecological studies where the majority of target organisms cannot be cultivated in the laboratory. How- ever, prior to successful amplification, sampling strate- gies and DNA extraction procedures must be optimized in order to achieve representative quantification. qPCR has previously been applied to detect E. coli in different water types such as groundwater, sea water, freshwater, and roof-harvested rainwater [10-12]. Clinical strains of E. coli are rarely included in drinking water studies, but from an epidemiological and a health perspective point of view, it is more relevant to study these strains since they have caused diseases in humans. In this study, we applied the ColiLight II method and a qPCR assay for detection of clinical E. coli in two dif- ferent non-contaminated drinking water matrices. The ColiLight II method has been optimized and validated previously [9], and primers for detection of a part of the 1-deoxy-D-xylulose 5-phosphate synthase gene (dxs) in E. coli was described previously [13]. In our study, we optimized and validated the dxs qPCR assay regarding annealing temperature, primer concentration, assay rep- resentativeness, and lower level of quantification (LLOQ). The two rapid methods were applied to detect planktonic and sessile clinical E. coli strains in a lab-scale drinking *Corresponding author. C opyright © 2012 SciRes. AiM 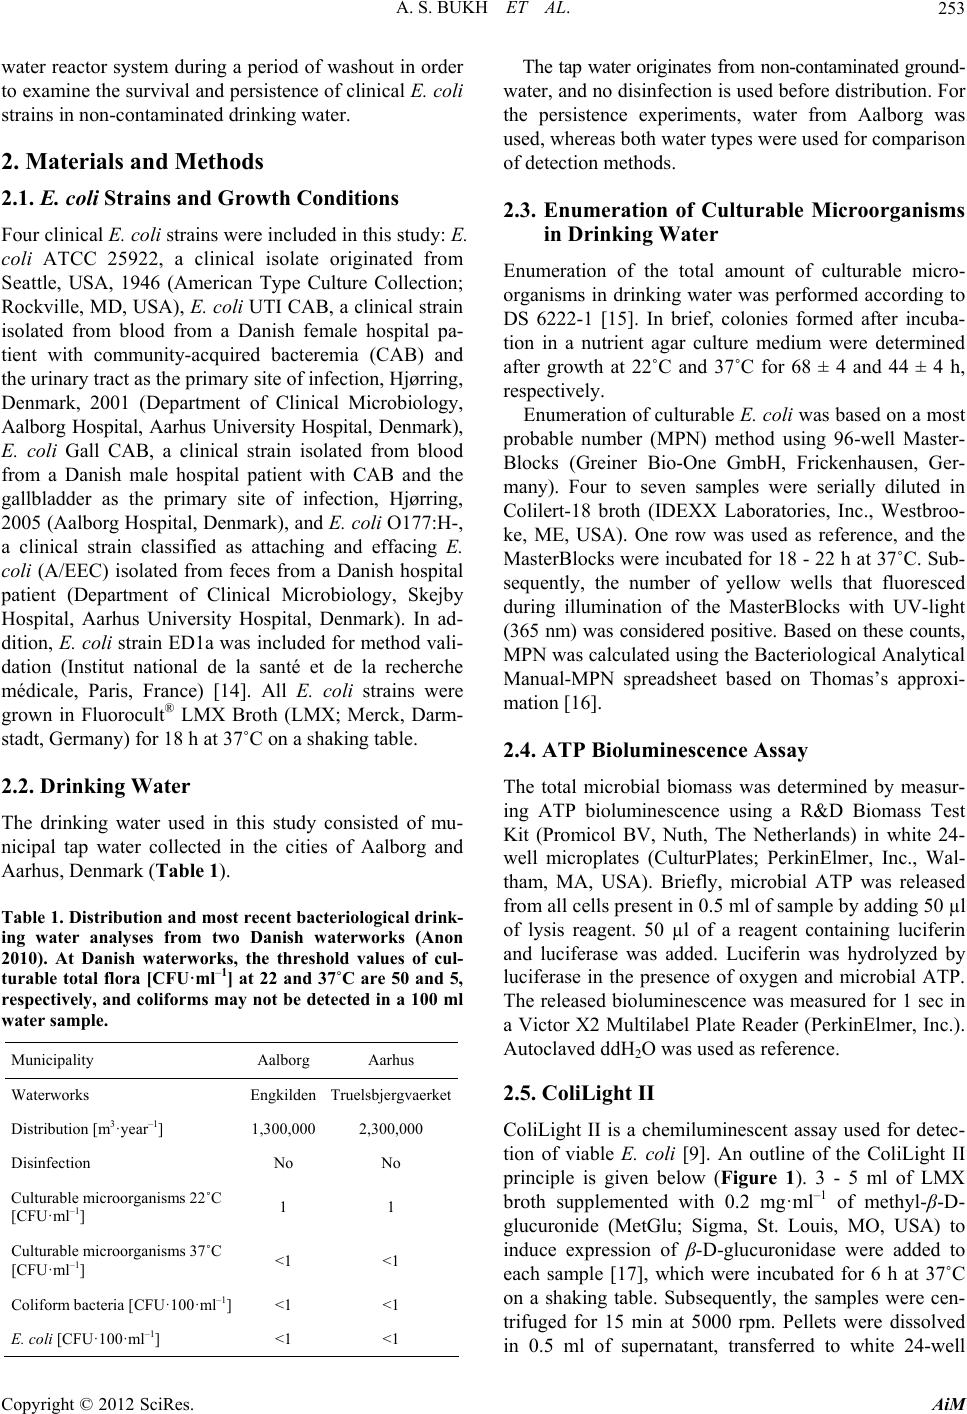 A. S. BUKH ET AL. 253 water reactor system during a period of washout in order to examine the survival and persistence of clinical E. coli strains in non-contaminated drinking water. 2. Materials and Methods 2.1. E. coli Strains and Growth Conditions Four clinical E. coli strains were included in this study: E. coli ATCC 25922, a clinical isolate originated from Seattle, USA, 1946 (American Type Culture Collection; Rockville, MD, USA), E. coli UTI CAB, a clinical strain isolated from blood from a Danish female hospital pa- tient with community-acquired bacteremia (CAB) and the urinary tract as the primary site of infection, Hjørring, Denmark, 2001 (Department of Clinical Microbiology, Aalborg Hospital, Aarhus University Hospital, Denmark), E. coli Gall CAB, a clinical strain isolated from blood from a Danish male hospital patient with CAB and the gallbladder as the primary site of infection, Hjørring, 2005 (Aalborg Hospital, Denmark), and E. coli O177:H-, a clinical strain classified as attaching and effacing E. coli (A/EEC) isolated from feces from a Danish hospital patient (Department of Clinical Microbiology, Skejby Hospital, Aarhus University Hospital, Denmark). In ad- dition, E. coli strain ED1a was included for method vali- dation (Institut national de la santé et de la recherche médicale, Paris, France) [14]. All E. coli strains were grown in Fluorocult® LMX Broth (LMX; Merck, Darm- stadt, Germany) for 18 h at 37˚C on a shaking table. 2.2. Drinking Water The drinking water used in this study consisted of mu- nicipal tap water collected in the cities of Aalborg and Aarhus, Denmark (Table 1). Table 1. Distribution and most recent bacteriological drink- ing water analyses from two Danish waterworks (Anon 2010). At Danish waterworks, the threshold values of cul- turable total flora [CFU·ml–1] at 22 and 37˚C are 50 and 5, respectively, and coliforms may not be detected in a 100 ml water sample. Municipality Aalborg Aarhus Waterworks Engkilden Truelsbjergvaerket Distribution [m3·year–1] 1,300,000 2,300,000 Disinfection No No Culturable microorganisms 22˚C [CFU·ml–1] 1 1 Culturable microorganisms 37˚C [CFU·ml–1] <1 <1 Coliform bacteria [CFU·100·ml–1] <1 <1 E. coli [CFU·100·ml–1] <1 <1 The tap water originates from non-contaminated ground- water, and no disinfection is used before distribution. For the persistence experiments, water from Aalborg was used, whereas both water types were used for comparison of detection methods. 2.3. Enumeration of Culturable Microorganisms in Drinking Water Enumeration of the total amount of culturable micro- organisms in drinking water was performed according to DS 6222-1 [15]. In brief, colonies formed after incuba- tion in a nutrient agar culture medium were determined after growth at 22˚C and 37˚C for 68 ± 4 and 44 ± 4 h, respectively. Enumeration of culturable E. coli was based on a most probable number (MPN) method using 96-well Master- Blocks (Greiner Bio-One GmbH, Frickenhausen, Ger- many). Four to seven samples were serially diluted in Colilert-18 broth (IDEXX Laboratories, Inc., Westbroo- ke, ME, USA). One row was used as reference, and the MasterBlocks were incubated for 18 - 22 h at 37˚C. Sub- sequently, the number of yellow wells that fluoresced during illumination of the MasterBlocks with UV-light (365 nm) was considered positive. Based on these counts, MPN was calculated using the Bacteriological Analytical Manual-MPN spreadsheet based on Thomas’s approxi- mation [16]. 2.4. ATP Bioluminescence Assay The total microbial biomass was determined by measur- ing ATP bioluminescence using a R&D Biomass Test Kit (Promicol BV, Nuth, The Netherlands) in white 24- well microplates (CulturPlates; PerkinElmer, Inc., Wal- tham, MA, USA). Briefly, microbial ATP was released from all cells present in 0.5 ml of sample by adding 50 µl of lysis reagent. 50 µl of a reagent containing luciferin and luciferase was added. Luciferin was hydrolyzed by luciferase in the presence of oxygen and microbial ATP. The released bioluminescence was measured for 1 sec in a Victor X2 Multilabel Plate Reader (PerkinElmer, Inc.). Autoclaved ddH2O was used as reference. 2.5. ColiLight II ColiLight II is a chemiluminescent assay used for detec- tion of viable E. coli [9]. An outline of the ColiLight II principle is given below (Figure 1). 3 - 5 ml of LMX broth supplemented with 0.2 mg·ml–1 of methyl-β-D- glucuronide (MetGlu; Sigma, St. Louis, MO, USA) to induce expression of β-D-glucuronidase were added to each sample [17], which were incubated for 6 h at 37˚C on a shaking table. Subsequently, the samples were cen- trifuged for 15 min at 5000 rpm. Pellets were dissolved in 0.5 ml of supernatant, transferred to white 24-well Copyright © 2012 SciRes. AiM  A. S. BUKH ET AL. 254 Figure 1. Outline of the rapid detection principles, ColiLight II and qPCR, for detection of E. coli in drinking water matrices. CulturPlates, and incubated for 8 - 10 min at room tem- perature in the presence of 0.5 mg·ml–1 of protamine (from salmon; Sigma) to permeabilize cells [18]. Subse- quently, 200 µl of sβ-Glucor 102 (Michigan Diagnostics LLC, Royal Oak, MI, USA) diluted 100-fold in 0.1 mol· l –1 NaPO4 buffer, pH 7.2, containing 10 mmol·l–1 EDTA and 15 mmol·l–1 glycine was added to each sam- ple and incubated for 30 min at 27˚C. 400 µl of Trigger- ing Reagent (Michigan Diagnostics LLC) was added to each sample to reduce quenching of chemiluminescence intensity. The plate was shaken for 10 sec, and the chemiluminescence was measured for 1 sec in a plate reader. Drinking water without coliforms was used as reference. A standard curve was prepared using serial dilutions of β-D-glucuronidase purified from E. coli (Sigma) in 0.1 mol· l –1 NaPO4 buffer, pH 7.2. S/N ratios were calculated [19], and the detection threshold (DT) was determined as 5SD +arithmetic meanarithmetic meanusing seven blanks [20]. 2.6. qPCR An outline of qPCR-based detection of E. coli based on the amplification of a part of dxs is given (Figure 1). 2.6.1. D NA Extracti on Pellet and filter samples were transferred to 2 ml bead tubes containing 0.1 mm glass beads (MOBIO Laborato- ries, Inc., Carlsbad, CA, USA). Drinking water without coliforms was used as extraction controls. 1 ml of DNA extraction buffer (50 mmol·l–1 NaCl, 50 mmol·l–1 Tris- HCl, 50 mmol·l–1 EDTA, 5% SDS, pH 8.0) was added to each sample together with 1 µl of 1 mol·l–1 of DTT. The samples were bead beaten for 5 min on a Vortex Genie 2 with adapter (MOBIO), and centrifuged for 1 min at 10,000 × g. Filters were removed, and DNA was ex- tracted using half a volume of Phenol:Chloroform:Isoa- myl alcohol 25:24:1, saturated with 10 mmol·l–1 Tris- HCl, pH 8.0, 1 mmol·l–1 EDTA (Sigma) followed by one volume of chloroform. DNA was precipitated on ice for at least 1 h at –20˚C using 0.7 volume of isopropanol and a final concentra- tion of 0.3 mol·l–1 sodium acetate in the presence of 1 µg of glycogen. The samples were centrifuged for 30 min, and DNA pellets were washed with 0.5 ml ice-cold 70% ethanol. After ethanol removal, DNA was resuspended in 25 µl of nuclease free water (Sigma). Templates were stored at –80˚C prior to use. 2.6.2. dxs Assay A part of dxs was amplified using previously described primers [13]. The qPCR assay was optimized regarding concentration of Mg2+, primer concentration, and an- nealing temperature. qPCRs were carried out in tripli- cates in an Mx3000PTM Quantitative PCR system (Strata- gene, Agilent Technologies, CA, USA). The 20 µl reaction mixtures contained 10 µl of Bril- liant® II SYBR QPCR Low ROX Master Mix (Strata- gene), 0.2 µmol·l–1 of the forward primer, 0.3 µmol·l–1 of the reverse primer, a final concentration of 3 mmol·l–1 of MgCl2, and 4 µl of template. The PCR conditions were enzyme activation at 95˚C for 10 min followed by 35 cycles of denaturation at 95˚C for 30 sec and amplifica- tion/extension at 62˚C for 1 min (data collection). Sub- sequently, a melt curve analysis was done from 55˚C to 95˚C. A standard curve was prepared using serial dilu- tions of E. coli ED1a gDNA in nuclease free water (Sigma). The DNA stock concentration was based on quantification of cells using McFarland standards, viable microscopy counts using a counting chamber, and plate counts on Tryptone Bile X-glucuronide Agar (Merck), and on DNA concentrations measured on a UV-Vis nanodrop spectrophotometer ND-1000 (NanoDrop Technologies, Inc.; Wilmington, Delaware, USA). LLOQ was determined for the qPCR assay. Intraassay precision (expressed as coefficient of variation, CV) was calculated from standard deviations of genome copy numbers obtained from five replicates of nine dif- ferent template concentrations run simultaneously. CV for interassay precision was calculated from standard deviations of genome copy numbers obtained from Copyright © 2012 SciRes. AiM  A. S. BUKH ET AL. 255 five replicates of one template concentration at three different days. 2.7. Comparison of Detection Methods Correlation analyses were performed in order to compare the outcome of the rapid detection methods ColiLight II and qPCR with more conventional MPN enumeration. The analyses were done using two different types of drinking water collected from Aalborg and Aarhus mu- nicipalities in Jutland, Denmark (Table 1). For each lo- cation, 100 ml of drinking water was transferred to sterile 250-ml BlueCap bottles and spiked with concentrations between ~102 and 107 CFU 100 ml−1 of E. coli ATCC 25922, E. coli UTI CAB, E. coli Gall CAB, and E. coli O177:H-. The samples were incubated for 24 h at 10˚C on a shaking table. Subsequently, 33.3 ml of each sample was filtrated through a 0.45 µm nylon membrane filter and 33.3 ml through a 0.45 µm mixed cellulose ester (MCE) membrane filter (47 mm; Frisenette, Knebel, Denmark). The nylon filter was used for qPCR analysis, and the MCE filter was used for ColiLight II analysis. In addition, 4 × 1 ml of each water sample was used for MPN analysis. 2.8. Persistence of E. coli in a Flow-Through Drinking Water Reactor System Persistence and washout of E. coli ATCC 25922, E. coli UTI CAB, E. coli Gall CAB, and E. coli O177:H- was studied in a lab-scale drinking water reactor system (Figure 2). The system was comprised of a water reser- voir (5 - l BlueCap bottle) connected to a CDC Biofilm reactor (Biosurface Technologies corp., Bozeman, MT, USA) via a peristaltic pump (U4-8R Midi 2.5 - 50 rpm; Alitea AB, Stockholm, Sweden) with PVC tubes (116- 0549-19; MikroLab Aarhus A/S, Aarhus, Denmark). A PVC pump tube (Yellow-Blue, 1.52 mm; SEAL Ana- lytical Ltd., Hampshire, UK) was used to ensure a uni- form water flow of 0.4 ml·min–1. The water was pumped from the reservoir to the reactor with a total water vol- ume of 350 ml resulting in a dilution rate, D, of 1.646 d–1. The rector was fitted with PE and SS coupons to allow studies of cell adherence to different surface materials. The bioreactor was comprised of glass, and the PE and SS coupons were inserted into coupon holders made of polypropylene (PP). The total surface area of the inner surfaces below the water surface during each experiment was 388.6 cm2 of which 196 cm2 was constituted by glass, 142 cm2 by PP, 25.3 cm2 by PE, and 25.3 cm2 by SS. From the reactor, the water flowed through to a waste bottle. Seven removable PP coupon holders each containing three removable coupons were inserted in the reactor. Three holders contained three PE coupons, three Figure 2. Experimental set-up of a flow-through drinking water reactor system used in the persistence experiments. holders contained three SS coupons, and one holder con- tained one PE and one SS coupon. The coupons were below the water surface throughout the experiment. The reservoir and the reactor were placed on magnetic stirrers. Four experiments were performed, one for each E. coli strain. Prior to each experiment, clean drinking water was run through the system for 72 h. Subsequently, the reservoir and the reactor were inoculated with ~104 ml–1 E. coli cells. The reactor system was exposed to the E. coli cells for 24 h, followed by nine days of washout where clean drinking water without E. coli was run through the system. All experiments were conducted in a darkroom at 10˚C. All reactor parts and tubes were dis- infected with 70% of ethanol between experiments. Sampling of water and coupons were performed prior to E. coli inoculation, 24 h after E. coli inoculation at the time where washout was initiated (day 0), and after 3 and 9 days of washout (day 3 and day 9, respectively). Addi- tional sampling of the water phase was also carried out after 6 days of washout (day 6). A total volume of 10 ml of water was collected at each sampling. Using a glass pipe, increments of 2 ml of water representing the verti- cal dimension of the water column were drawn from the reactor and pooled. One holder with three PE coupons and one holder with three SS coupons were also drawn from the reactor. Each of the three coupons from one holder were each aseptically placed in 3.33 ml of buff- ered peptone water in sterile 50 ml Greiner tubes, and to release attached cells from the coupons, the samples were vortexed for 10 sec followed by sonication for 10 sec (×3). The coupons were removed, and the eluates from the same coupon material were pooled. 7 × 0.2 ml of wa- ter and coupon eluates were used for MPN determina- tions, 3 × 0.5 ml were used for both ATP biolumines- cence, 3 × 0.5 ml were used for ColiLight II analyses, Copyright © 2012 SciRes. AiM 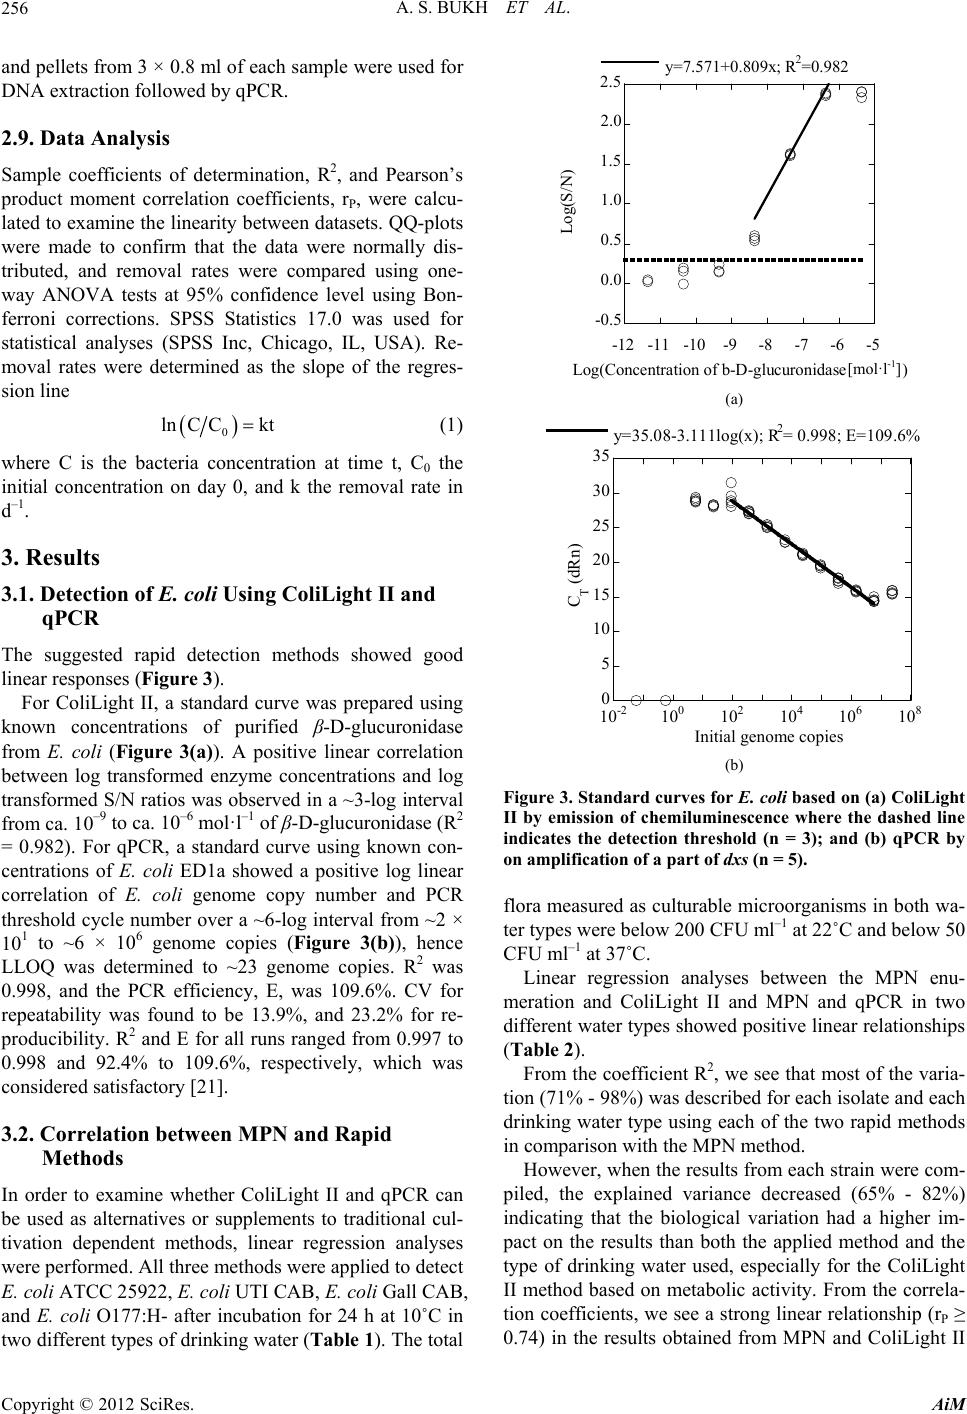 A. S. BUKH ET AL. 256 and pellets from 3 × 0.8 ml of each sample were used for DNA extraction followed by qPCR. -0.5 0.0 0.5 1.0 1.5 2.0 2.5 -12 -11 -10-9-8-7-6-5 y=7.571+0.809x; R2=0.982 Log(S /N) Log(Concentration of b-D-glucuronidase [mol l -1]) 2.9. Data Analysis Sample coefficients of determination, R2, and Pearson’s product moment correlation coefficients, rP, were calcu- lated to examine the linearity between datasets. QQ-plots were made to confirm that the data were normally dis- tributed, and removal rates were compared using one- way ANOVA tests at 95% confidence level using Bon- ferroni corrections. SPSS Statistics 17.0 was used for statistical analyses (SPSS Inc, Chicago, IL, USA). Re- moval rates were determined as the slope of the regres- sion line [mol·l -1 ] 0 C Cktln (1) where C is the bacteria concentration at time t, C0 the initial concentration on day 0, and k the removal rate in d–1. 3. Results 3.1. Detection of E. coli Using ColiLight II and qPCR The suggested rapid detection methods showed good linear responses (Fi gure 3). For ColiLight II, a standard curve was prepared using known concentrations of purified β-D-glucuronidase from E. coli (Figure 3(a)). A positive linear correlation between log transformed enzyme concentrations and log transformed S/N ratios was observed in a ~3-log interval from ca. 10–9 to ca. 10–6 mol·l–1 of β-D-glucuronidase (R2 = 0.982). For qPCR, a standard curve using known con- centrations of E. coli ED1a showed a positive log linear correlation of E. coli genome copy number and PCR threshold cycle number over a ~6-log interval from ~2 × 101 to ~6 × 10 6 genome copies (Figure 3(b)), hence LLOQ was determined to ~23 genome copies. R2 was 0.998, and the PCR efficiency, E, was 109.6%. CV for repeatability was found to be 13.9%, and 23.2% for re- producibility. R2 and E for all runs ranged from 0.997 to 0.998 and 92.4% to 109.6%, respectively, which was considered satisfactory [21]. 3.2. Correlation between MPN and Rapid Methods In order to examine whether ColiLight II and qPCR can be used as alternatives or supplements to traditional cul- tivation dependent methods, linear regression analyses were performed. All three methods were applied to detect E. coli ATCC 25922, E. coli UTI CAB, E. coli Gall CAB, and E. coli O177:H- after incubation for 24 h at 10˚C in two different types of drinking water (Table 1). The total (a) 0 5 10 15 20 25 30 35 10-2 100102104106108 y=35.08-3.111log(x); R 2= 0.998; E=109.6% CT (dRn) Initial genome copies (b) Figure 3. Standard curves for E. coli based on (a) ColiLight II by emission of chemiluminescence where the dashed line indicates the detection threshold (n = 3); and (b) qPCR by on amplification of a part of dxs (n = 5). flora measured as culturable microorganisms in both wa- ter types were below 200 CFU ml–1 at 22˚C and below 50 CFU ml–1 at 37˚C. Linear regression analyses between the MPN enu- meration and ColiLight II and MPN and qPCR in two different water types showed positive linear relationships (Table 2). From the coefficient R2, we see that most of the varia- tion (71% - 98%) was described for each isolate and each drinking water type using each of the two rapid methods in comparison with the MPN method. However, when the results from each strain were com- piled, the explained variance decreased (65% - 82%) indicating that the biological variation had a higher im- pact on the results than both the applied method and the type of drinking water used, especially for the ColiLight II method based on metabolic activity. From the correla- tion coefficients, we see a strong linear relationship (rP ≥ 0.74) in the results obtained from MPN and ColiLight II Copyright © 2012 SciRes. AiM 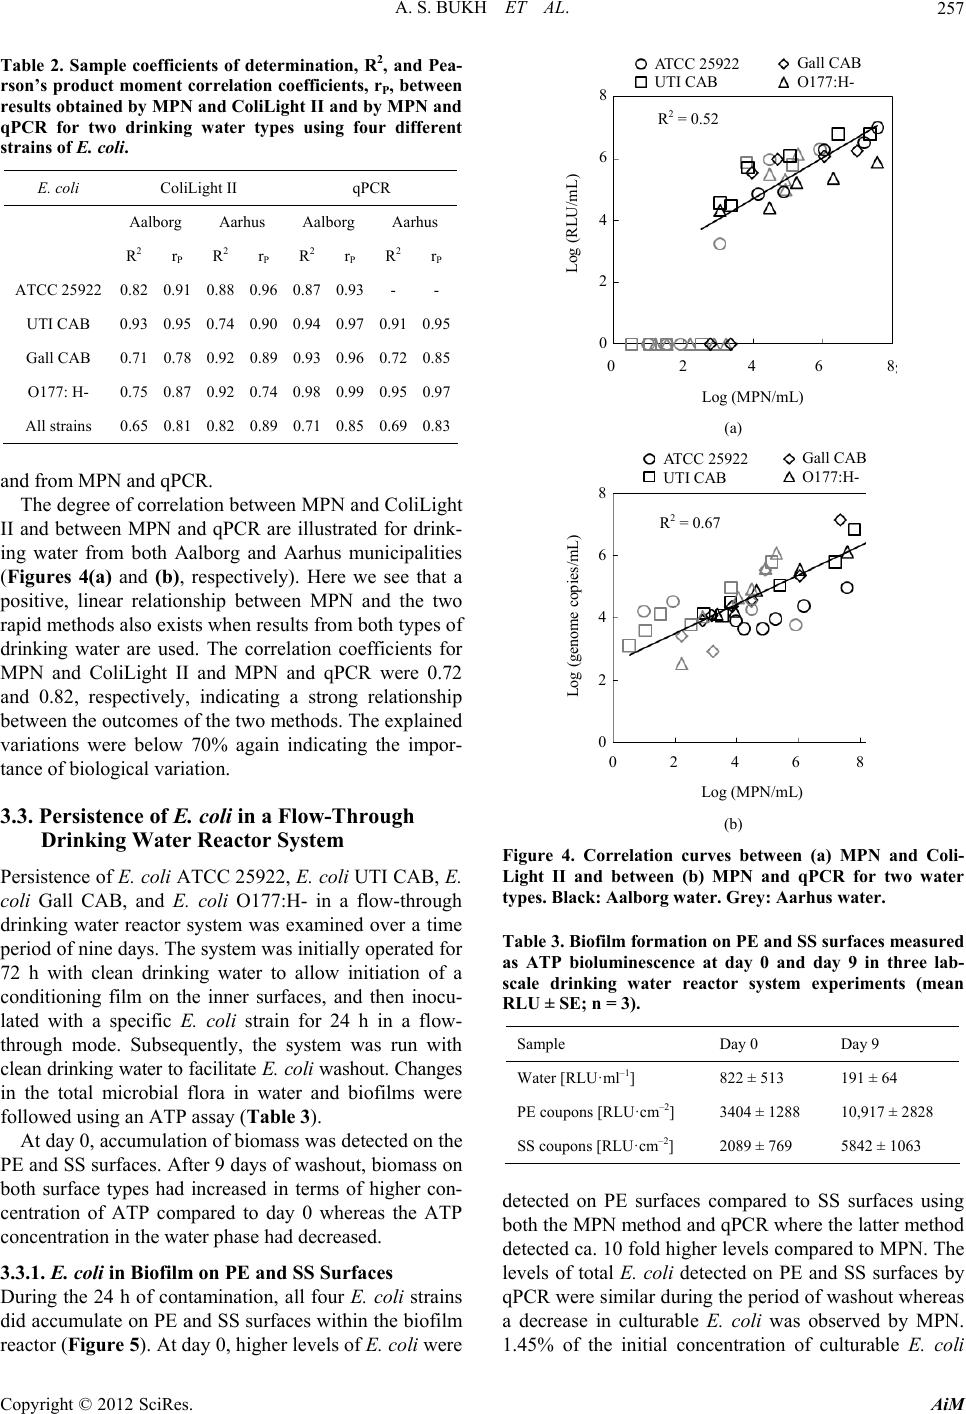 A. S. BUKH ET AL. 257 Table 2. Sample coefficients of determination, R2, and Pea- rson’s product moment correlation coefficients, rP, between results obtained by MPN and ColiLight II and by MPN and qPCR for two drinking water types using four different strains of E. coli. E. coli ColiLight II qPCR Aalborg Aarhus Aalborg Aarhus R 2 r P R 2 r P R 2 r P R 2rP ATCC 25922 0.82 0.91 0.88 0.96 0.87 0.93 - - UTI CAB 0.93 0.95 0.74 0.90 0.94 0.97 0.91 0.95 Gall CAB 0.71 0.78 0.92 0.89 0.93 0.96 0.72 0.85 O177: H- 0.75 0.87 0.92 0.74 0.98 0.99 0.95 0.97 All strains 0.65 0.81 0.82 0.89 0.71 0.85 0.69 0.83 and from MPN and qPCR. The degree of correlation between MPN and ColiLight II and between MPN and qPCR are illustrated for drink- ing water from both Aalborg and Aarhus municipalities (Figures 4(a) and (b), respectively). Here we see that a positive, linear relationship between MPN and the two rapid methods also exists when results from both types of drinking water are used. The correlation coefficients for MPN and ColiLight II and MPN and qPCR were 0.72 and 0.82, respectively, indicating a strong relationship between the outcomes of the two methods. The explained variations were below 70% again indicating the impor- tance of biological variation. 3.3. Persistence of E. coli in a Flow-Through Drinking Water Reactor System Persistence of E. coli ATCC 25922, E. coli UTI CAB, E. coli Gall CAB, and E. coli O177:H- in a flow-through drinking water reactor system was examined over a time period of nine days. The system was initially operated for 72 h with clean drinking water to allow initiation of a conditioning film on the inner surfaces, and then inocu- lated with a specific E. coli strain for 24 h in a flow- through mode. Subsequently, the system was run with clean drinking water to facilitate E. coli washout. Changes in the total microbial flora in water and biofilms were followed using an ATP assay (Table 3). At day 0, accumulation of biomass was detected on the PE and SS surfaces. After 9 days of washout, biomass on both surface types had increased in terms of higher con- centration of ATP compared to day 0 whereas the ATP concentration in the water phase had decreased. 3.3.1. E. coli in Biofilm on PE and SS Surfaces During the 24 h of contamination, all four E. coli strains did accumulate on PE and SS surfaces within the biofilm reactor (Figure 5). At day 0, higher levels of E. coli were ATCC 25922 UTI CAB Gall CAB O177:H- 8 6 4 2 0 R 2 = 0.52 Log (RLU/mL) 0 2 4 6 8 Log (MPN/mL) (a) ATCC 25922 UTI CAB Gall CAB O177:H- R 2 = 0.67 Log (MPN/mL) 8 6 4 2 0 Log (genome copies/mL) 0 2 4 6 8 (b) Figure 4. Correlation curves between (a) MPN and Coli- Light II and between (b) MPN and qPCR for two water types. Black: Aalborg water. Grey: Aarhus water. Table 3. Biofilm formation on PE and SS surfaces measured as ATP bioluminescence at day 0 and day 9 in three lab- scale drinking water reactor system experiments (mean RLU ± SE; n = 3). Sample Day 0 Day 9 Water [RLU·ml–1] 822 ± 513 191 ± 64 PE coupons [RLU·cm–2] 3404 ± 1288 10,917 ± 2828 SS coupons [RLU·cm–2] 2089 ± 769 5842 ± 1063 detected on PE surfaces compared to SS surfaces using both the MPN method and qPCR where the latter method detected ca. 10 fold higher levels compared to MPN. The levels of total E. coli detected on PE and SS surfaces by qPCR were similar during the period of washout whereas a decrease in culturable E. coli was observed by MPN. 1.45% of the initial concentration of culturable E. coli Copyright © 2012 SciRes. AiM 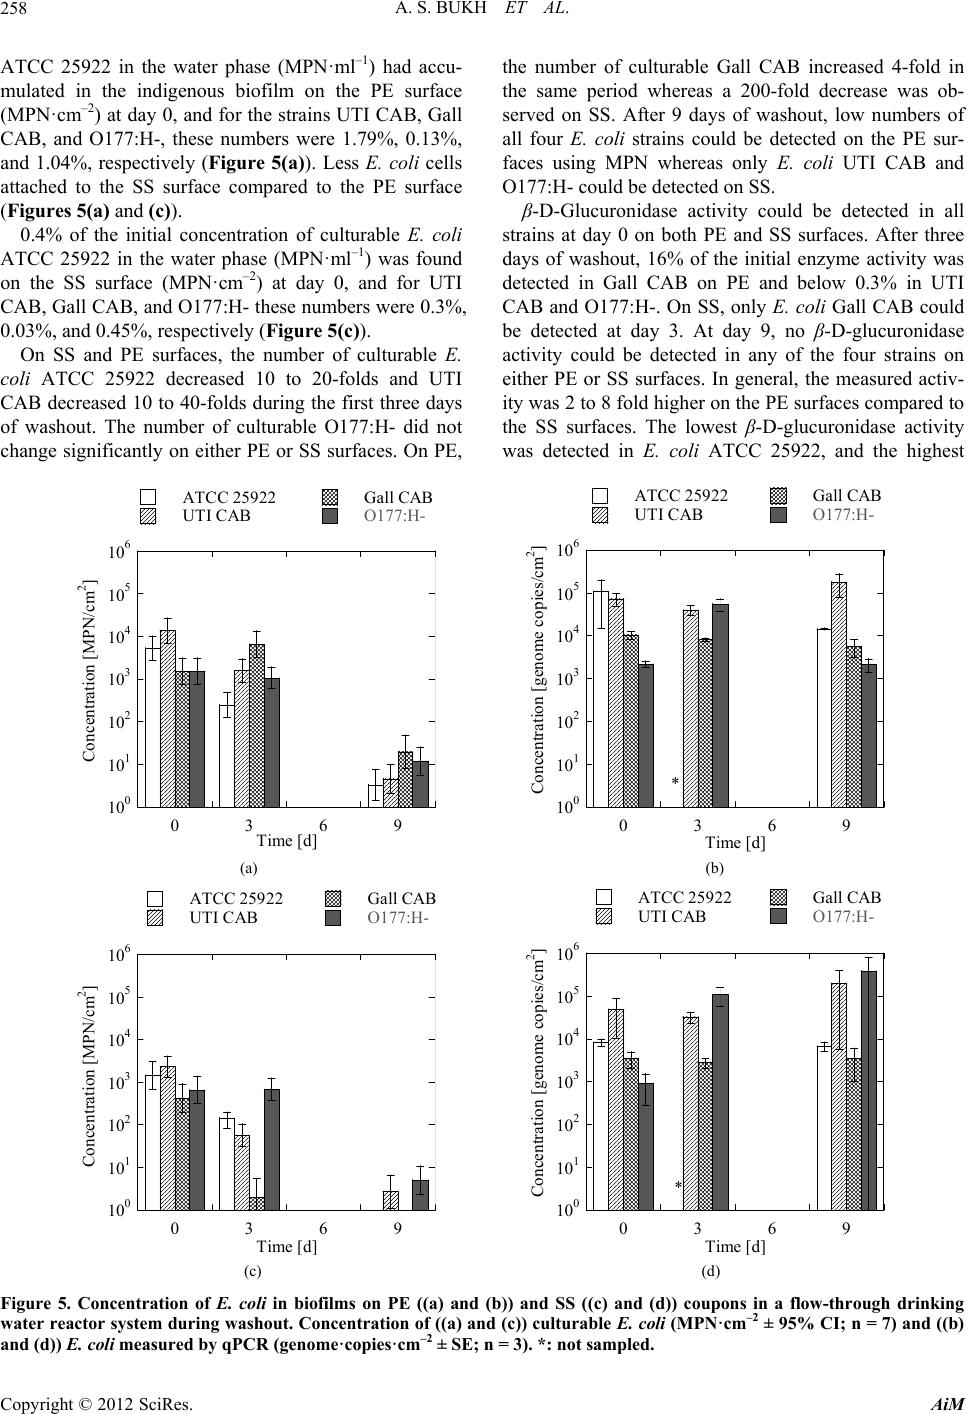 A. S. BUKH ET AL. AiM 258 ATCC 25922 in the water phase (MPN·ml–1) had accu- mulated in the indigenous biofilm on the PE surface (MPN·cm–2) at day 0, and for the strains UTI CAB, Gall CAB, and O177:H-, these numbers were 1.79%, 0.13%, and 1.04%, respectively (Figure 5(a)). Less E. coli cells attached to the SS surface compared to the PE surface (Figures 5 (a) and (c)). Copyright © 2012 SciRes. 0.4% of the initial concentration of culturable E. coli ATCC 25922 in the water phase (MPN·ml–1) was found on the SS surface (MPN·cm–2) at day 0, and for UTI CAB, Gall CAB, and O177:H- these numbers were 0.3%, 0.03%, and 0.45%, respectively (Figure 5(c)). On SS and PE surfaces, the number of culturable E. coli ATCC 25922 decreased 10 to 20-folds and UTI CAB decreased 10 to 40-folds during the first three days of washout. The number of culturable O177:H- did not change significantly on either PE or SS surfaces. On PE, the number of culturable Gall CAB increased 4-fold in the same period whereas a 200-fold decrease was ob- served on SS. After 9 days of washout, low numbers of all four E. coli strains could be detected on the PE sur- faces using MPN whereas only E. coli UTI CAB and O177:H- could be detected on SS. β-D-Glucuronidase activity could be detected in all strains at day 0 on both PE and SS surfaces. After three days of washout, 16% of the initial enzyme activity was detected in Gall CAB on PE and below 0.3% in UTI CAB and O177:H-. On SS, only E. coli Gall CAB could be detected at day 3. At day 9, no β-D-glucuronidase activity could be detected in any of the four strains on either PE or SS surfaces. In general, the measured activ- ity was 2 to 8 fold higher on the PE surfaces compared to the SS surfaces. The lowest β-D-glucuronidase activity was detected in E. coli ATCC 25922, and the highest ATCC 25922Gall CAB ATCC 25922Gall CABUTI CAB 100 101 102 103 104 105 106 0369 UTI CABO177:H- Concentration [MPN/cm2] Time [d] 100 101 102 103 104 105 106 0369 O177:H- Concentration [genome copies/cm2] Time [d] * (a) (b) 100 101 102 103 104 105 106 0369 ATCC 25922 UTI CAB Gall CABATCC 25922Gall CAB UTI CAB O17 Concentration [MPN/cm2] Time 7:H- 100 101 102 103 104 105 106 0369 d O177:H- Concentration [genome copies/cm2] Time * d (c) (d) Figure 5. Concentration of E. coli in biofilms on PE ((a) and (b)) and SS ((c) and (d)) coupons in a flow-through drinking water reactor system during washout. Concentration of ((a) and (c)) culturable E. coli (MPN·cm–2 ± 95% CI; n = 7) and ((b) nd (d)) E. coli measured by qPCR (genome·copies·cm–2 ± SE; n = 3). *: not sampled. a 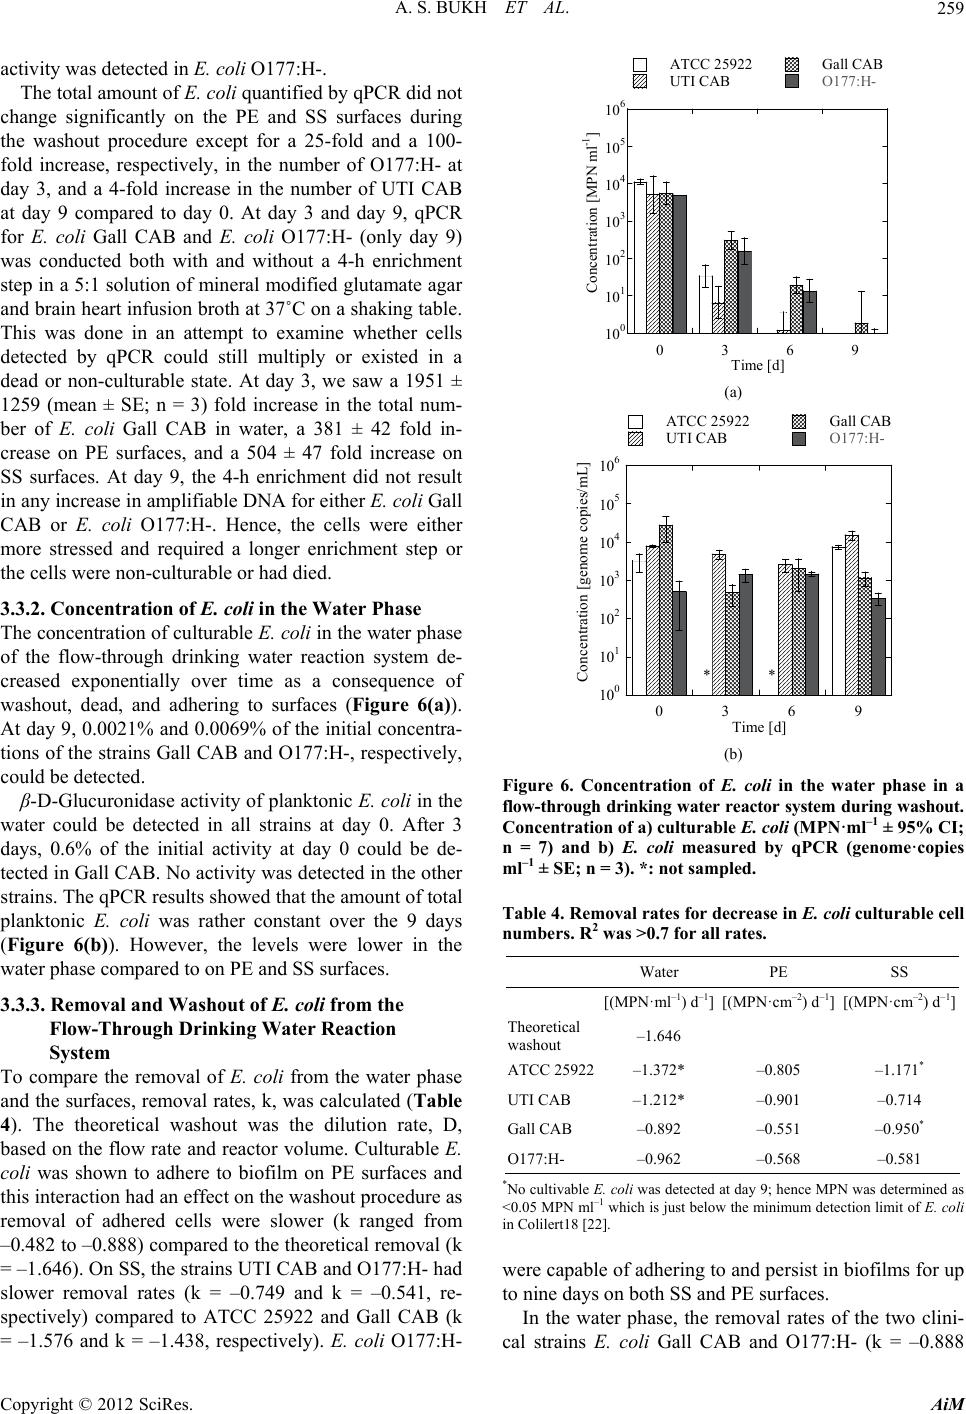 A. S. BUKH ET AL. 259 activity was detected in E. coli O177:H-. The total amount of E. coli quantified by qPCR did not change significantly on the PE and SS surfaces during the washout procedure except for a 25-fold and a 100- fold increase, respectively, in the number of O177:H- at day 3, and a 4-fold increase in the number of UTI CAB at day 9 compared to day 0. At day 3 and day 9, qPCR for E. coli Gall CAB and E. coli O177:H- (only day 9) was conducted both with and without a 4-h enrichment step in a 5:1 solution of mineral modified glutamate agar and brain heart infusion broth at 37˚C on a shaking table. This was done in an attempt to examine whether cells detected by qPCR could still multiply or existed in a dead or non-culturable state. At day 3, we saw a 1951 ± 1259 (mean ± SE; n = 3) fold increase in the total num- ber of E. coli Gall CAB in water, a 381 ± 42 fold in- crease on PE surfaces, and a 504 ± 47 fold increase on SS surfaces. At day 9, the 4-h enrichment did not result in any increase in amplifiable DNA for either E. coli Gall CAB or E. coli O177:H-. Hence, the cells were either more stressed and required a longer enrichment step or the cells were non-culturable or had died. 3.3.2. C on ce ntrati on of E. coli in the Water Phase The concentration of culturable E. coli in the water phase of the flow-through drinking water reaction system de- creased exponentially over time as a consequence of washout, dead, and adhering to surfaces (Figure 6(a)). At day 9, 0.0021% and 0.0069% of the initial concentra- tions of the strains Gall CAB and O177:H-, respectively, could be detected. β-D-Glucuronidase activity of planktonic E. coli in the water could be detected in all strains at day 0. After 3 days, 0.6% of the initial activity at day 0 could be de- tected in Gall CAB. No activity was detected in the other strains. The qPCR results showed that the amount of total planktonic E. coli was rather constant over the 9 days (Figure 6(b)). However, the levels were lower in the water phase compared to on PE and SS surfaces. 3.3.3. Removal and Washout of E. coli from the Flow-Through Drinking Water Reaction System To compare the removal of E. coli from the water phase and the surfaces, removal rates, k, was calculated (Table 4). The theoretical washout was the dilution rate, D, based on the flow rate and reactor volume. Culturable E. coli was shown to adhere to biofilm on PE surfaces and this interaction had an effect on the washout procedure as removal of adhered cells were slower (k ranged from –0.482 to –0.888) compared to the theoretical removal (k = –1.646). On SS, the strains UTI CAB and O177:H- had slower removal rates (k = –0.749 and k = –0.541, re- spectively) compared to ATCC 25922 and Gall CAB (k = –1.576 and k = –1.438, respectively). E. coli O177:H- 100 101 102 103 104 105 106 0369 ATCC 25922Gall CAB UTI CABO177:H- Concentration [MPN ml-1] Time [d] (a) 100 101 102 103 104 105 106 0369 ATCC 25922Gall CAB UTI CABO177:H- Concentration [genome copies/mL] Time [d] ** (b) Figure 6. Concentration of E. coli in the water phase in a flow-through drinking water reactor system during washout. Concentration of a) culturable E. coli (MPN·ml–1 ± 95% CI; n = 7) and b) E. coli measured by qPCR (genome·copies ml–1 ± SE; n = 3). *: not sampled. Table 4. Removal rates for decrease in E. coli culturable cell numbers. R2 was >0.7 for all r a tes. Water PE SS [(MPN·ml–1) d–1] [(MPN·cm–2) d–1] [(MPN·cm–2) d–1] Theoretical washout –1.646 ATCC 25922–1.372* –0.805 –1.171* UTI CAB –1.212* –0.901 –0.714 Gall CAB –0.892 –0.551 –0.950* O177:H- –0.962 –0.568 –0.581 *No cultivable E. coli was detected at day 9; hence MPN was determined as <0.05 MPN ml–1 which is just below the minimum detection limit of E. coli in Colilert18 [22]. were capable of adhering to and persist in biofilms for up to nine days on both SS and PE surfaces. In the water phase, the removal rates of the two clini- cal strains E. coli Gall CAB and O177:H- (k = –0.888 Copyright © 2012 SciRes. AiM  A. S. BUKH ET AL. 260 and k = –0.979, respectively) were slower than the re- moval rates of E. coli UTI CAB and ATCC 25922 (k = –1.393 and k = –1.662, respectively) which were similar to the theoretical washout rate. In both water and biofilm, the clinical E. coli strain O177:H- persisted three times longer than the culture collection strain E. coli ATCC 25922. 4. Discussion The results from this study showed that the two rapid methods ColiLight II and qPCR could be applied to de- tect E. coli in drinking water and to evaluate the survival and persistence of E. coli in drinking water systems. We found that clinical E. coli strains were able to persist in a flow-through lab-scale drinking water reactor system for at least nine days. In the lab-scale reactor system, the relative amount of accumulated biofilm on the PE and SS surfaces deter- mined by measuring the ATP content was not signifi- cantly different from each other during the time period. This corresponds to the findings of Yu et al. who studied biofilm formation on different water distribution pipe materials in disinfected tap water [23]. Yu et al. found similar biomass levels on PE and SS surfaces after 90 days of incubation in drinking water. A relatively low metabolic activity by means of β-D- glucuronidase activity was found on both PE and SS sur- faces and in the water phase after 3 days. This can be explained by the fact that the concentration of culturable and active E. coli cells present on the surfaces and in the water phase at day 3 were ca. or below that of the ana- lytical limit of detection (102 - 103 cells) of the ColiLight II method [9]. From the qPCR results we see, that the concentration of nucleic acids was rather stabile over time both in the water phase and on surfaces. This indicates that E. coli was released from surfaces, mainly glass and PP surfaces since the levels on PE and SS were rather constant, over time to the water phase, and that the released cells were dead, had entered a VBNC state, or a combination of both. Furthermore, E. coli was not released from SS and PE surfaces to an extensive degree, but had entered a VBNC state or had died. These persistent levels of E. coli DNA have also been found in other studies. Cell integrity and respiratory activity together with loss of culturability over time was found in a study by Cook and Bolster, who tested the survival of Camp. jejuni and E. coli in groundwater microcosms during starvation at 4˚C [10]. Lothigius et al., who examined the survival and gene expression of enterotoxigenic E. coli in sea water and freshwater, also found high degree of cell integrity for up to 12 weeks in both water types together with ex- pression of genes involved in metabolic pathways and genes encoding enterotoxins [12]. In our study, however, the cellular integrity did not correlate with the metabolic activity by means of β-D-glucuronidase activity as no activity could be detected at day 9 where the DNA levels were high. However, this may be explained by a very low activity in the cells in combination with the sensitiv- ity of the ColiLight II method. Our results indicated the existence of strain-differen- tiated removal of E. coli from both water and surfaces in a lab-scale drinking water reactor system due to incorpo- ration into biofilms. The initial concentrations of E. coli did not vary significantly between experiments and can- not explain the differences in the measured concentra- tions over time. These differences indicated a differenti- ated washout where the strains Gall CAB and O177:H- could persist longer in the system compared to ATCC 25922 and UTI CAB. Especially the strain O177:H- showed high persistence in the system. It is known that curli production by non-pathogenic and pathogenic E. coli enhances the attachment of cells to SS surfaces [24] and glass surfaces [25,26]. As an A/EEC strain, E. coli O177:H- used in this study are likely to be able to pro- duce curli which increases the ability of the strain to form biofilm [26]. Our findings point towards differentiated strain-spe- cific survival of E. coli in drinking water matrices. The survival of different E. coli strains has been examined in other types of freshwaters such as river water [27] and well water [28], and both studies suggest strain differen- tial survival of E. coli. The ColiLight II method measures β-D-glucuronidase activity in viable cells with a greater sensitivity than methods based on fluorescent and chromogenic sub- strates [9]. This method can be applied to detect meta- bolic active E. coli in drinking water when present in adequate concentrations. Using qPCR, the total amount of extracted nucleic acids in a sample is measured with a high specificity and sensitivity. Overall, the two rapid detection methods, qPCR and ColiLight II, are suitable for detection of E. coli in drinking water and biofilms. Both methods can comple- ment standard cultivation-based methods for detection of E. coli in drinking water and can provide results within one work day. Clinical E. coli strains persisted longer in drinking water than a culture collection strain, and strain specific attributes can significantly affect detection and persis- tence of E. coli in drinking water matrices. 5. Acknowledgements We thank MD DMSc Professor Henrik C. Schønheyder, Aalborg Hospital, MD PhD Brian Kristensen, Skejby Hospital, and Professor MD PhD Erick Denamur, Institut Copyright © 2012 SciRes. AiM  A. S. BUKH ET AL. 261 national de la santé et de la recherche médicale, Paris, France for providing E. coli strains used in this study. We also thank Margit Paulsen for providing technical assistance. This work was supported by the Obel Family Foundation and the Danish Council for Strategic Re- search, the project SENSOWAQ—Sensors for Monitor- ing and Control of Water Quality. REFERENCES [1] A. Rompré, P. Servais, J. Baudart, M. de-Roubin and P. Laurent, “Detection and Enumeration of Coliforms in Drinking Water: Current Methods and Emerging Ap- proaches,” Journal of Microbiological Methods, Vol. 49, No. 1, 2002, pp. 31-54. doi:10.1016/S0167-7012(01)00351-7 [2] L. Fiksdal and I. Tryland, “Application of Rapid Enzyme Assay Techniques for Monitoring of Microbial Water Quality,” Current Opinion in Biotechnology, Vol. 19, No. 3, 2008, pp. 289-294. doi:10.1016/j.copbio.2008.03.004 [3] J. D. Berg and L. Fiksdal, “Rapid Detection of Total and Fecal Coliforms in Water by Enzymatic Hydrolysis of 4-Methylumbelliferone-beta-D-galactoside,” Applied and Environmental Microbiology, Vol. 54, 1988, pp. 2118- 2122. [4] L. Fiksdal, M. Pommepuy, M. P. Caprais and I. Midttun, “Monitoring of Fecal Pollution in Coastal Waters by Use of Rapid Enzymatic Techniques,” Applied and Environ- mental Microbiology, Vol. 60, 1994, pp. 1581-1584. [5] I. George, M. Petit and P. Servais, “Use of Enzymatic Methods for Rapid Enumeration of Coliforms in Fresh- waters,” Journal of Applied Microbiology, Vol. 88, No. 3, 2000, pp. 404-413. doi:10.1046/j.1365-2672.2000.00977.x [6] T. Garcia-Armisen, P. Lebaron and P. Servais, “β-D- Glucuronidase Activity Assay to Assess Viable Es- cherichia coli Abundance in Freshwaters,” Letters in Ap- plied Microbiology, Vol. 40, No. 4, 2005, pp. 278-282. doi:10.1111/j.1472-765X.2005.01670.x [7] P. Lebaron, A. Henry, A. Lepeuple, G. Pena and P. Ser- vais, “An Operational Method for the Real-Time Moni- toring of E. coli Numbers in Bathing Waters,” Marine Pollution Bulletin, Vol. 50, No. 6, 2005, pp. 652-659. doi:10.1016/j.marpolbul.2005.01.016 [8] S. O. Van Poucke and H. J. Nelis, “Rapid Detection of Fluorescent and Chemiluminescent Total Coliforms and Escherichia coli on Membrane Filters,” Journal of Micro- biological Methods, Vol. 42, No. 3, 2000, pp. 233-244. doi:10.1016/S0167-7012(00)00193-7 [9] A. S. Bukh and P. Roslev, “Characterization and Valida- tion of a Chemiluminescent Assay Based on 1,2-Diox- etanes for Rapid Detection of Viable Escherichia coli,” Applied Microbiology and Biotechnology, Vol. 86, No. 6, 2010, pp. 1947-1957. doi:10.1007/s00253-010-2514-6 [10] K. L. Cook and C. H. Bolster, “Survival of Campylobac- ter jejuni and Escherichia coli in Groundwater during Prolonged Starvation at Low Temperatures,” Journal of Applied Microbiology, Vol. 103, No. 3, 2007, pp. 573- 583. doi:10.1111/j.1365-2672.2006.03285.x [11] W. Ahmed, F. Huygens, A. Goonetilleke and T. Gardner, “Real-Time PCR Detection of Pathogenic Microorgan- isms in Roof-Harvested Rainwater in Southeast Queen- sland, Australia,” Applied and Environmental Microbiol- ogy, Vol. 74, No. 17, 2008, pp. 5490-5496. doi:10.1128/AEM.00331-08 [12] Å. Lothigius, Å. Sjöling, A. Svennerholm and I. Bölin, “Survival and Gene Expression of Enterotoxigenic Es- cherichia coli during Long-Term Incubation in Sea Water and Freshwater,” Journal of Applied Microbiology, Vol. 108, No. 4, 2010, pp. 1441-1449. doi:10.1111/j.1365-2672.2009.04548.x [13] C. Lee, J. Kim, S. G. Shin and S. Hwang, “Absolute and Relative QPCR Quantification of Plasmid Copy Number in Escherichia coli,” Journal of Biotechnology, Vol. 123, No. 3, 2006, pp. 273-280. doi:10.1016/j.jbiotec.2005.11.014 [14] O. Clermont, M. Lescat, C. L. O’Brien, D. M. Gordon, O. Tenaillon and E. Denamur, “Evidence for a Human-Spe- cific Escherichia coli Clone,” Environmental Microbiol- ogy, Vol. 10, No. 4, 2008, pp. 1000-1006. doi:10.1111/j.1462-2920.2007.01520.x [15] DS 6222-1, “Water Quality—Enumeration of Culturable Micro-Organisms—Colony Count by Inoculation in a Nutrient Agar Culture Medium,” Danish Standards Asso- ciation, Copenhagen, 2002. [16] W. E. Garthright and R. J. Blodgett, “FDA’s Preferred MPN Methods for Standard, Large or Unusual Tests, with a Spreadsheet,” Food Microbiology, Vol. 20, No. 4, 2003, pp. 439-445. doi:10.1016/S0740-0020(02)00144-2 [17] I. Tryland and L. Fiksdal, “Enzyme Characteristics of β- D-Galactosidase- and β-D-Glucuronidase-Positive Bacte- ria and Their Interference in Rapid Methods for Detection of Waterborne Coliforms and Escherichia coli,” Applied and Environmental Microbiology, Vol. 64, 1998, pp. 1018- 1023. [18] C. Johansen, A. Verheul, L. Gram, T. Gill and T. Abee, “Protamine-Induced Permeabilization of Cell Envelopes of Gram-Positive and Gram-Negative Bacteria,” Applied and Environmental Microbiology, Vol. 63, 1997, pp. 1155- 1159. [19] I. Bronstein, B. Edwards and J. C. Voyta, “1,2-Dioxe- tanes: Novel Chemiluminescent Enzyme Substrates. Ap- plications to Immunoassays,” Journal of Bioluminescence and Chemiluminescence, Vol. 4, No. 1, 1989, pp. 99-111. doi:10.1002/bio.1170040116 [20] S. O. Van Poucke and H. J. Nelis, “Development of a Sensitive Chemiluminometric Assay for the Detection of β-Galactosidase in Permeabilized Coliform Bacteria and Comparison with Fluorometry and Colorimetry,” Applied and Environmental Microbiology, Vol. 61, 1995, pp. 4505- 4509. [21] M. Raymaekers, R. Smets, B. Maes and R. Cartuyvels, “Checklist for Optimization and Validation of Real-Time PCR Assays,” Journal of Clinical Laboratory Analysis, Vol. 23, No. 3, 2009, pp. 145-151. doi:10.1002/jcla.20307 [22] A. Al-Turki and M. G. El-Ziney, “Evaluation of Com- Copyright © 2012 SciRes. AiM  A. S. BUKH ET AL. Copyright © 2012 SciRes. AiM 262 mercial Colilert18-Quantitray® Method by ISO Tech- niques for Enumeration and Quantification of Total Coli- forms and Escherichia coli in Drinking-Water of Burai- dah, Saudi Arabia,” Journal of Applied Sciences, Vol. 9, No. 18, 2009, pp. 3357-3363. doi:10.3923/jas.2009.3357.3363 [23] J. Yu, D. Kim and T. Lee, “Microbial Diversity in Biofilms on Water Distribution Pipes of Different Mate- rials,” Water Science and Technology, Vol. 61, No. 1, 2010, pp. 163-171. doi:10.2166/wst.2010.813 [24] J. Ryu and L. R. Beuchat, “Biofilm Formation by Es- cherichia coli O157:H7 on Stainless Steel: Effect of Exopolysaccharide and Curli Production on Its Resistance to Chlorine,” Applied and Environmental Microbiology, Vol. 71, No. 1, 2005, 247-254. doi:10.1128/AEM.71.1.247-254.2005 [25] O. Vidal, R. Longin, C. Prigent-Combaret, C. Dorel, M. Hooreman and P. Lejeune, “Isolation of an Escherichia coli K-12 Mutant Strain Able to Form Biofilms on Inert Surfaces: Involvement of a New ompR Allele That In- creases Curli Expression,” Journal of Bacteriology, Vol. 180, 1998, pp. 2442-2449. [26] Z. Saldaña, J. Xicohtencatl-Cortes, F. Avelino, A. D. Phillips, J. B. Kaper, J. L. Puente and J. A. Girón, “Syn- ergistic Role of Curli and Cellulose in Cell Adherence and Biofilm Formation of Attaching and Effacing Es- cherichia coli and Identification of Fis as a Negative Regulator of Curli,” Environmental Microbiology, Vol. 11, No. 4, 2009, pp. 992-1006. doi:10.1111/j.1462-2920.2008.01824.x [27] K. L. Anderson, J. E. Whitlock and V. J. Harwood, “Per- sistence and Differential Survival of Fecal Indicator Bac- teria in Subtropical Waters and Sediments,” Applied and Environmental Microbiology, Vol. 71, No. 6, 2005, pp. 3041-3048. doi:10.1128/AEM.71.6.3041-3048.2005 [28] L. Watterworth, B. Rosa, H. Schraft, E. Topp and K. T. Leung, “Survival of Various ERIC-Genotypes of Shiga Toxin-Producing Escherichia coli in Well Water,” Water, Air, & Soil Pollution, Vol. 177, No. 1-4, 2006, pp. 367- 382. doi:10.1007/s11270-006-9179-x
|