 Vol.3, No.5, 745-754 (2012) Agricultural Sciences http://dx.doi.org/10.4236/as.2012.35090 Baru almonds from different regions of the Brazilian Savanna: Implications on physical and nutritional characteristics Ludmila P. Czeder1, Daniela C. Fernandes1, Jullyana B. Freitas2, Maria Margareth V. Naves3* 1Pos-Graduation Program in Food Science and Technology, School of Agronomy and Food Engineering, Federal University of Goiás (UFG), Goiânia, Brazil 2Federal Institute of Education, Science and Technology (IFG), Goiânia, Brazil 3School of Nutrition, Experimental Nutrition Laboratory, Federal University of Goiás (UFG), Goiânia, Brazil; *Corresponding Author: mnaves@fanut.ufg.br Received 27 June 2012; revised 30 July 2012; accepted 7 August 2012 ABSTRACT While some reports show that physical charac- teristics of the baru fruits (Dipteryx alata Vog.) differ within and among the Brazilian Savanna regions, a study shows that there are differ- ences in the nutritional composition of baru al- monds from different trees from the same Sa- vanna area. It is unknown, however, whether the Savanna’s region influences the nutritional quality of this native almond. Thus, we evaluated the influence of East, Southeast and West re- gions of the Brazilian Savanna on physical characteristics, nutrient composition and pro- tein quality of the baru almond. Chemical com- position and amino acid profile were analyzed, and Amino Acid Score (AAS), Net Protein Ratio (NPR), and Protein Digestibility-Corrected Ami- no Acid Score (PDCAAS) were estimated. The physical characteristics significantly differed with- in but not among regions. The protein (309 g·kg−1), lipid (412 g·kg−1), fiber (121 g·kg−1) and calcium (1297 mg·kg−1) contents of baru almonds were high, with significant differences among regions for insoluble fiber content (94.3 - 128.3 g·kg−1) and amino acid profile (AAS = 77% - 89%). The relative NPR (RNPR) values were similar among regions (mean value of RNPR = 71%), and the PDCAAS values ranged from 65% to 73%. The region of the Brazilian Savanna influences the fiber and amino acid profiles, but not the total content of nutrients, the protein quality and the physical characteristics of the native baru al- monds. The baru almond is a potential food as source of complementary protein for healthy diets and as a nutritious raw material for various food systems. Keywords: Dipteryx alata Vog.; Edible Seeds; Nuts; Savanna; Nutritive Value; Amino Acids 1. INTRODUCTION Native plants from the Brazilian Savanna, the second largest biome in Brazil, have been studied because of their agricultural and technological potentials. These native species represent several dozen families that produce fruits of different sizes, attractive colours, and unique flavours, which can be consumed fresh or as ingredients in juices, liquors, ice creams, and jellies [1,2]. The baru tree (Dipteryx alata Vog.) is a native species of the Brazilian Savanna and belongs to the Fabaceae family. The tree reaches a height of up to 15 m, and its fruit is a light brown drupe that is 5 - 7 cm long and 3 - 5 cm wide. Each fruit contains a single light to dark brown almond, approximately 2 - 2.5 cm long and weighing approximately 1.5 g [3,4]. The baru almond is usually roasted for consumption by the Brazilian Savanna popu- lation and it is used in regional gastronomy. It has a plea- sant taste that resembles the taste of peanuts but its taste and texture are softer [1]. The baru almond contains high amounts of lipid and protein, and is a good source of fiber, minerals, and unsaturated fatty acids, especially oleic acid, and this composition suggests its use in healthy diets [5]. Concerning the physical characteristics, Corrêa et al. [4] reported high physical diversity of fruits and almonds from trees from the same region, with slight differences among the regions of the Brazilian Savanna. The authors of this study conclude that the wide variability within regions could indicate a high potential for plant breeding [4]. Because of this great physical variability of the fruits and almonds from the same region, Fernandes et al. [6] Copyright © 2012 SciRes. OPEN ACCESS  L. P. Czeder et al. / Agricultural Scienc es 3 (2012) 745-754 746 studied baru almonds from different trees from the same region of the Brazilian Savanna, and a significant vari- ability was found in the nutritional quality among the baru almonds. According to the protein quality, a previous study showed a marked deficiency in sulphur-containing amino acids in baru almonds from the East region of the Bra- zilian Savanna, in which the Amino Acid Score (AAS) was approximately 35% [7]. However, almonds from the different plants of the Southeast region of the Brazilian Savanna (Goiás State) presented only a slight deficiency in sulphur-containing amino acids (AAS = 90%) or lysine (AAS = 97%), depending on the plant that baru almond came from [6]. In another study, the baru almond from the West region of the Brazilian Savanna showed a relatively higher deficiency in lysine (AAS = 75%) [8]. Nevertheless, it is unknown if the differences in the nutritional quality of the baru almonds are attributed to intrinsic differences in the trees or differences among Savanna areas, since the previous studies investigating almonds from only one region of this biome. Therefore, this study tested the hypothesis in which the native region of the fruit influences the physical characteristics, nutrient composition, and protein quality of the baru almond. The protein quality was investigated on growing rats, as a model for evaluating the protein bioavailability for humans [9]. 2. MATERIALS AND METHODS 2.1. Fruit Collection, Almond Extraction, and Sample Preparation Fruits of the baru tree were collected from three dif- ferent regions of the Brazilian Savanna in the State of Goiás: East region (lat 15˚52'21'' to 16˚00'09''S, long 48˚56'44'' to 49˚04'25''W), Southeast region (lat 16˚42'41'' to 16˚47'58''S, long 48˚10'21'' to 48˚14'05''W), and West region (lat 16˚51'32'' to 17˚01'22''S, long 50˚09'43'' to 50˚32'14''W). The fruits collected were newly fallen or were on the ground in perfect morphological condition. After, the collected fruits were kept in cotton bags and stored for approximately 60 days at ambient temperature [4] to facilitate the release of the almond from the endo- carp. The almonds were stored at −18˚C for around two months and roasted for the analysis. A schematic repre- sentation of fruit collection, almond extraction, and sam- ple preparation is shown in Figure 1. 2.2. Physical Characterization of the Fruits and Almonds Physical analyses were performed after the storage of the fruits (Figure 1). Twenty fruits were randomly se- lected among 150 fruits collected from each of 6 trees Figure 1. Schematic representation of baru fruit collection, almond extraction, and sample preparation. per region. Baru fruits and almonds were weighed on an analytical balance, and length and width were measured using a metallic digital caliper. Fruit and almond lengths were measured as the distance from the insertion of the peduncle to the opposite side, and widths measurements were based on average lengths. Almonds with injuries or incomplete development were discarded. The yield of almond mass in relation to fruit mass was also evaluated using the following formula: Yield (%) = [almond mass (g)/fruit mass (g)] × 100. 2.3. Chemical Characterization of Almonds Proximate composition was performed by the follow- ing analyses: moisture [10]; nitrogen, determined by the micro-kjeldahl method [10], using a conversion factor of 6.25 [11]; total lipids, gravimetrically determined by extraction with chloroform and methanol [12]; ash, ana- lysed by burning the sample in an oven at 550˚C [10]; and total dietary fiber (soluble and insoluble), deter- mined using the enzymatic-gravimetric technique [13]. Carbohydrate content was estimated by difference, sub- Copyright © 2012 SciRes. OPEN ACCESS  L. P. Czeder et al. / Agricultural Scienc es 3 (2012) 745-754 747 tracting 1000 values obtained for moisture, protein, lipids, ash, and dietary fiber. The energy value of the almond was estimated from the chemical composition data by using the Atwater conversion factors of 4 kcal for protein and carbohydrates and 9 kcal for lipids [14]. Calcium, iron, sodium, and zinc were characterized and quantified in triplicate. Samples (30 g) were incine- rated and then dissolved with concentrated hydrochloric acid. Calcium, iron, and zinc analyses were performed by atomic absorption spectrophotometry (Analyst 200 spec- trometer, Perkin-Elmer). Sodium content was analyzed using the same equipment but by the emission mode. Specific instrumental parameters (lamp, wavelength, lamp current, and slit width) were used for each mineral [10]. The analysis of amino acids was performed in dup- licate. The samples were acid hydrolysed [15] or alkali hydrolysed (for tryptophan) [16]. After hydrolysis, the samples were placed in an automatic amino acid analyzer (Nicolas V., Protein Chemistry Centre of the University of São Paulo, Ribeirão Preto, Brazil). After elution in the column and reaction with ninhydrin, the amino acids were detected colorimetrically and quantified. The AAS was estimated by comparing the results of the amino acids’ profile to the requirement pattern, according to the World Health Organization (WHO) [17], using the following formula: AAS = [(mg of amino acid in 1 g test protein/mg of the amino acid in requirement pattern) 100]. 2.4. Biological Assay and Food Intake Control Three-week-old male Wistar rats (body weight, 42 to 58 g) purchased from Bioagri Laboratories Experimental Animal Center (Planaltina, Federal District, Brazil) were randomly divided into 6 groups (n = 6 each) and housed individually in cages under standardized environmental conditions (12-hour cycles of light and dark, temperature of 22˚C ± 2˚C and relative humidity of 60% ± 5%, with frequent exchanges of air). The entire assay was con- ducted in accordance with the guidelines for the care and use of laboratory animals [18], and the experimental protocol was approved by the Research Ethics Com- mittee of the Federal University of Goiás-UFG (Protocol No. 153/2008). Diets were formulated according to AIN-93G [19], modified to 10% protein, as follow: 2 casein diets (with 7% lipids [reference group, CAS7] and with 14% lipids [control group, CAS14]); three experimental diets (BA- RUE [East region], BARUS [Southeast region] and BA- RUW [West region], with approximately 14% lipids); and a protein-free diet (PF). The baru almond was not defat- ted to preserve its natural characteristics, and the diet CAS14 was used as an internal control of the experiment because it had equivalent lipid content to the baru al- mond diets. The ingredients and chemical composition of these diets are shown in Table 1. The animals were fed their respective diets for 17 days (3 days of acclimatization and 14 days of experiment) (Figure 2). Body weight of the rats was measured three times per week. The animal groups were fed according to the pair- feeding method [20], to ensure similar energy intakes. The amount of food consumed was monitored daily (food consumed = food offered − food wasted). The CAS7 and CAS14 groups received amounts of diet corre- sponding to the average intake of the BARU groups, corrected by the energy conversion factor (ECF) for each diet (food offered = average intake of BARU groups ECF). Potable water was provided ad lib itum. At the end of the experiment, the animals were weighed and eutha- nized with ethyl ether in a closed container. 2.5. Protein Indexes True protein digestibility was determined as recom- mended by the FAO for in vivo testing [21]. The rats’ faeces were marked and collected during the second week of the experiment and ground for nitrogen analysis. Protein digestibility was estimated considering the amount of nitrogen consumed by the animals (I), the amount of nitrogen excreted in faeces by animals fed a protein diet (F), and the amount of metabolic faecal ni- trogen (endogenous), which corresponds to nitrogen ex- creted in faeces by animals fed a protein-free diet (Fk). Thus, protein digestibility was calculated as follow: True protein digestibility (%) = [I – (F – Fk)/I] 100. The protein quality of roasted baru almonds was as- sessed by the Net Protein Ratio (NPR) and Protein Di- gestibility-Corrected Amino Acid Score (PDCAAS) in- dexes. The NPR and the Relative Net Protein Ratio Figure 2. Biological assay design to evaluate protein quality of baru almond from different regions of the Brazilian Savanna. Food intake control (pair-feeding method); Body weight easure on alternate days. m Copyright © 2012 SciRes. OPEN ACCESS  L. P. Czeder et al. / Agricultural Scienc es 3 (2012) 745-754 Copyright © 2012 SciRes. OPEN ACCESS 748 Table 1. Composition of experimental diets. Dieta Content (g·kg−1 of diet) CAS7 CAS14 BARUE BARUS BARUW PF Ingredientb Casein (83.5% protein) 119.8 119.8 - - - - BARUE - - 317.2 - - - BARUS - - - 331.8 - - BARUW - - - - 322.6 - L-cystine 2.0 2.0 - - - - Soybean oil 66.6 136.6 13.5 1.9 3.7 70.0 Cellulosec 50.0 50.0 7.5 5.5 6.8 50.0 Mineral mix 35.0 35.0 35.0 35.0 35.0 35.0 Vitamin mix 10.0 10.0 10.0 10.0 10.0 10.0 Choline bitartrate 2.5 2.5 2.5 2.5 2.5 2.5 Corn starch 714.1 644.1 614.3 613.3 619.4 832.5 Chemical composition Protein (g·kg−1) 104.6 104.8 94.5 97.8 96.4 6.0 Lipids (g·kg−1) 68.7 137.3 146.3 135.9 137.9 66.7 Energy value (kcal) 4143.5 4486.5 4531.5 4479.5 4489.5 4133.5 aAccording to the AIN-93G diet [19]. CAS7: casein with 7% lipids (reference); CAS14: casein with 14% lipids (control); BARU: diets with roasted baru al- monds from the East region (BARUE), the Southeast region (BARUS), and the West region (BARUW); PF: protein-free. bCasein, cellulose, mineral and vitamin mixes were supplied by Rhoster (São Paulo, Brazil). cFor BARU diets, cellulose was added to complete the fiber content of the baru almond. (RNPR) were calculated according to the following for- mulas [22]: NPR = [weight gain (test group) + weight loss (protein-free group)]/protein intake (test group); RNPR = [NPR (test group)/NPR (reference group)] 100. The PDCAAS was determined as follows [21]: PDCAAS (%) = [(AAS of the test protein true digestibility of the test protein)/100]. 2.6. Statistical Analysis The data are presented as mean ± standard deviations and coefficient of variation (physical characteristics). Analysis of variance and the Tukey mean comparison test were used to compare the physical characteristics, chemical composition and biological assay data. STA- TISTICA version 7.0 (StatSoft, Inc., Tulsa, OK, USA, 2004) was used for the statistical analyses. Differences were considered significant when P < 0.05. 3. RESULTS AND DISCUSSION 3.1. Physical Characteristics Baru (fruits and almonds) from the same region of the Brazilian Savanna showed significant diversity in physi- cal characteristics, whereas, there were no significant differences in the physical characteristics of baru fruits and almonds among regions (Table 2). Thus, the wide variability of physical characteristics of the baru within each region prevented possible differences among re- gions. Corrêa et al. [4] studied the physical characteristics of fruits and baru almonds from three regions of the Brazilian Savanna (50 plants per region), and compared the characteristics of the fruits and almonds from plants from different regions and from the same region, as well as fruits from the same plant. According to these authors, the largest variation of physical characteristics occurs among plants of the same region, and this variability indicates high potential of improvement of the evaluated characteristics. The analysis of the almond yield also showed no sig- nificant differences among regions (East: 4.39% [±0.64%]; Southeast: 5.28% [±1.22%]; West: 4.14% [±0.72%]), but variability in yield was found among trees in the same 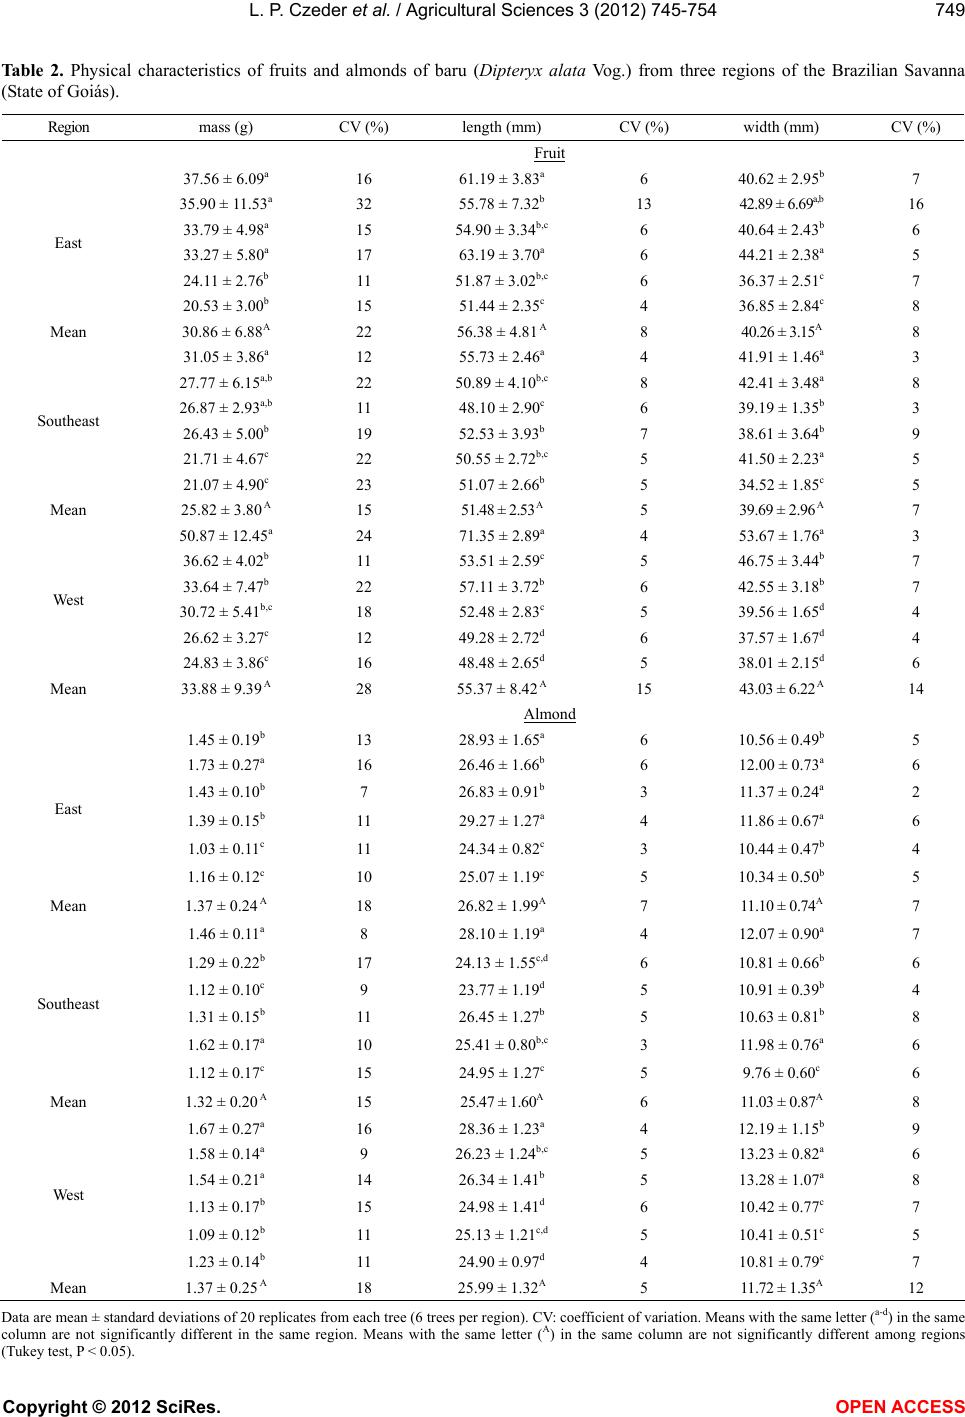 L. P. Czeder et al. / Agricultural Scienc es 3 (2012) 745-754 749 Ta ble 2. Physical characteristics of fruits and almonds of baru (Dipteryx alata Vog.) from three regions of the Brazilian Savanna (State of Goiás). Region mass (g) CV (%) length (mm) CV (%) width (mm) CV (%) Fruit 37.56 ± 6.09a 16 61.19 ± 3.83a 6 40.62 ± 2.95b 7 35.90 ± 11.53a 32 55.78 ± 7.32b 13 42.89 ± 6.69a,b 16 33.79 ± 4.98a 15 54.90 ± 3.34b,c 6 40.64 ± 2.43b 6 33.27 ± 5.80a 17 63.19 ± 3.70a 6 44.21 ± 2.38a 5 24.11 ± 2.76b 11 51.87 ± 3.02b,c 6 36.37 ± 2.51c 7 East 20.53 ± 3.00b 15 51.44 ± 2.35c 4 36.85 ± 2.84c 8 Mean 30.86 ± 6.88A 22 56.38 ± 4.81 A 8 40.26 ± 3.15A 8 31.05 ± 3.86a 12 55.73 ± 2.46a 4 41.91 ± 1.46a 3 27.77 ± 6.15a,b 22 50.89 ± 4.10b,c 8 42.41 ± 3.48a 8 26.87 ± 2.93a,b 11 48.10 ± 2.90c 6 39.19 ± 1.35b 3 26.43 ± 5.00b 19 52.53 ± 3.93b 7 38.61 ± 3.64b 9 21.71 ± 4.67c 22 50.55 ± 2.72b,c 5 41.50 ± 2.23a 5 Southeast 21.07 ± 4.90c 23 51.07 ± 2.66b 5 34.52 ± 1.85c 5 Mean 25.82 ± 3.80 A 15 51.48 ± 2.53 A 5 39.69 ± 2.96 A 7 50.87 ± 12.45a 24 71.35 ± 2.89a 4 53.67 ± 1.76a 3 36.62 ± 4.02b 11 53.51 ± 2.59c 5 46.75 ± 3.44b 7 33.64 ± 7.47b 22 57.11 ± 3.72b 6 42.55 ± 3.18b 7 30.72 ± 5.41b,c 18 52.48 ± 2.83c 5 39.56 ± 1.65d 4 26.62 ± 3.27c 12 49.28 ± 2.72d 6 37.57 ± 1.67d 4 West 24.83 ± 3.86c 16 48.48 ± 2.65d 5 38.01 ± 2.15d 6 Mean 33.88 ± 9.39 A 28 55.37 ± 8.42 A 15 43.03 ± 6.22 A 14 Almond 1.45 ± 0.19b 13 28.93 ± 1.65a 6 10.56 ± 0.49b 5 1.73 ± 0.27a 16 26.46 ± 1.66b 6 12.00 ± 0.73a 6 1.43 ± 0.10b 7 26.83 ± 0.91b 3 11.37 ± 0.24a 2 1.39 ± 0.15b 11 29.27 ± 1.27a 4 11.86 ± 0.67a 6 1.03 ± 0.11c 11 24.34 ± 0.82c 3 10.44 ± 0.47b 4 East 1.16 ± 0.12c 10 25.07 ± 1.19c 5 10.34 ± 0.50b 5 Mean 1.37 ± 0.24 A 18 26.82 ± 1.99A 7 11.10 ± 0.74A 7 1.46 ± 0.11a 8 28.10 ± 1.19a 4 12.07 ± 0.90a 7 1.29 ± 0.22b 17 24.13 ± 1.55c,d 6 10.81 ± 0.66b 6 1.12 ± 0.10c 9 23.77 ± 1.19d 5 10.91 ± 0.39b 4 1.31 ± 0.15b 11 26.45 ± 1.27b 5 10.63 ± 0.81b 8 1.62 ± 0.17a 10 25.41 ± 0.80b,c 3 11.98 ± 0.76a 6 Southeast 1.12 ± 0.17c 15 24.95 ± 1.27c 5 9.76 ± 0.60c 6 Mean 1.32 ± 0.20 A 15 25.47 ± 1.60A 6 11.03 ± 0.87A 8 1.67 ± 0.27a 16 28.36 ± 1.23a 4 12.19 ± 1.15b 9 1.58 ± 0.14a 9 26.23 ± 1.24b,c 5 13.23 ± 0.82a 6 1.54 ± 0.21a 14 26.34 ± 1.41b 5 13.28 ± 1.07a 8 1.13 ± 0.17b 15 24.98 ± 1.41d 6 10.42 ± 0.77c 7 1.09 ± 0.12b 11 25.13 ± 1.21c,d 5 10.41 ± 0.51c 5 West 1.23 ± 0.14b 11 24.90 ± 0.97d 4 10.81 ± 0.79c 7 Mean 1.37 ± 0.25 A 18 25.99 ± 1.32A 5 11.72 ± 1.35A 12 Data are mean ± standard deviations of 20 replicates from each tree (6 trees per region). CV: coefficient of variation. Means with the same letter (a-d) in the same column are not significantly different in the same region. Means with the same letter (A) in the same column are not significantly different among regions (Tukey test, P < 0.05). Copyright © 2012 SciRes. OPEN ACCESS 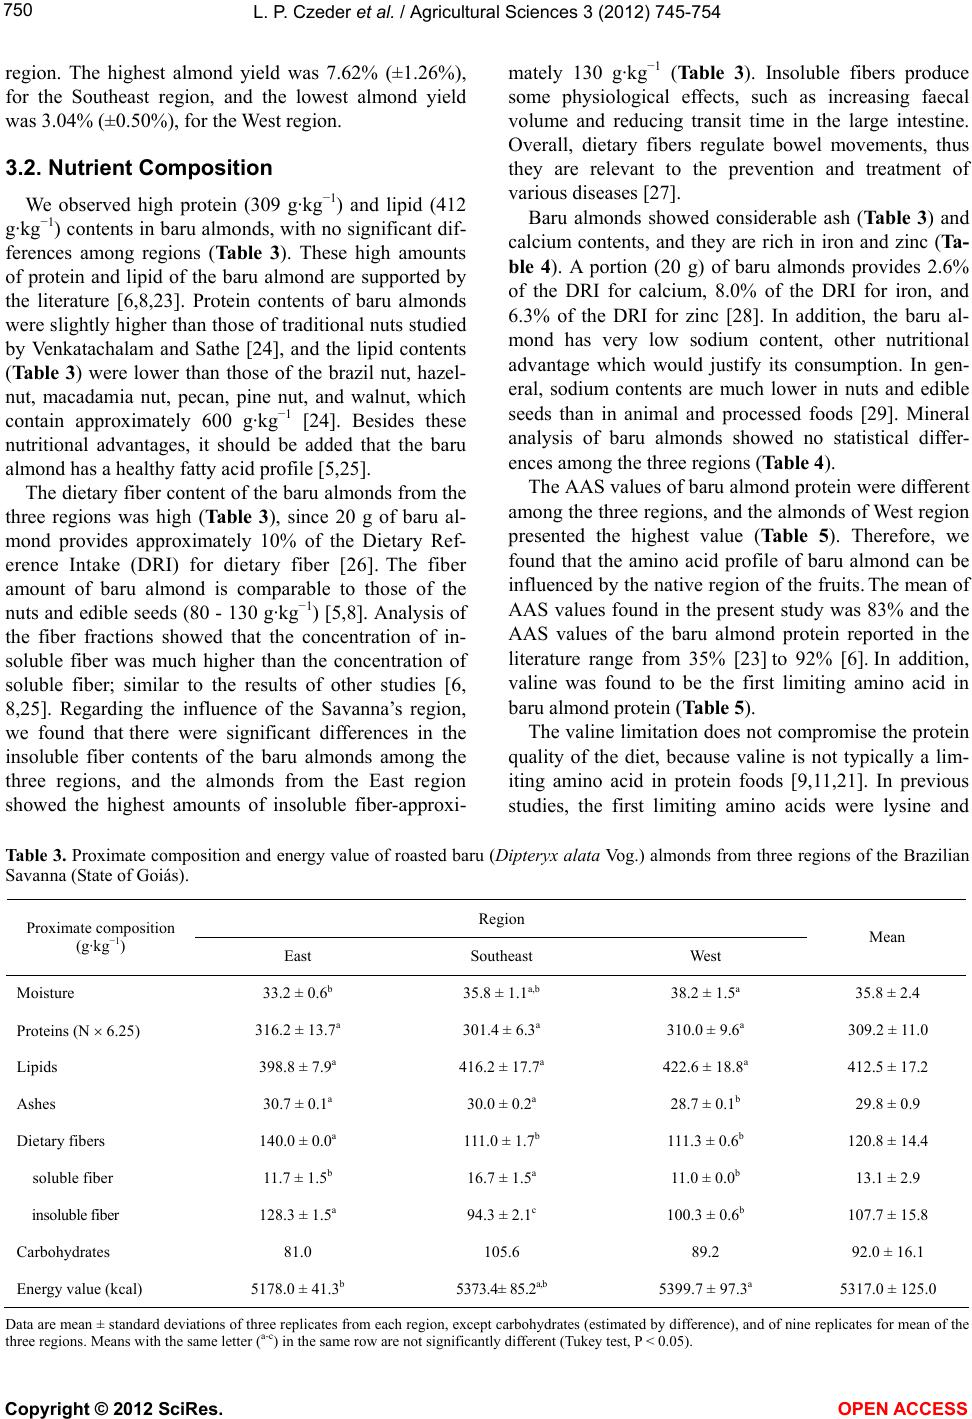 L. P. Czeder et al. / Agricultural Sciences 3 (2012) 745-754 750 region. The highest almond yield was 7.62% (±1.26%), for the Southeast region, and the lowest almond yield was 3.04% (±0.50%), for the West region. 3.2. Nutrient Composition We observed high protein (309 g·kg−1) and lipid (412 g·kg−1) contents in baru almonds, with no significant dif- ferences among regions (Tab le 3 ). These high amounts of protein and lipid of the baru almond are supported by the literature [6,8,23]. Protein contents of baru almonds were slightly higher than those of traditional nuts studied by Venkatachalam and Sathe [24], and the lipid contents (Ta ble 3) were lower than those of the brazil nut, hazel- nut, macadamia nut, pecan, pine nut, and walnut, which contain approximately 600 g·kg−1 [24]. Besides these nutritional advantages, it should be added that the baru almond has a healthy fatty acid profile [5,25]. The dietary fiber content of the baru almonds from the three regions was high (Tab l e 3 ), since 20 g of baru al- mond provides approximately 10% of the Dietary Ref- erence Intake (DRI) for dietary fiber [26]. The fiber amount of baru almond is comparable to those of the nuts and edible seeds (80 - 130 g·kg−1) [5,8]. Analysis of the fiber fractions showed that the concentration of in- soluble fiber was much higher than the concentration of soluble fiber; similar to the results of other studies [6, 8,25]. Regarding the influence of the Savanna’s region, we found that there were significant differences in the insoluble fiber contents of the baru almonds among the three regions, and the almonds from the East region showed the highest amounts of insoluble fiber-approxi- mately 130 g·kg−1 (Table 3). Insoluble fibers produce some physiological effects, such as increasing faecal volume and reducing transit time in the large intestine. Overall, dietary fibers regulate bowel movements, thus they are relevant to the prevention and treatment of various diseases [27]. Baru almonds showed considerable ash (Ta b l e 3 ) and calcium contents, and they are rich in iron and zinc (Ta- ble 4). A portion (20 g) of baru almonds provides 2.6% of the DRI for calcium, 8.0% of the DRI for iron, and 6.3% of the DRI for zinc [28]. In addition, the baru al- mond has very low sodium content, other nutritional advantage which would justify its consumption. In gen- eral, sodium contents are much lower in nuts and edible seeds than in animal and processed foods [29]. Mineral analysis of baru almonds showed no statistical differ- ences among the three regions (Table 4). The AAS values of baru almond protein were different among the three regions, and the almonds of West region presented the highest value (Table 5). Therefore, we found that the amino acid profile of baru almond can be influenced by the native region of the fruits. The mean of AAS values found in the present study was 83% and the AAS values of the baru almond protein reported in the literature range from 35% [23] to 92% [6]. In addition, valine was found to be the first limiting amino acid in baru almond protein (Table 5). The valine limitation does not compromise the protein quality of the diet, because valine is not typically a lim- iting amino acid in protein foods [9,11,21]. In previous studies, the first limiting amino acids were lysine and Table 3. Proximate composition and energy value of roasted baru (Dipteryx alata Vog.) almonds from three regions of the Brazilian Savanna (State of Goiás). Region Proximate composition (g·kg−1) East Southeast West Mean Moisture 33.2 ± 0.6b 35.8 ± 1.1a,b 38.2 ± 1.5a 35.8 ± 2.4 Proteins (N 6.25) 316.2 ± 13.7a 301.4 ± 6.3a 310.0 ± 9.6a 309.2 ± 11.0 Lipids 398.8 ± 7.9a 416.2 ± 17.7a 422.6 ± 18.8a 412.5 ± 17.2 Ashes 30.7 ± 0.1a 30.0 ± 0.2a 28.7 ± 0.1b 29.8 ± 0.9 Dietary fibers 140.0 ± 0.0a 111.0 ± 1.7b 111.3 ± 0.6b 120.8 ± 14.4 soluble fiber 11.7 ± 1.5b 16.7 ± 1.5a 11.0 ± 0.0b 13.1 ± 2.9 insoluble fiber 128.3 ± 1.5a 94.3 ± 2.1c 100.3 ± 0.6b 107.7 ± 15.8 Carbohydrates 81.0 105.6 89.2 92.0 ± 16.1 Energy value (kcal) 5178.0 ± 41.3b 5373.4± 85.2a,b 5399.7 ± 97.3a 5317.0 ± 125.0 Data are mean ± standard deviations of three replicates from each region, except carbohydrates (estimated by difference), and of nine replicates for mean of the three regions. Means with the same letter (a-c) in the same row are not significantly different (Tukey test, P < 0.05). Copyright © 2012 SciRes. OPEN ACCESS 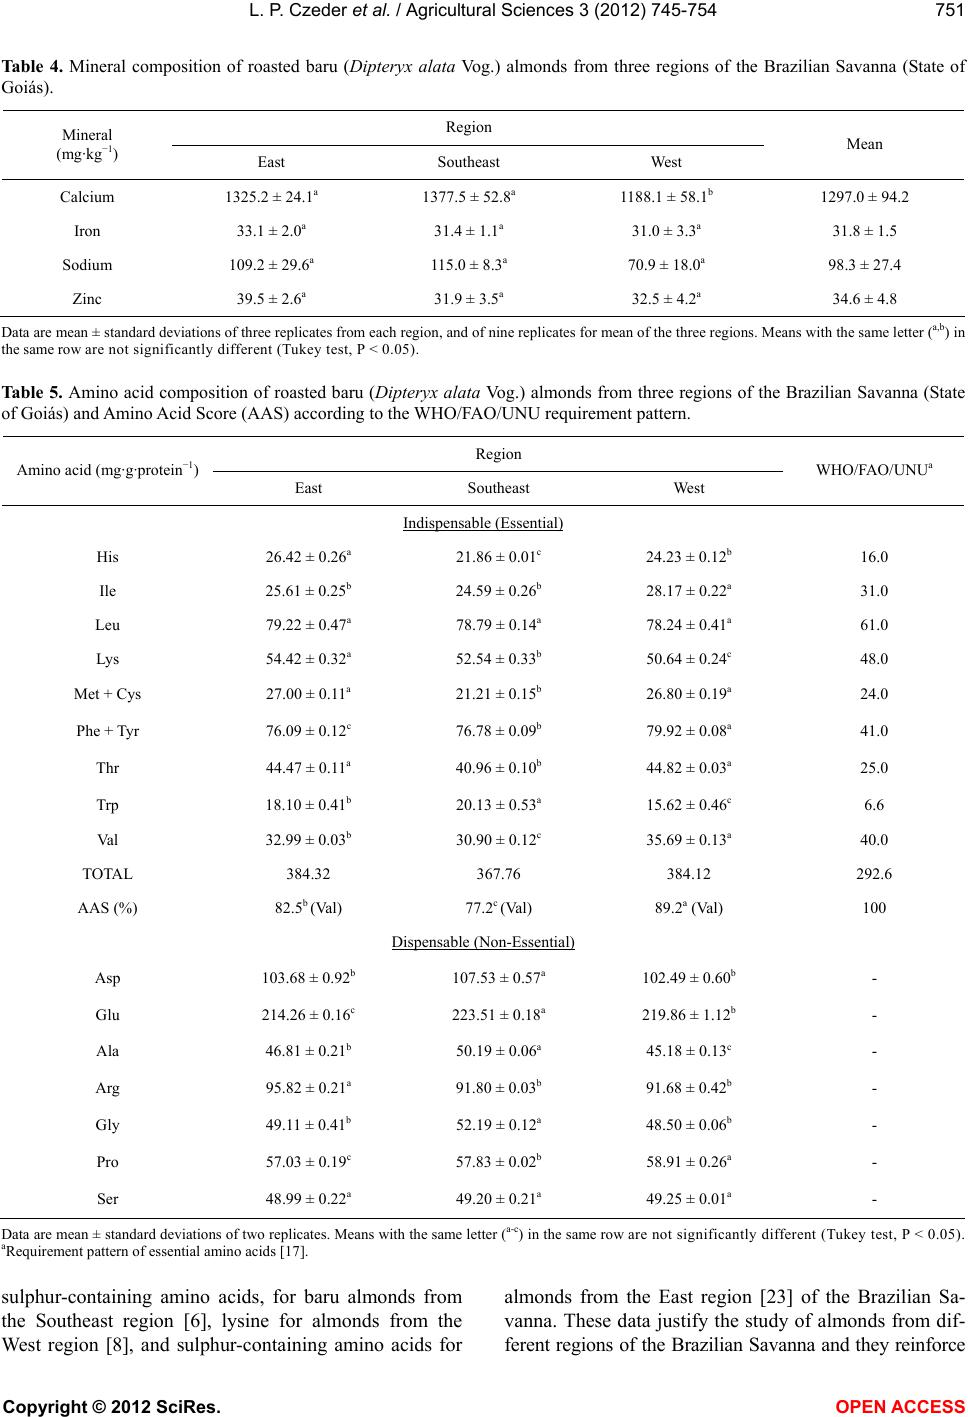 L. P. Czeder et al. / Agricultural Sciences 3 (2012) 745-754 751 Tab le 4 . Mineral composition of roasted baru (Dipteryx alata Vog.) almonds from three regions of the Brazilian Savanna (State of Goiás). Region Mineral (mg·kg−1) East Southeast West Mean Calcium 1325.2 ± 24.1a 1377.5 ± 52.8a 1188.1 ± 58.1b 1297.0 ± 94.2 Iron 33.1 ± 2.0a 31.4 ± 1.1a 31.0 ± 3.3a 31.8 ± 1.5 Sodium 109.2 ± 29.6a 115.0 ± 8.3a 70.9 ± 18.0a 98.3 ± 27.4 Zinc 39.5 ± 2.6a 31.9 ± 3.5a 32.5 ± 4.2a 34.6 ± 4.8 Data are mean ± standard deviations of three replicates from each region, and of nine replicates for mean of the three regions. Means with the same letter (a,b) in the same row are not significantly different (Tukey test, P < 0.05). Table 5. Amino acid composition of roasted baru (Dipteryx alata Vog.) almonds from three regions of the Brazilian Savanna (State of Goiás) and Amino Acid Score (AAS) according to the WHO/FAO/UNU requirement pattern. Region Amino acid (mg·g·protein−1) East Southeast West WHO/FAO/UNUa Indispensable (Essential) His 26.42 ± 0.26a 21.86 ± 0.01c 24.23 ± 0.12b 16.0 Ile 25.61 ± 0.25b 24.59 ± 0.26b 28.17 ± 0.22a 31.0 Leu 79.22 ± 0.47a 78.79 ± 0.14a 78.24 ± 0.41a 61.0 Lys 54.42 ± 0.32a 52.54 ± 0.33b 50.64 ± 0.24c 48.0 Met + Cys 27.00 ± 0.11a 21.21 ± 0.15b 26.80 ± 0.19a 24.0 Phe + Tyr 76.09 ± 0.12c 76.78 ± 0.09b 79.92 ± 0.08a 41.0 Thr 44.47 ± 0.11a 40.96 ± 0.10b 44.82 ± 0.03a 25.0 Trp 18.10 ± 0.41b 20.13 ± 0.53a 15.62 ± 0.46c 6.6 Val 32.99 ± 0.03b 30.90 ± 0.12c 35.69 ± 0.13a 40.0 TOTAL 384.32 367.76 384.12 292.6 AAS (%) 82.5b (Val) 77.2c (Val) 89.2a (Val) 100 Dispensable (Non-Essential) Asp 103.68 ± 0.92b 107.53 ± 0.57a 102.49 ± 0.60b - Glu 214.26 ± 0.16c 223.51 ± 0.18a 219.86 ± 1.12b - Ala 46.81 ± 0.21b 50.19 ± 0.06a 45.18 ± 0.13c - Arg 95.82 ± 0.21a 91.80 ± 0.03b 91.68 ± 0.42b - Gly 49.11 ± 0.41b 52.19 ± 0.12a 48.50 ± 0.06b - Pro 57.03 ± 0.19c 57.83 ± 0.02b 58.91 ± 0.26a - Ser 48.99 ± 0.22a 49.20 ± 0.21a 49.25 ± 0.01a - Data are mean ± standard deviations of two replicates. Means with the same letter (a-c) in the same row are not significantly different (Tukey test, P < 0.05). aRequirement pattern of essential amino acids [17]. sulphur-containing amino acids, for baru almonds from the Southeast region [6], lysine for almonds from the West region [8], and sulphur-containing amino acids for almonds from the East region [23] of the Brazilian Sa- vanna. These data justify the study of almonds from dif- ferent regions of the Brazilian Savanna and they reinforce Copyright © 2012 SciRes. OPEN ACCESS 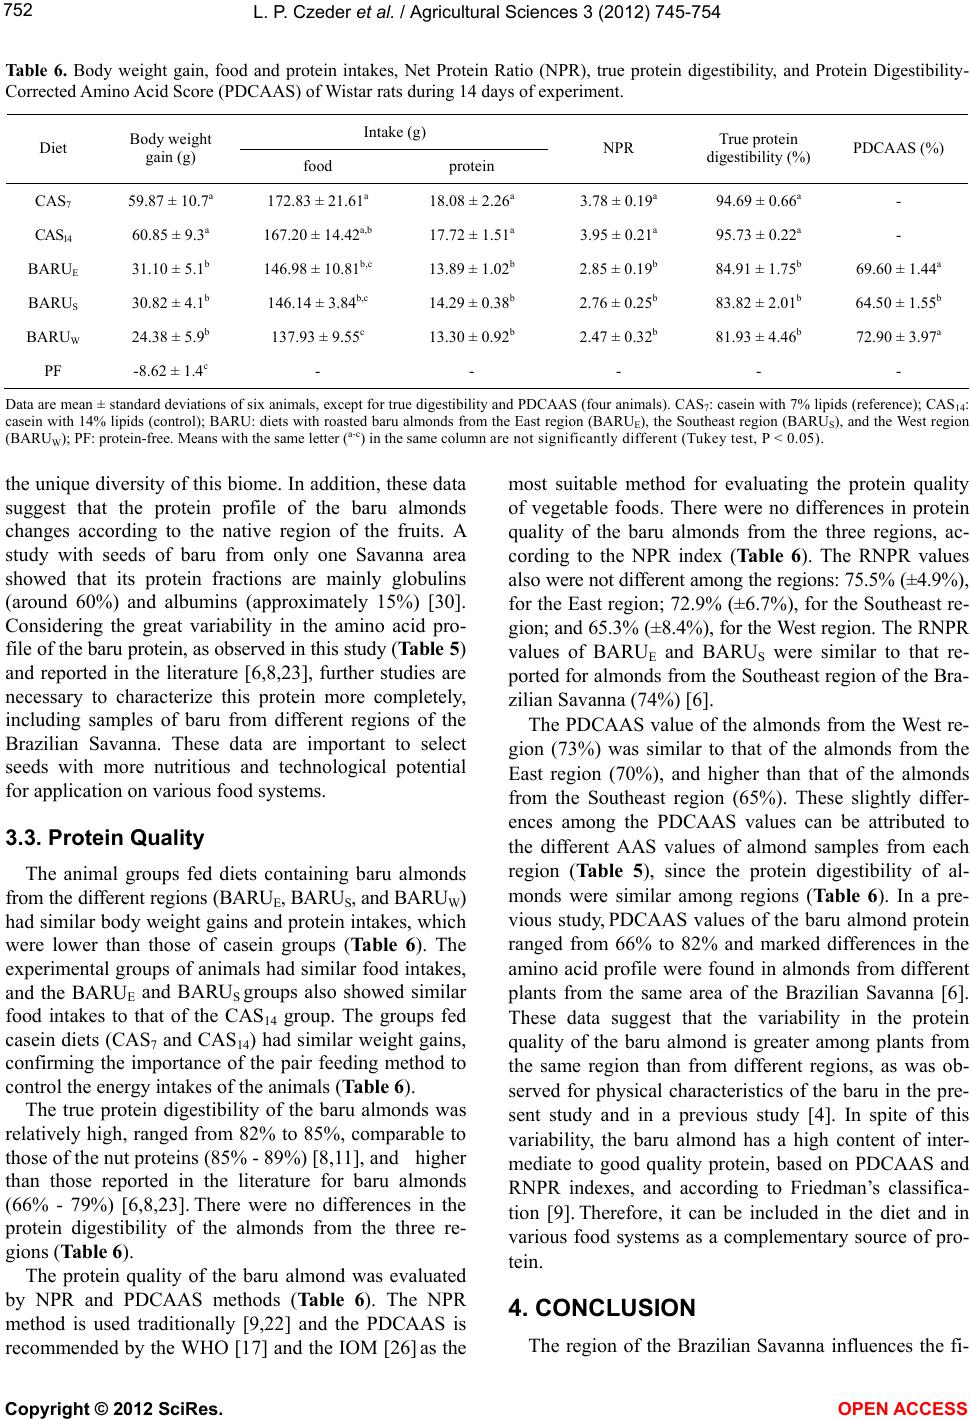 L. P. Czeder et al. / Agricultural Sciences 3 (2012) 745-754 752 Table 6. Body weight gain, food and protein intakes, Net Protein Ratio (NPR), true protein digestibility, and Protein Digestibility- Corrected Amino Acid Score (PDCAAS) of Wistar rats during 14 days of experiment. Intake (g) Diet Body weight gain (g) food protein NPR True protein digestibility (%) PDCAAS (%) CAS7 59.87 ± 10.7a 172.83 ± 21.61a 18.08 ± 2.26a 3.78 ± 0.19a 94.69 ± 0.66a - CAS14 60.85 ± 9.3a 167.20 ± 14.42a,b 17.72 ± 1.51a 3.95 ± 0.21a 95.73 ± 0.22a - BARUE 31.10 ± 5.1b 146.98 ± 10.81b,c 13.89 ± 1.02b 2.85 ± 0.19b 84.91 ± 1.75b 69.60 ± 1.44a BARUS 30.82 ± 4.1b 146.14 ± 3.84b,c 14.29 ± 0.38b 2.76 ± 0.25b 83.82 ± 2.01b 64.50 ± 1.55b BARUW 24.38 ± 5.9b 137.93 ± 9.55c 13.30 ± 0.92b 2.47 ± 0.32b 81.93 ± 4.46b 72.90 ± 3.97a PF -8.62 ± 1.4c - - - - - Data are mean ± standard deviations of six animals, except for true digestibility and PDCAAS (four animals). CAS7: casein with 7% lipids (reference); CAS14: casein with 14% lipids (control); BARU: diets with roasted baru almonds from the East region (BARUE), the Southeast region (BARUS), and the West region (BARUW); PF: protein-free. Means with the same letter (a-c) in the same column are not significantly different (Tukey test, P < 0.05). the unique diversity of this biome. In addition, these data suggest that the protein profile of the baru almonds changes according to the native region of the fruits. A study with seeds of baru from only one Savanna area showed that its protein fractions are mainly globulins (around 60%) and albumins (approximately 15%) [30]. Considering the great variability in the amino acid pro- file of the baru protein, as observed in this study (Table 5) and reported in the literature [6,8,23], further studies are necessary to characterize this protein more completely, including samples of baru from different regions of the Brazilian Savanna. These data are important to select seeds with more nutritious and technological potential for application on various food systems. 3.3. Protein Quality The animal groups fed diets containing baru almonds from the different regions (BARUE, BARUS, and BARUW) had similar body weight gains and protein intakes, which were lower than those of casein groups (Table 6). The experimental groups of animals had similar food intakes, and the BARUE and BARUS groups also showed similar food intakes to that of the CAS14 group. The groups fed casein diets (CAS7 and CAS14) had similar weight gains, confirming the importance of the pair feeding method to control the energy intakes of the animals (Table 6). The true protein digestibility of the baru almonds was relatively high, ranged from 82% to 85%, comparable to those of the nut proteins (85% - 89%) [8,11], and higher than those reported in the literature for baru almonds (66% - 79%) [6,8,23]. There were no differences in the protein digestibility of the almonds from the three re- gions (Table 6). The protein quality of the baru almond was evaluated by NPR and PDCAAS methods (Table 6). The NPR method is used traditionally [9,22] and the PDCAAS is recommended by the WHO [17] and the IOM [26] as the most suitable method for evaluating the protein quality of vegetable foods. There were no differences in protein quality of the baru almonds from the three regions, ac- cording to the NPR index (Tab le 6 ). The RNPR values also were not different among the regions: 75.5% (±4.9%), for the East region; 72.9% (±6.7%), for the Southeast re- gion; and 65.3% (±8.4%), for the West region. The RNPR values of BARUE and BARUS were similar to that re- ported for almonds from the Southeast region of the Bra- zilian Savanna (74%) [6]. The PDCAAS value of the almonds from the West re- gion (73%) was similar to that of the almonds from the East region (70%), and higher than that of the almonds from the Southeast region (65%). These slightly differ- ences among the PDCAAS values can be attributed to the different AAS values of almond samples from each region (Table 5), since the protein digestibility of al- monds were similar among regions (Tab le 6 ). In a pre- vious study, PDCAAS values of the baru almond protein ranged from 66% to 82% and marked differences in the amino acid profile were found in almonds from different plants from the same area of the Brazilian Savanna [6]. These data suggest that the variability in the protein quality of the baru almond is greater among plants from the same region than from different regions, as was ob- served for physical characteristics of the baru in the pre- sent study and in a previous study [4]. In spite of this variability, the baru almond has a high content of inter- mediate to good quality protein, based on PDCAAS and RNPR indexes, and according to Friedman’s classifica- tion [9]. Therefore, it can be included in the diet and in various food systems as a complementary source of pro- tein. 4. CONCLUSION The region of the Brazilian Savanna influences the fi- Copyright © 2012 SciRes. OPEN ACCESS  L. P. Czeder et al. / Agricultural Sciences 3 (2012) 745-754 753 ber and amino acid profiles, but not the total content of nutrients, the protein quality and the physical character- istics of native baru almonds. Apart from the native re- gion, the nutritional value of the baru almond is relevant to human health, and its consumption and use in pro- cessed foods should be encouraged as a protein food for healthy diets. 5. ACKNOWLEDGEMENTS We are grateful to CNPq and CAPES (Brazil), for their financial support. We are also grateful to professor Dr. Ronaldo Veloso Naves, from the School of Agronomy and Food Engineering (UFG), for guid- ance and assistance in collecting baru fruits. REFERENCES [1] Castro, A.M. (2009) Flavors of cerrado. Ministério das Relações Exteriores (Brasil), Brasília, DF. http://www.dc.mre.gov.br/imagens-e-textos/revista-textos-do -brasil [2] Soares, T.N., Chaves, L.J., Telles, M.P.C. and Diniz-Filho, J.A.F. (2008) Landscape conservation genetics of Dip- teryx alata (“baru” tree: Fabaceae) from Cerrado region of central Brazil. Genetica, 132, 9-19. doi:10.1007/s10709-007-9144-7 [3] Ribeiro, R.A. and Rodrigues, F.M. (2006) Genética da conservação em espécies vegetais do Cerrado/Conserva- tion genetics in vegetal species of cerrado. Revista de Ciências Médicas e Biológicas, 5, 253-260. http://www.portalseer.ufba.br/i nde x. ph p/ c mbi o/issue / vie w /50 5/showToc [4] Corrêa, G.C., Naves, R.V., Rocha, M.R. and Zica, L.F. (2000) Caracterização física de frutos de baru (Dipteryx alata Vog.) em três populações nos cerrados do estado de Goiás/Physical caracterization of baru fruits (Dipteryx alata Vog.) in three populations in cerrados from Goiás state. Pesquisa Agr opec uária Tropical, 30, 5-11. http://www.revistas.ufg.br/index.php/pat/issue /view /303 [5] Freitas, J.B. and Naves, M.M.V. (2010) Composição química de nozes e sementes comestíveis e sua relação com a nutrição e saúde/Chemical composition of nuts and edible seeds and their relation to nutrition and health. Revista de Nutrição, 23, 269-279. doi:10.1590/ S1415-52732010000200010 [6] Fernandes, D.C., Freitas, J.B., Czeder, L.P. and Naves, M.M.V. (2010) Nutritional composition and protein value of the baru (Dipteryx alata Vog.) almond from the Bra- zilian Savana. Journal of the Science of Food and Agri- culture, 90, 1650-1655. doi:10.1002/jsfa.3997 [7] Togashi, M. and Sgarbieri, V.C. (1995) Avaliação nutri- cional da proteína e do óleo de sementes de baru (Dip- teryx alata Vog.)/Nutritional evaluation of protein and oil of baru seeds (Dipteryx alata Vog.). Ciência e Tecnologia de Alimentos, 15, 66-69. [8] Freitas, J.B., Fernandes, D.C., Czeder, L.P., Lima, J.C.R., Sousa, A.G.O. and Naves, M.M.V. (2012) Edible seeds and nuts grown in Brazil as sources of protein for human nutrition. Food and Nutrition Sciences, 3, 857-862. doi:10.4236/fns.2012.36114 [9] Friedman, M. (1996) Nutritional value of proteins from different food sources. A review. Journal of Agricultural and Food Chemistry, 44, 6-29. doi:10.1021/jf9400167 [10] Association of Official Analytical Chemists (1990) Offi- cial methods of analysis. 15th Edition, AOAC, Arlington. [11] FAO—Food and Agriculture Organization of the United Nations (1970) Amino-acid content of foods and biologi- cal data on proteins. FAO, Rome. [12] Bligh, E.G. and Dyer, W.J. (1959) A rapid method of total lipid extraction and purification. Canadian Journal of Biochemistry and Physiology, 37, 911-917. doi:10.1139/o59-099 [13] Prosky, L., Asp, N., Schweizer, T.F., Devries, J.W. and Furda, I. (1988) Determination of insoluble, soluble and total dietary fiber in foods and foods products: Interlabo- ratory study. Journal of the Association of Official Ana- lytical Chemists, 71, 1017-1023. [14] Merril, A.L. and Watt, B.K. (1973) Energy value of foods: Basis and derivation. United States Department of Agri- culture, Washington DC. [15] Moore, S., Spackman, D.H. and Stein, W.H. (1958) Chro- matography of amino acids on sulfonated polystyrene resins. Analytical Chemistry, 30, 1185-1190. doi:10.1021/ac60139a005 [16] Lucas, B. and Sotelo, A. (1980) Effect of different alka- lies, temperature, and hydrolyses times on tryptophan de- termination of pure proteins and foods. Analytical Chem- istry, 109, 192-197. [17] WHO—World Health Organization (2007) Protein and amino acid requirements in human nutrition. WHO, Ge- neva, WHO Technical Report Series 935. [18] National Research Council (1996) Guide for the care and use of laboratory animals. NRC, National Academy Press, Washington DC. [19] Reeves, P.G., Nielsen, F.H. and Fahey Jr., G.C. (1993) AIN-93 purified diets for laboratory rodents: Final Report of the American Institute of Nutrition Ad Hoc Writing Committee on the Reformulation of the AIN-76A Rodent Diet. The Jounal of Nutrition, 123, 1939-1951. http://jn.nutrition.org/content/123/11/1939. full.pdf+html [20] Muggia-Sullam, M., Matarese, L.E., Edwards, L.L. and Fischer, J.E. (1986) Efficacy of two elemental diets: A pair feeding study. Journal of Parenteral and Enteral Nutrition, 10, 45-48. doi:10.1177/014860718601000 145 [21] FAO—Food and Agriculture Organization of the United Nations (1991) Protein quality evaluation. Report of a Joint FAO/WHO Expert Consultation. FAO, Rome. [22] Pellett, P.L. and Young, V.R. (1980) Nutritional evalua- tion of protein foods. The United Nations University, To- kyo. [23] Togashi, M. and Sgarbieri, V.C. (1994) Caracterização química parcial do fruto do baru (Dipteryx alata Vog.)/ Proximate chemical characterizaton of the “baru” (Dip- teryx alata Vo g . ) . Ciência e Te cnologia de Alimentos, 14, 85-95. Copyright © 2012 SciRes. OPEN ACCESS  L. P. Czeder et al. / Agricultural Sciences 3 (2012) 745-754 Copyright © 2012 SciRes. OPEN ACCESS 754 [24] Venkatachalam, M. and Sathe, S.K. (2006) Chemical composition of selected edible nut seeds. Journal of Ag- ricultural and Food Chemistry, 54, 4705-4714. doi:10.1021/jf0606959 [25] Takemoto, E., Okada, I.A., Garbelotti, M.L., Tavares, M. and Aued-Pimentel, S. (2001) Composição química da semente e do óleo de baru (Dipteryx ala ta Vog.) nativo do município de Pirenópolis, estado de Goiás/Chemical com- position of seeds and oil of baru (Dipteryx alata Vog.) native from Pirenópolis, State of Goiás, Brazil. Revista do Instituto Adolfo Lutz, 60, 113-117. http://alavanca.org.br/Du%20Quilombo/ baru[1].pdf [26] IOM—Institute of Medicine (2005) Dietary reference intakes for energy, carbohydrate, fiber, fat, fatty acids, cholesterol, protein, and amino acids. IOM, National Academy Press, Washington DC. [27] Roberfroid, M., Gibson, G.R., Hoyles, L., McCartney, A.L., Rastall, R., Rowland, I., Wolvers, D., Watzl, B., Szajewska, H., Stahl, B., Guarner, F., Respondek, F., Whelan K., Coxam, V., Davicco, M.-J., Léotoing, L., Wittrant, Y., Delzenne, N.M., Cani, P.D., Neyrinck, A.M. and Meheust, A. (2010) Prebiotic effects: Metabolic and health benefits. British Journal of Nutrition, 104, S1-S63. doi:0.1017/S0007114510003363 [28] IOM—Institute of Medicine (2006) Dietary reference intakes research synthesis: Workshop summary. IOM, National Academy Press, Washington DC. [29] Segura, R., Javierre, C., Lizarraga, M.A. and Rose, E. (2006) Other relevant components of nuts: Phytosterols, folate and minerals. British Journal of Nutrition, 96, S36- S44. doi:10.1017/BJN20061862 [30] Cruz, K.S., Silva, M.A., Freitas, O. and Neves, V.A. (2011) Partial characterization of proteins from baru (Dipteryx alata Vog) seeds. Journal of the Science of Food and Agriculture, 91, 2006-2012. doi:10.1002/jsfa.4410
|