 Vol.3, No.5, 640-650 (2012) Agricultural Sciences http://dx.doi.org/10.4236/as.2012.35077 Investigating poverty in rural Iran: The multidimensional poverty approach Abdoulrasool Shirvanian, Mohammad Bakhshoodeh* Agricultural Economics, Shiraz University, Shiraz, Iran; *Corresponding Author: bakhshoodeh@gmail.com Received 1 June 2012; revised 8 July 2012; accepted 19 July 2012 ABSTRACT In this study, rural poverty in Iran is investigated applying a multidimensional approach, associa- tion rules mining technique, and Levine, F and Tukey tests to household data of 2008. The re- sults indicate that poverty in its multi-dimen- sions is an epidemic problem in rural Iran. The results also exhibit that there are 11 patterns of poverty in the rural areas including four main patterns with 99.62% coverage and seven sub- patterns with nearly 0.38% coverage. In these patterns, housing and household education are the most important dimensions of poverty and income poverty is the least important dimension. Government income support policy to house- holds, in enforcement the law of targeting sub- sidies, cannot be regarded as pro poor policy but it follows other political aspects. Keywords: Multidimensional Poverty Approach; Rural Poverty; Data Mining; Iran 1. INTRODUCTION Until the early 1990s, poverty definitions and its measuring methods were largely based on income ap- proach where poverty was recognized as lack of minimum income. Accordingly, this approach only considers the welfare aspects of human life that can be expressed in terms of revenue [1-4]. Therefore, the income poverty approach cannot explain much of people capabilities and so cannot be a base for fully explanation of poverty phe- nomenon in society. Moreover, using the income ap- proach in classifying individuals as poor and non-poor follows the basic abnormality. It is possible that in prac- tice a poor be classified as a non-poor based on income approach [5]. So, focusing on this approach in studying poverty phenomenon and developing strategies and poli- cies to support poor is a big risk [4]. With respect to these matters, moving from the income poverty approach to multidimensional poverty approach is an important pro- gress in the poverty literature [1-3,6,7]. In the multidimensional approach, poverty concentra- tion lies on the deprivation from resources and opportu- nities that entitle to each person in society, and poverty structure is expressed by reflecting the human failure in different dimensions of human welfare [3,8]. Human welfare has many dimensions such as housing, health, feeding, education, income, etc. Housing concept is not only constraint on the shelter as physical location but also involves the residential environment, all services and facilities that are necessary for better family life, and relatively right and safe occupation. Providing these ser- vices and facilities, facilitate inhabitants’ activities, in- creases their efficiency and is a factor in establishing a stable life. Accordingly, efforts to achieve these quality criteria determine the ability of referring the term housing to buildings and structures [5,9-16]. Health poverty fo- cuses on people who need health care. In absence of these cares, they suffer from health deprivation [17]. Someone who has low access to health services drop into disease trap and so disable to obtain suitable food, housing and job. Food poverty is the latest and the most unacceptable sign of frustration in people basic needs and is considered as the most important poverty dimension at the commu- nity and occurs when a person is unable to consume enough food according to acceptable society manner [18,19]. Education poverty causes to reduction in the individuals’ human capital and so deprives them from suitable position of social opportunities [20-23] and as- cending the training level trepans more reduction in the poverty rate [21-25]. To sum up, income alone is not a strong criterion to describe poverty phenomenon and to determine welfare, and therefore paying attention to the other dimensions such as housing, health, food and education are essential in examining the phenomenon of poverty in communities. In investigating these dimensions through multidimen- sional poverty approach, it is important to note that each welfare dimensions concentrate on the clear and separable matters [4,26-29]. So, in order to calculate each dimen- sion, its criteria should be separately and independently considered from calculation of the criteria of other di- Copyright © 2012 SciRes. OPEN ACCESS  A. Shirvanian, M. Bakhshoodeh / Agricultural Sciences 3 (2012) 640-650 641 mensions [1-3]. Another issue in concerning to poverty phenomenon is related to poverty distribution. According to the literature, poverty distribution in worldwide is such that developing countries suffer more than developed countries. In de- veloping countries, large portion of the population live in rural areas and most of them are poor. So, the rural area in developing countries is considered as poor habitat [30] and poor in developing countries often do not have access to adequate housing and related services [31,32]. In these countries, health inadequacy made health poverty as a feature of rural poverty, notwithstanding optimistic thoughts about health in rural communities [33]. In nourishment dimension, the persons suffer from food poverty belong to the poorest people in developing coun- tries and most of them concentrate in rural areas [11]. Education poverty in these countries is a common matter among many segments of society, especially the villagers [20-23]. Thus, in order to further success in fighting with mul- tidimensional poverty on a global scale, focusing on rural communities in developing countries is essentially and substantially attempt with high emergency. Iran is one of the developing countries that suffers from most of welfare dimensions. For instance, in housing dimension, despite the ideals aspirations in providing housing and making different strategies to achieve these ideals, the gap of classes between minority groups with the best housing and groups without adequate housing has become deeper [34]. Health system is also poor and im- posing heavy costs on households is the most inadequacy and insufficiency of this system [35,36]. In nourishment dimension, in spite of the extensive legal and executive power in order to combat poverty in the country, house- holds are faced with shortages in energy and micronutri- ents and imbalances in food consumption are intense. Geographic distribution of food poverty is also such that poor are more concentrated in rural areas [37,38]. These collections formed footstone of this investigation and made it essential. Therefore, study of multidimen- sional poverty phenomenon in Iranian rural society is targeted. 2. METHODS There are many dimensions to be considered in the multidimensional poverty approach that are restricted to data accessibility [10,39]. Accordingly, five rural poverty dimensions including housing, health, nutrition, educa- tion and income were examined in this study. Following Ravallion [40], food poverty index was calculated based on food usage in the normal range (best nutritional status) considering food pyramid adjusted for age and gender [41,42]. Determining a normal diet based household food poverty not only provides the body needed energy, but indicates the nature of households’ food poverty and can be considered as a practical guide- line in the household food management to reduce and eradicate food poverty [11]. The most common indicators of adequate housing, in- cluding security, the sewer system, ownership, and den- sity indexes were considered as the housing dimension. Efforts to achieve these quality criteria determine the ability of referring the term housing to buildings and structures [5,9-11,13-16]. Quality of remedy financial management was consid- ered as the indicator of health poverty [43,44]. The household health expenditure as proportion of income was used to identify rural households that suffer from health poverty and to determine their health poverty gap [40,45,46]: i i i C x (1) where xi is the health expenditure to income ratio for ith household, and HCi and Ii are respectively the health expenditure and income of ith household. It should be noted that in the above relationship, household health expenditure is perfectly unexpected and household in- come, in comparing with this expenditure, is constant [47]. In order to examine education poverty, the information literacy indexes including information admission criterion and indicators of literacy skills were used [48]. The for- mer index focuses on receiving information from various sources, including publications (newspaper, magazine and journal, and books), variety of media-aural visuals (fixed and mobile telephones, radio, television, computer, video and similar devices), and internet [48,49]. Indica- tors of literacy skills show the status of formal training in households and are introduced as a prerequisite for im- plementing information literacy skills. Despite the avail- ability of information, lack of these skills can make the usage of these information impossible [48]. In this study, literacy skills were assessed by net enrolment rate [48,49] that shows the percentage of family members gaining education opportunities and calculated as [48,50]: *100 i i i NSL NER PN (2) where NERi is net enrolment rate at ith level of education, NSLi is all students in household at ith education level and PNi represents all household members that potentially lie in the ith education level. In the multidimensional approach to poverty, income dimension must be calculated independently from other dimensions of poverty [1-3,7] whereas it is the cumulative measure of the monetary needs of individuals in the in- Copyright © 2012 SciRes. OPEN ACCESS  A. Shirvanian, M. Bakhshoodeh / Agricultural Sciences 3 (2012) 640-650 642 come poverty approach and so it is not independent of other dimensions of poverty. Therefore, the multidimen- sional approach to poverty cannot use the methods of calculation poverty line based on the income approach. Due to this, some studies have focused on the inability to earn appropriate income [16,51,52]. Combining informa- tion on household expenditure with income is an appro- priate approach in order to complete the income criteria in the estimation of income poverty by use of household expenditure survey data [53-55]. In this study, the ratio of net expenditure (expenditure minus investment) to dis- posable income of household was used for this purpose [53,55,56] as expressed by [57]: i i i TX IP TI (3) where IPi is the income poverty criteria for the ith household, TXi and TIi are respectively total expenditure and total disposable income of the ith household. Following Grootaert, et al. [58] and Okunmadewa, et al. [59], in order to aggregate indicators and indexes and then to express household poverty status in an overall index, the values of each indicator and index are normalized by Eq.4: 100 jij ij j zx pz (4) in which pij represents poverty status of the ith household taking the jth indicator or index, zj is the acceptable value of jth index or indicator and xij is the amount of the ith household’s owners from the jth indicator or index. Then, the overall index of poverty for each household P is expressed as [3,60]: 1n j j Pa n p (5) where n is the number of indicators or indices, aj indicated the weight of jth indicator or index, and pj is the poverty rate for each household in the jth indicator or index. It should be noted that the entropy weighting method was used to determine appropriate weights of indicators and indices [61-64]. Furthermore, determining the overall poverty situation in rural society needs to assess the level of the headcount ratio and the poverty gap indexes for each poverty indi- cator or index. In this study, the FGT indices are utilized to measure poverty rate (α = 0) that shows the frequency distribution of poor households and poverty gap (α = 1) that expresses the depth of poverty in rural Iran [65]: 1 1qi i zx FGT Pnz (6) where n and q are total and poor households respectively, z is the acceptable poverty line and xi is the owner level of ith household. Moreover, the association rules mining technique, one of the most important non supervisory data mining tech- niques, was used for extracting poverty patterns in the society. This technique discovers and extracts patterns related to the nature of poverty without providing any previous hypothesis on the extraction of patterns in the society. The advantage of using the association rules mining technique, in comparison to pattern making based on specified hypothesizes, is that it allows the extraction of significant and unpredictable patterns without any information about them [66]. The mining association rules technique identifies those features that engage together. Accordingly, the general form of an association rule is as Pov where X represents a set of characteristics of household and Pov represents the overall poverty situa- tion of household and show antecedent and consequent of rule, respectively [66-70]. The discovery of association rules needs some criteria to express certainty degrees of discovered rules. These criteria allow for the rules with high certainty are selected and presented from the set of possible rules. These criteria are the most commonly and applicable criteria to evaluate and assess the accuracy and valuable of the discovered rules. The support criterion expresses as probability and shows the amount of protection of rule based on the in- dividuals’ communication level. Simply, this criterion represents the proportion of individuals with a set of features (X) occurring with the expected poverty (Pov), simultaneously. Mathematical expression of this criterion is as follows [67,68,70]: Support PPXPov (7) in which PX Pov is the occurrence probability of the features sets X and Pov, simultaneously. Confidence criterion expresses the occurrence prob- ability of two or more features together. Thus, this crite- rion shows the degree of dependence between two fea- tures sets, X and Pov. This affiliation is calculated as follows [67,68,70]: Confidence PX Pov XPovPPov XPX (8) where PPovX represents the occurrence probability of poverty with respect to occurrence attribute set X, and PX represents the occurrence probability of features set X, regardless Pov. Other notations are defined previ- ously. The more the confidence criterion, the higher the validation of pattern discovery would be. Finally, lift rate criterion represents the ability level of pattern to provide the expected confidence. This criterion compares the pattern confidence with the expected con- fidence. The expected confidence is the confidence level Copyright © 2012 SciRes. OPEN ACCESS 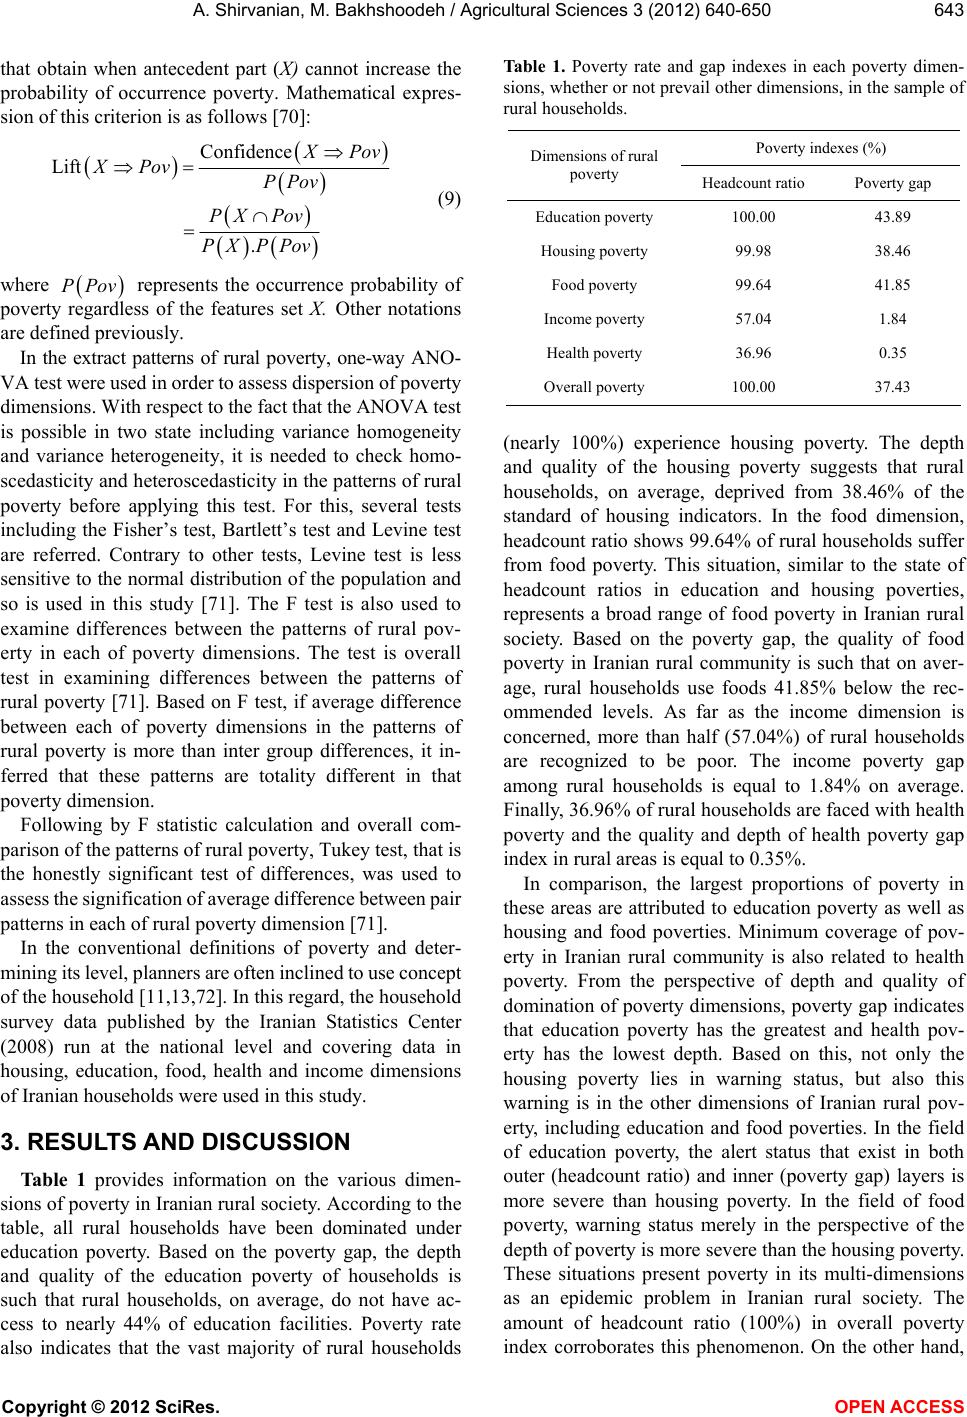 A. Shirvanian, M. Bakhshoodeh / Agricultural Sciences 3 (2012) 640-650 643 that obtain when antecedent part (X) cannot increase the probability of occurrence poverty. Mathematical expres- sion of this criterion is as follows [70]: Confi dence Lif t . Pov XPov PPov PX Pov PX PPov (9) where represents the occurrence probability of poverty regardless of the features set X. Other notations are defined previously. PPov In the extract patterns of rural poverty, one-way ANO- VA test were used in order to assess dispersion of poverty dimensions. With respect to the fact that the ANOVA test is possible in two state including variance homogeneity and variance heterogeneity, it is needed to check homo- scedasticity and heteroscedasticity in the patterns of rural poverty before applying this test. For this, several tests including the Fisher’s test, Bartlett’s test and Levine test are referred. Contrary to other tests, Levine test is less sensitive to the normal distribution of the population and so is used in this study [71]. The F test is also used to examine differences between the patterns of rural pov- erty in each of poverty dimensions. The test is overall test in examining differences between the patterns of rural poverty [71]. Based on F test, if average difference between each of poverty dimensions in the patterns of rural poverty is more than inter group differences, it in- ferred that these patterns are totality different in that poverty dimension. Following by F statistic calculation and overall com- parison of the patterns of rural poverty, Tukey test, that is the honestly significant test of differences, was used to assess the signification of average difference between pair patterns in each of rural poverty dimension [71]. In the conventional definitions of poverty and deter- mining its level, planners are often inclined to use concept of the household [11,13,72]. In this regard, the household survey data published by the Iranian Statistics Center (2008) run at the national level and covering data in housing, education, food, health and income dimensions of Iranian households were used in this study. 3. RESULTS AND DISCUSSION Table 1 provides information on the various dimen- sions of poverty in Iranian rural society. According to the table, all rural households have been dominated under education poverty. Based on the poverty gap, the depth and quality of the education poverty of households is such that rural households, on average, do not have ac- cess to nearly 44% of education facilities. Poverty rate also indicates that the vast majority of rural households Ta b le 1 . Poverty rate and gap indexes in each poverty dimen- sions, whether or not prevail other dimensions, in the sample of rural households. Poverty indexes (%) Dimensions of rural poverty Headcount ratio Poverty gap Education poverty 100.00 43.89 Housing poverty 99.98 38.46 Food poverty 99.64 41.85 Income poverty 57.04 1.84 Health poverty 36.96 0.35 Overall poverty 100.00 37.43 (nearly 100%) experience housing poverty. The depth and quality of the housing poverty suggests that rural households, on average, deprived from 38.46% of the standard of housing indicators. In the food dimension, headcount ratio shows 99.64% of rural households suffer from food poverty. This situation, similar to the state of headcount ratios in education and housing poverties, represents a broad range of food poverty in Iranian rural society. Based on the poverty gap, the quality of food poverty in Iranian rural community is such that on aver- age, rural households use foods 41.85% below the rec- ommended levels. As far as the income dimension is concerned, more than half (57.04%) of rural households are recognized to be poor. The income poverty gap among rural households is equal to 1.84% on average. Finally, 36.96% of rural households are faced with health poverty and the quality and depth of health poverty gap index in rural areas is equal to 0.35%. In comparison, the largest proportions of poverty in these areas are attributed to education poverty as well as housing and food poverties. Minimum coverage of pov- erty in Iranian rural community is also related to health poverty. From the perspective of depth and quality of domination of poverty dimensions, poverty gap indicates that education poverty has the greatest and health pov- erty has the lowest depth. Based on this, not only the housing poverty lies in warning status, but also this warning is in the other dimensions of Iranian rural pov- erty, including education and food poverties. In the field of education poverty, the alert status that exist in both outer (headcount ratio) and inner (poverty gap) layers is more severe than housing poverty. In the field of food poverty, warning status merely in the perspective of the depth of poverty is more severe than the housing poverty. These situations present poverty in its multi-dimensions as an epidemic problem in Iranian rural society. The amount of headcount ratio (100%) in overall poverty index corroborates this phenomenon. On the other hand, Copyright © 2012 SciRes. OPEN ACCESS 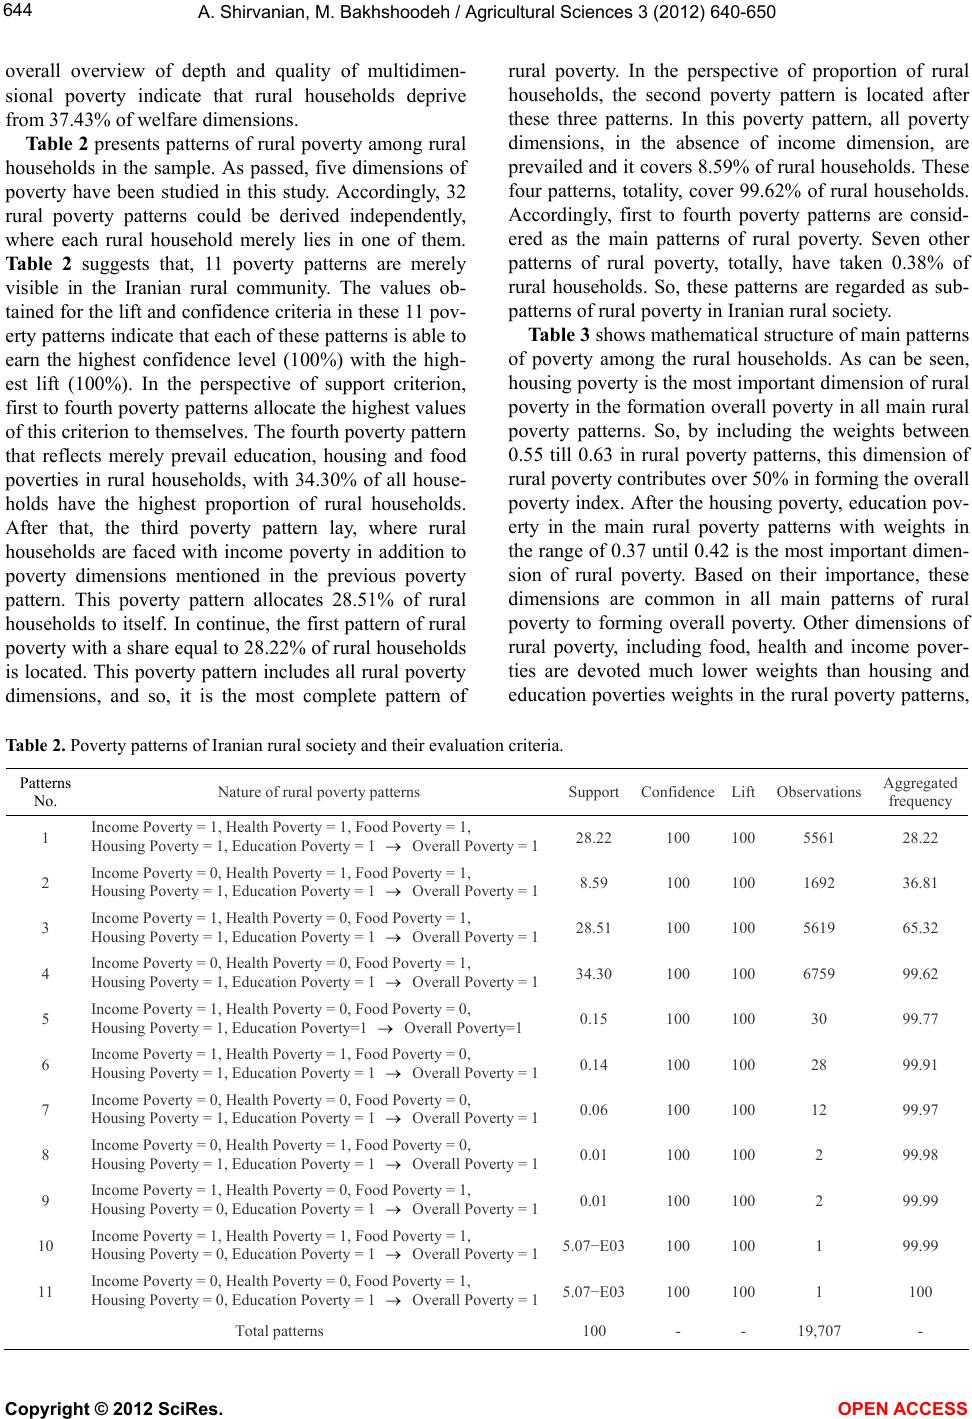 A. Shirvanian, M. Bakhshoodeh / Agricultural Sciences 3 (2012) 640-650 Copyright © 2012 SciRes. 644 overall overview of depth and quality of multidimen- sional poverty indicate that rural households deprive from 37.43% of welfare dimensions. Table 2 presents patterns of rural poverty among rural households in the sample. As passed, five dimensions of poverty have been studied in this study. Accordingly, 32 rural poverty patterns could be derived independently, where each rural household merely lies in one of them. Table 2 suggests that, 11 poverty patterns are merely visible in the Iranian rural community. The values ob- tained for the lift and confidence criteria in these 11 pov- erty patterns indicate that each of these patterns is able to earn the highest confidence level (100%) with the high- est lift (100%). In the perspective of support criterion, first to fourth poverty patterns allocate the highest values of this criterion to themselves. The fourth poverty pattern that reflects merely prevail education, housing and food poverties in rural households, with 34.30% of all house- holds have the highest proportion of rural households. After that, the third poverty pattern lay, where rural households are faced with income poverty in addition to poverty dimensions mentioned in the previous poverty pattern. This poverty pattern allocates 28.51% of rural households to itself. In continue, the first pattern of rural poverty with a share equal to 28.22% of rural households is located. This poverty pattern includes all rural poverty dimensions, and so, it is the most complete pattern of rural poverty. In the perspective of proportion of rural households, the second poverty pattern is located after these three patterns. In this poverty pattern, all poverty dimensions, in the absence of income dimension, are prevailed and it covers 8.59% of rural households. These four patterns, totality, cover 99.62% of rural households. Accordingly, first to fourth poverty patterns are consid- ered as the main patterns of rural poverty. Seven other patterns of rural poverty, totally, have taken 0.38% of rural households. So, these patterns are regarded as sub- patterns of rural poverty in Iranian rural society. Table 3 shows mathematical structure of main patterns of poverty among the rural households. As can be seen, housing poverty is the most important dimension of rural poverty in the formation overall poverty in all main rural poverty patterns. So, by including the weights between 0.55 till 0.63 in rural poverty patterns, this dimension of rural poverty contributes over 50% in forming the overall poverty index. After the housing poverty, education pov- erty in the main rural poverty patterns with weights in the range of 0.37 until 0.42 is the most important dimen- sion of rural poverty. Based on their importance, these dimensions are common in all main patterns of rural poverty to forming overall poverty. Other dimensions of rural poverty, including food, health and income pover- ties are devoted much lower weights than housing and education poverties weights in the rural poverty patterns, Table 2. Poverty patterns of Iranian rural society and their evaluation criteria. Patterns No. Nature of rural poverty patterns Support ConfidenceLift Observations Aggregated frequency 1 Income Poverty = 1, Health Poverty = 1, Food Poverty = 1, Housing Poverty = 1, Education Poverty = 1 Overall Poverty = 1 28.22 100 100 5561 28.22 2 Income Poverty = 0, Health Poverty = 1, Food Poverty = 1, Housing Poverty = 1, Education Poverty = 1 Overall Poverty = 1 8.59 100 100 1692 36.81 3 Income Poverty = 1, Health Poverty = 0, Food Poverty = 1, Housing Poverty = 1, Education Poverty = 1 Overall Poverty = 1 28.51 100 100 5619 65.32 4 Income Poverty = 0, Health Poverty = 0, Food Poverty = 1, Housing Poverty = 1, Education Poverty = 1 Overall Poverty = 1 34.30 100 100 6759 99.62 5 Income Poverty = 1, Health Poverty = 0, Food Poverty = 0, Housing Poverty = 1, Education Poverty=1 Overall Poverty=1 0.15 100 100 30 99.77 6 Income Poverty = 1, Health Poverty = 1, Food Poverty = 0, Housing Poverty = 1, Education Poverty = 1 Overall Poverty = 1 0.14 100 100 28 99.91 7 Income Poverty = 0, Health Poverty = 0, Food Poverty = 0, Housing Poverty = 1, Education Poverty = 1 Overall Poverty = 1 0.06 100 100 12 99.97 8 Income Poverty = 0, Health Poverty = 1, Food Poverty = 0, Housing Poverty = 1, Education Poverty = 1 Overall Poverty = 1 0.01 100 100 2 99.98 9 Income Poverty = 1, Health Poverty = 0, Food Poverty = 1, Housing Poverty = 0, Education Poverty = 1 Overall Poverty = 1 0.01 100 100 2 99.99 10 Income Poverty = 1, Health Poverty = 1, Food Poverty = 1, Housing Poverty = 0, Education Poverty = 1 Overall Poverty = 1 5.07−E03100 100 1 99.99 11 Income Poverty = 0, Health Poverty = 0, Food Poverty = 1, Housing Poverty = 0, Education Poverty = 1 Overall Poverty = 1 5.07−E03100 100 1 100 Total patterns 100 - - 19,707 - OPEN A CCESS 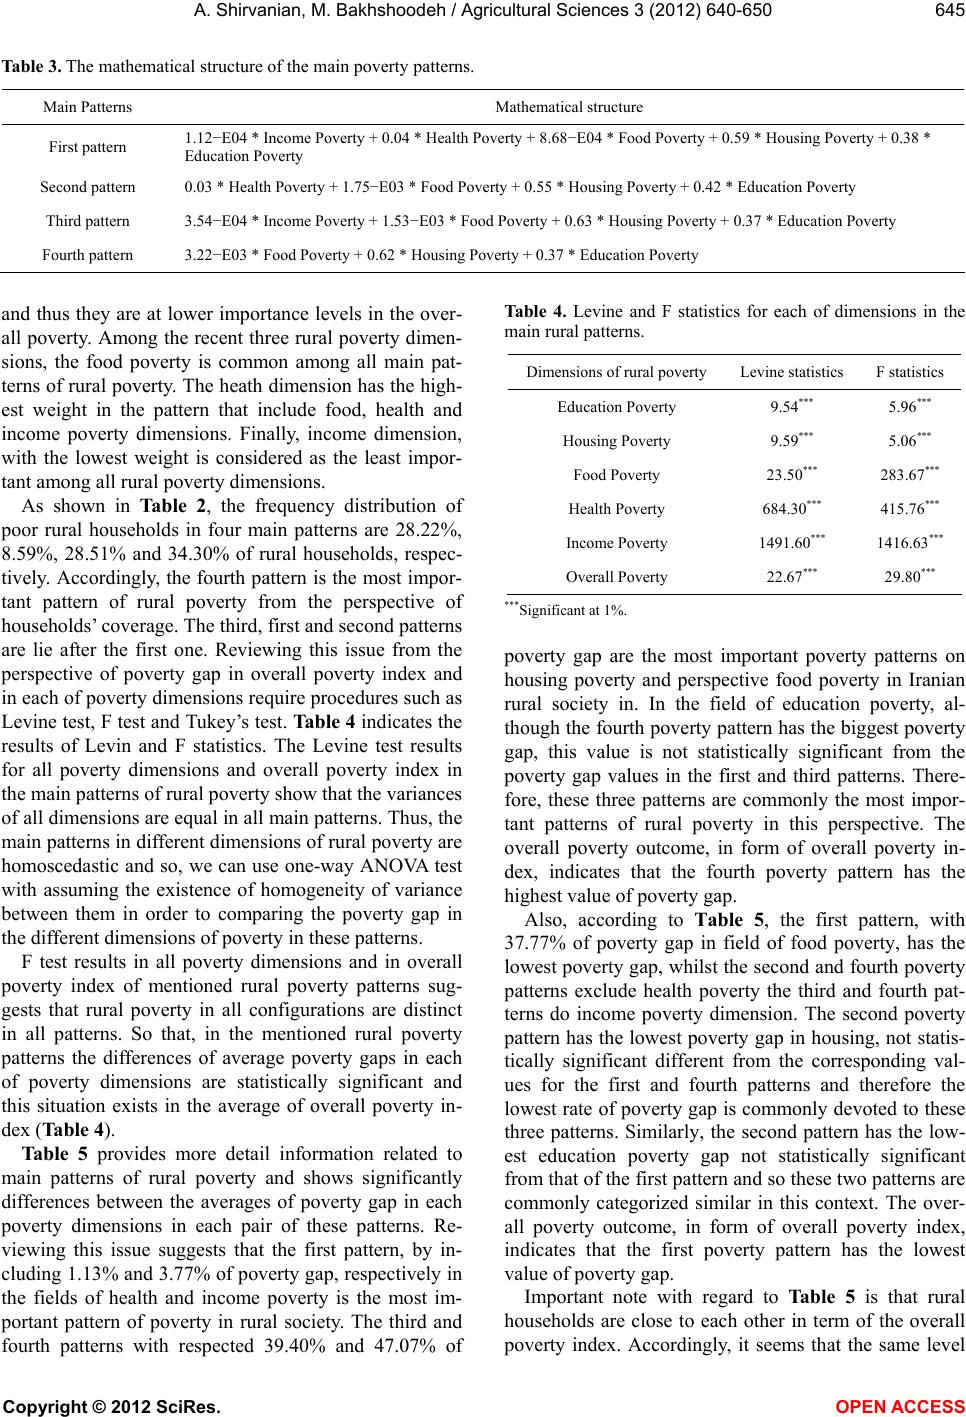 A. Shirvanian, M. Bakhshoodeh / Agricultural Sciences 3 (2012) 640-650 645 Table 3. The mathematical structure of the main poverty patterns. Main Patterns Mathematical structure First pattern 1.12−E04 * Income Poverty + 0.04 * Health Poverty + 8.68−E04 * Food Poverty + 0.59 * Housing Poverty + 0.38 * Education Poverty Second pattern 0.03 * Health Poverty + 1.75−E03 * Food Poverty + 0.55 * Housing Poverty + 0.42 * Education Poverty Third pattern 3.54−E04 * Income Poverty + 1.53−E03 * Food Poverty + 0.63 * Housing Poverty + 0.37 * Education Poverty Fourth pattern 3.22−E03 * Food Poverty + 0.62 * Housing Poverty + 0.37 * Education Poverty and thus they are at lower importance levels in the over- all poverty. Among the recent three rural poverty dimen- sions, the food poverty is common among all main pat- terns of rural poverty. The heath dimension has the high- est weight in the pattern that include food, health and income poverty dimensions. Finally, income dimension, with the lowest weight is considered as the least impor- tant among all rural poverty dimensions. As shown in Table 2, the frequency distribution of poor rural households in four main patterns are 28.22%, 8.59%, 28.51% and 34.30% of rural households, respec- tively. Accordingly, the fourth pattern is the most impor- tant pattern of rural poverty from the perspective of households’ coverage. The third, first and second patterns are lie after the first one. Reviewing this issue from the perspective of poverty gap in overall poverty index and in each of poverty dimensions require procedures such as Levine test, F test and Tukey’s test. Table 4 indicates the results of Levin and F statistics. The Levine test results for all poverty dimensions and overall poverty index in the main patterns of rural poverty show that the variances of all dimensions are equal in all main patterns. Thus, the main patterns in different dimensions of rural poverty are homoscedastic and so, we can use one-way ANOVA test with assuming the existence of homogeneity of variance between them in order to comparing the poverty gap in the different dimensions of poverty in these patterns. F test results in all poverty dimensions and in overall poverty index of mentioned rural poverty patterns sug- gests that rural poverty in all configurations are distinct in all patterns. So that, in the mentioned rural poverty patterns the differences of average poverty gaps in each of poverty dimensions are statistically significant and this situation exists in the average of overall poverty in- dex (Table 4). Table 5 provides more detail information related to main patterns of rural poverty and shows significantly differences between the averages of poverty gap in each poverty dimensions in each pair of these patterns. Re- viewing this issue suggests that the first pattern, by in- cluding 1.13% and 3.77% of poverty gap, respectively in the fields of health and income poverty is the most im- portant pattern of poverty in rural society. The third and fourth patterns with respected 39.40% and 47.07% of Ta bl e 4. Levine and F statistics for each of dimensions in the main rural patterns. Dimensions of rural poverty Levine statistics F statistics Education Poverty 9.54*** 5.96*** Housing Poverty 9.59*** 5.06*** Food Poverty 23.50*** 283.67*** Health Poverty 684.30*** 415.76*** Income Poverty 1491.60*** 1416.63*** Overall Poverty 22.67*** 29.80*** ***Significant at 1%. poverty gap are the most important poverty patterns on housing poverty and perspective food poverty in Iranian rural society in. In the field of education poverty, al- though the fourth poverty pattern has the biggest poverty gap, this value is not statistically significant from the poverty gap values in the first and third patterns. There- fore, these three patterns are commonly the most impor- tant patterns of rural poverty in this perspective. The overall poverty outcome, in form of overall poverty in- dex, indicates that the fourth poverty pattern has the highest value of poverty gap. Also, according to Table 5, the first pattern, with 37.77% of poverty gap in field of food poverty, has the lowest poverty gap, whilst the second and fourth poverty patterns exclude health poverty the third and fourth pat- terns do income poverty dimension. The second poverty pattern has the lowest poverty gap in housing, not statis- tically significant different from the corresponding val- ues for the first and fourth patterns and therefore the lowest rate of poverty gap is commonly devoted to these three patterns. Similarly, the second pattern has the low- est education poverty gap not statistically significant from that of the first pattern and so these two patterns are commonly categorized similar in this context. The over- all poverty outcome, in form of overall poverty index, indicates that the first poverty pattern has the lowest value of poverty gap. Important note with regard to Table 5 is that rural households are close to each other in term of the overall poerty index. Accordingly, it seems that the same level v Copyright © 2012 SciRes. OPEN ACCESS  A. Shirvanian, M. Bakhshoodeh / Agricultural Sciences 3 (2012) 640-650 646 Table 5. Average poverty gap in dimensions of main rural poverty patterns and its comparisons. Dimensions of rural poverty The main patterns of rural poverty Education poverty Housing povertyFoods povertyHealth povertyIncome poverty Overall poverty First pattern 43.91ab 38.46a 37.77a 1.13a 3.77a 39.18a Second pattern 43.69a 38.02a 38.95b 0b 2.64b 40.10b Third pattern 43.95b 39.40b 45.83c 0.36c 0c 40.03b Fourth pattern 44.03b 38.65a 47.07d 0b 0c 40.69c Note: In each column, common letters indicate no significant difference and non-shared letters indicate significant differences in the level of 10%. of facilities and resources are needed and the same pro- grams should be developed to combat poverty. But what lies behind this similarity suggests existence of different structures of poverty in the rural society, despite the similarity in the overall index of poverty. So, combating rural poverty requires different plans and different facili- ties and resources that cannot be provided merely by government income support. 4. CONSEQUENCE OF USING MERELY INCOME POVERTY IN IDENTIFICATION OF POOR HOUSEHOLDS As previously revealed in Table 1, nearly 57% of rural households suffer from income poverty and the rest of them (43%) are free of it. According to enforcement process of targeting subsidies law in Iran, determining the poor and vulnerable households who need govern- ment support, is based on household per capita income. Thus, 43% of rural households who do not suffer from income poverty cannot receive the government support program. Table 6 provides information regarding the number and frequency of rural households who do not suffer from income poverty, but suffer from poverty in other dimensions. According to this table, all households that are free of income poverty suffer from education poverty. The vast majority of these households also suf- fer from food and housing poverties. In addition, about 20% of such households suffer from health poverty. Re- viewing these cases at all households in the sample are also noteworthy. According to the third column of Table 6, despite the lack of income poverty, 42.96%, 42.95%, 42.89% and 8.60% of all rural households suffer from education, housing, food and health poverties, respec- tively. So, it can be deduced that in Iranian rural society, not only households with income poverty need to be supported but also the vast majority of households with- out income poverty, need assistance and support to deal with education, housing, food and health poverties. If the support in the targeting subsidy scheme confine to households with income poverty, the mentioned groups of rural households will be ignored. Thus, income sup- port in targeting subsidies program is not in favor of these groups of poor rural households and does not lead them to exit from poverty. Reviewing this issue in the patterns of rural poverty is also considerable. According to Table 2, among the 11 patterns obtained for Iranian rural poverty, income pov- erty along with other poverty dimensions govern in six patterns. The rest of patterns are free of income poverty but prevail the other dimensions of poverty. With respect to that in enforcement the law of targeting subsidies, support of families developed based on their income level and in the early years of its implementation, sup- port packages of targeting subsidies program is merely income. Therefore, enforcing the law of targeting subsi- dies will be last different effects on the mentioned pat- terns. Thus, Income support to poor households does not effect on income poverty in five poverty patterns that cover 42.96% of rural poor households, and merely af- fect on this dimension in six patterns that cover 57.04% of them (Table 2). 5. CONCLUSIONS AND RECOMMENDATIONS The finding showed that education poverty in perspec- tive headcount ratio, among the various dimensions of poverty in Iranian rural society, is the vastest and then with small differences housing and food poverties are located. Minimum coverage of poverty in Iranian rural society is also related to health poverty. From perspective of depth and quality of different poverty dimensions those dominated on rural society, the greatest and least depth of poverty are devoted to education and health poverties, respectively. Accordingly, not only the condi- tion of housing poverty in Iranian rural society, similar to the situation of housing poverty in developing countries [31,32], is on alert status, but also this warning status are in the other dimensions of rural poverty, including edu- cation and food poverties. In the field of education pov- erty, alert state in the term of level and depth are much severer than housing poverty. In the food poverty field, alert status merely in the perspective of the depth of Copyright © 2012 SciRes. OPEN ACCESS 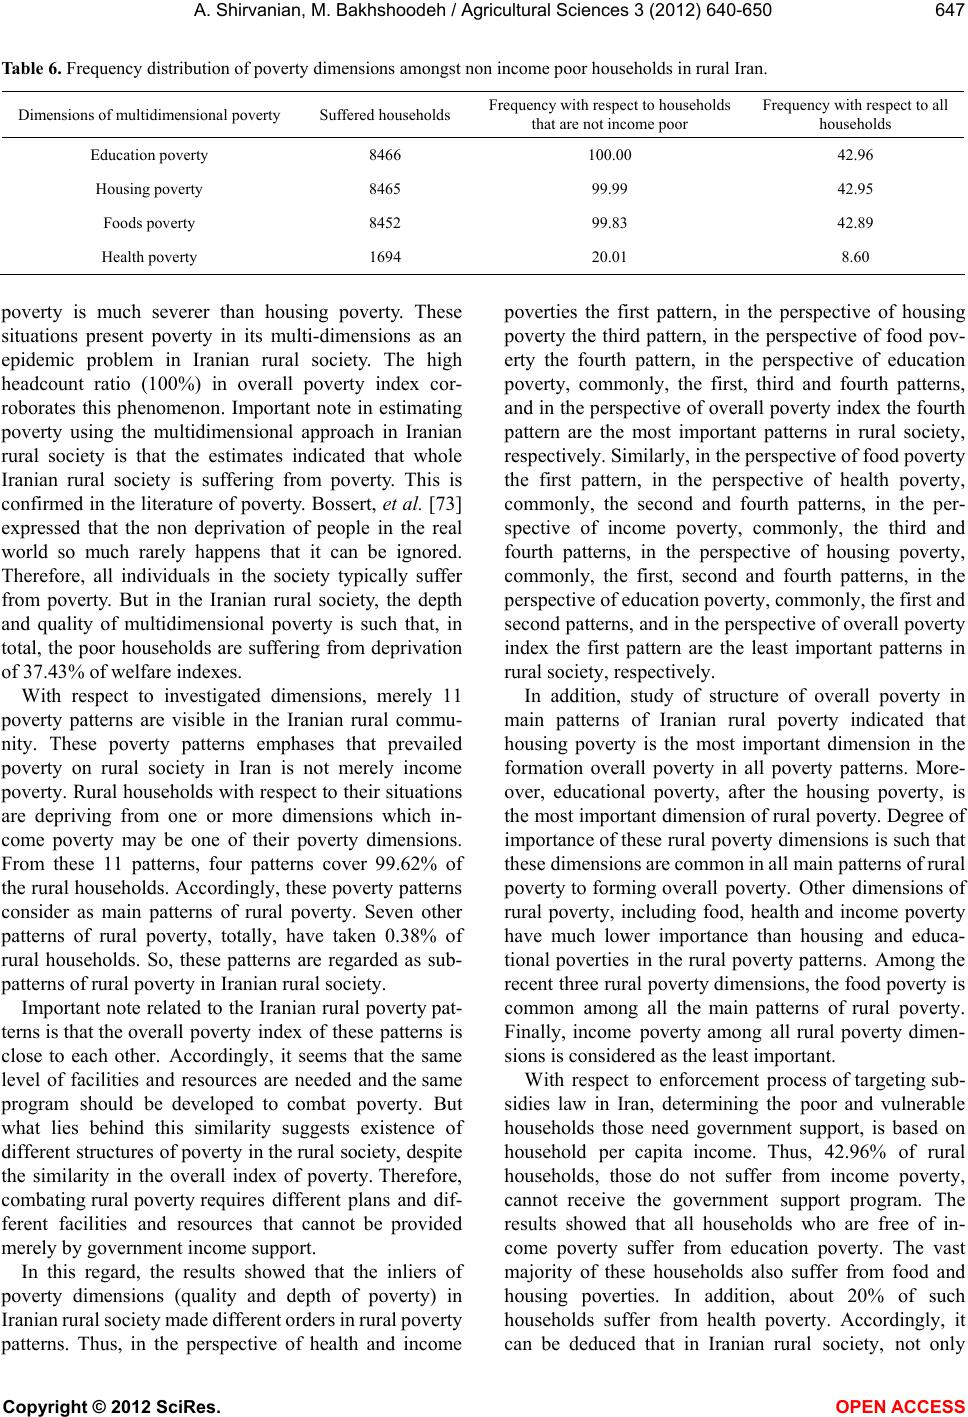 A. Shirvanian, M. Bakhshoodeh / Agricultural Sciences 3 (2012) 640-650 647 Table 6. Frequency distribution of poverty dimensions amongst non income poor households in rural Iran. Dimensions of multidimensional poverty Suffered households Frequency with respect to households that are not income poor Frequency with respect to all households Education poverty 8466 100.00 42.96 Housing poverty 8465 99.99 42.95 Foods poverty 8452 99.83 42.89 Health poverty 1694 20.01 8.60 poverty is much severer than housing poverty. These situations present poverty in its multi-dimensions as an epidemic problem in Iranian rural society. The high headcount ratio (100%) in overall poverty index cor- roborates this phenomenon. Important note in estimating poverty using the multidimensional approach in Iranian rural society is that the estimates indicated that whole Iranian rural society is suffering from poverty. This is confirmed in the literature of poverty. Bossert, et al. [73] expressed that the non deprivation of people in the real world so much rarely happens that it can be ignored. Therefore, all individuals in the society typically suffer from poverty. But in the Iranian rural society, the depth and quality of multidimensional poverty is such that, in total, the poor households are suffering from deprivation of 37.43% of welfare indexes. With respect to investigated dimensions, merely 11 poverty patterns are visible in the Iranian rural commu- nity. These poverty patterns emphases that prevailed poverty on rural society in Iran is not merely income poverty. Rural households with respect to their situations are depriving from one or more dimensions which in- come poverty may be one of their poverty dimensions. From these 11 patterns, four patterns cover 99.62% of the rural households. Accordingly, these poverty patterns consider as main patterns of rural poverty. Seven other patterns of rural poverty, totally, have taken 0.38% of rural households. So, these patterns are regarded as sub- patterns of rural poverty in Iranian rural society. Important note related to the Iranian rural poverty pat- terns is that the overall poverty index of these patterns is close to each other. Accordingly, it seems that the same level of facilities and resources are needed and the same program should be developed to combat poverty. But what lies behind this similarity suggests existence of different structures of poverty in the rural society, despite the similarity in the overall index of poverty. Therefore, combating rural poverty requires different plans and dif- ferent facilities and resources that cannot be provided merely by government income support. In this regard, the results showed that the inliers of poverty dimensions (quality and depth of poverty) in Iranian rural society made different orders in rural poverty patterns. Thus, in the perspective of health and income poverties the first pattern, in the perspective of housing poverty the third pattern, in the perspective of food pov- erty the fourth pattern, in the perspective of education poverty, commonly, the first, third and fourth patterns, and in the perspective of overall poverty index the fourth pattern are the most important patterns in rural society, respectively. Similarly, in the perspective of food poverty the first pattern, in the perspective of health poverty, commonly, the second and fourth patterns, in the per- spective of income poverty, commonly, the third and fourth patterns, in the perspective of housing poverty, commonly, the first, second and fourth patterns, in the perspective of education poverty, commonly, the first and second patterns, and in the perspective of overall poverty index the first pattern are the least important patterns in rural society, respectively. In addition, study of structure of overall poverty in main patterns of Iranian rural poverty indicated that housing poverty is the most important dimension in the formation overall poverty in all poverty patterns. More- over, educational poverty, after the housing poverty, is the most important dimension of rural poverty. Degree of importance of these rural poverty dimensions is such that these dimensions are common in all main patterns of rural poverty to forming overall poverty. Other dimensions of rural poverty, including food, health and income poverty have much lower importance than housing and educa- tional poverties in the rural poverty patterns. Among the recent three rural poverty dimensions, the food poverty is common among all the main patterns of rural poverty. Finally, income poverty among all rural poverty dimen- sions is considered as the least important. With respect to enforcement process of targeting sub- sidies law in Iran, determining the poor and vulnerable households those need government support, is based on household per capita income. Thus, 42.96% of rural households, those do not suffer from income poverty, cannot receive the government support program. The results showed that all households who are free of in- come poverty suffer from education poverty. The vast majority of these households also suffer from food and housing poverties. In addition, about 20% of such households suffer from health poverty. Accordingly, it can be deduced that in Iranian rural society, not only Copyright © 2012 SciRes. OPEN ACCESS 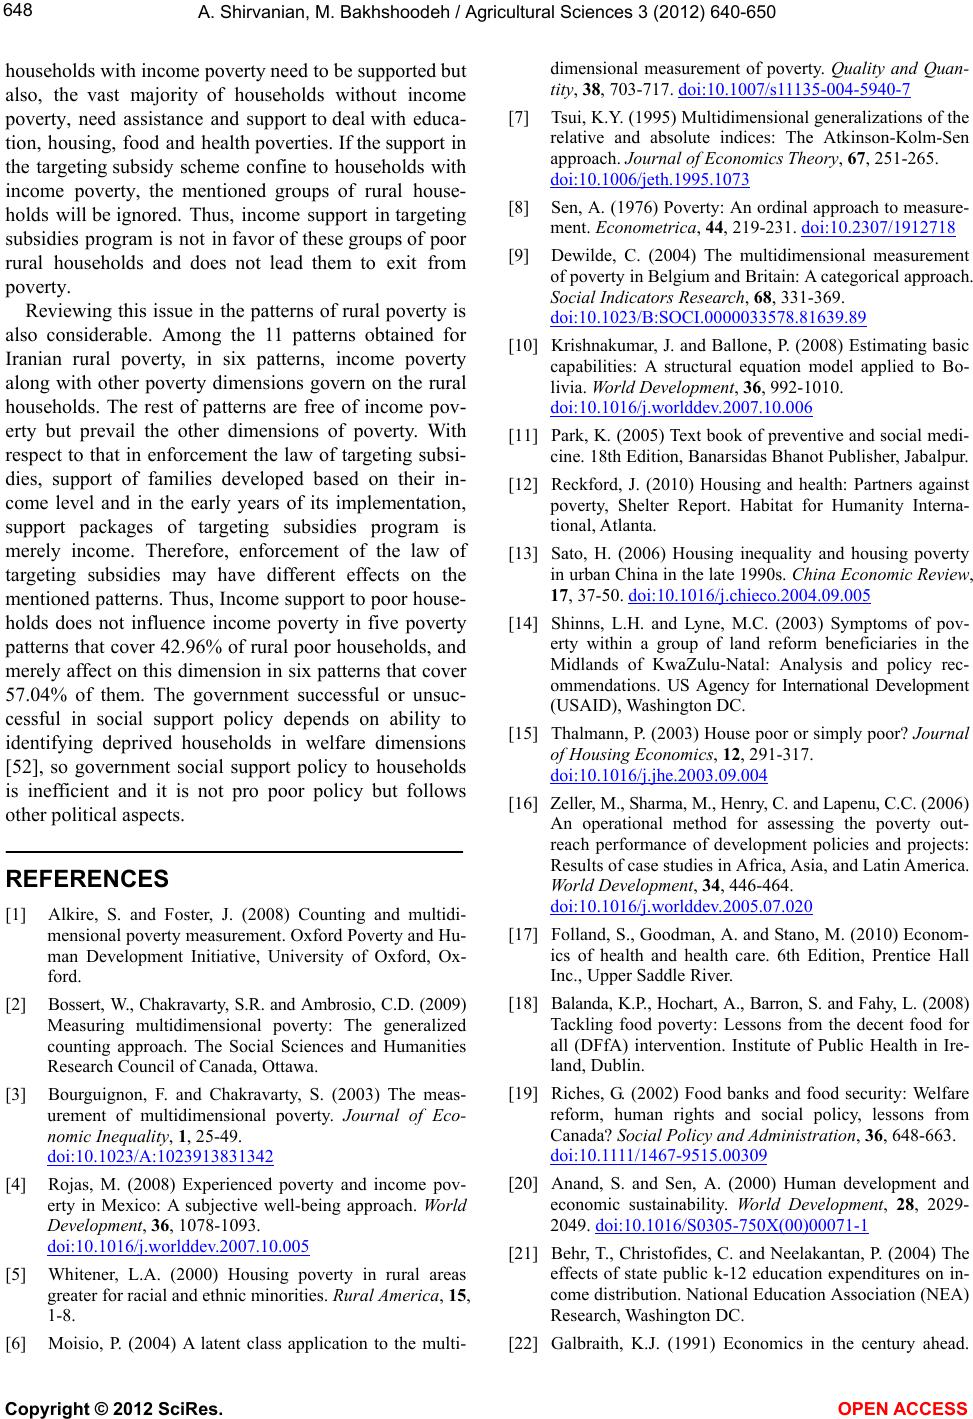 A. Shirvanian, M. Bakhshoodeh / Agricultural Sciences 3 (2012) 640-650 648 households with income poverty need to be supported but also, the vast majority of households without income poverty, need assistance and support to deal with educa- tion, housing, food and health poverties. If the support in the targeting subsidy scheme confine to households with income poverty, the mentioned groups of rural house- holds will be ignored. Thus, income support in targeting subsidies program is not in favor of these groups of poor rural households and does not lead them to exit from poverty. Reviewing this issue in the patterns of rural poverty is also considerable. Among the 11 patterns obtained for Iranian rural poverty, in six patterns, income poverty along with other poverty dimensions govern on the rural households. The rest of patterns are free of income pov- erty but prevail the other dimensions of poverty. With respect to that in enforcement the law of targeting subsi- dies, support of families developed based on their in- come level and in the early years of its implementation, support packages of targeting subsidies program is merely income. Therefore, enforcement of the law of targeting subsidies may have different effects on the mentioned patterns. Thus, Income support to poor house- holds does not influence income poverty in five poverty patterns that cover 42.96% of rural poor households, and merely affect on this dimension in six patterns that cover 57.04% of them. The government successful or unsuc- cessful in social support policy depends on ability to identifying deprived households in welfare dimensions [52], so government social support policy to households is inefficient and it is not pro poor policy but follows other political aspects. REFERENCES [1] Alkire, S. and Foster, J. (2008) Counting and multidi- mensional poverty measurement. Oxford Poverty and Hu- man Development Initiative, University of Oxford, Ox- ford. [2] Bossert, W., Chakravarty, S.R. and Ambrosio, C.D. (2009) Measuring multidimensional poverty: The generalized counting approach. The Social Sciences and Humanities Research Council of Canada, Ottawa. [3] Bourguignon, F. and Chakravarty, S. (2003) The meas- urement of multidimensional poverty. Journal of Eco- nomic Inequality, 1, 25-49. doi:10.1023/A:1023913831342 [4] Rojas, M. (2008) Experienced poverty and income pov- erty in Mexico: A subjective well-being approach. World Development, 36, 1078-1093. doi:10.1016/j.worlddev.2007.10.005 [5] Whitener, L.A. (2000) Housing poverty in rural areas greater for racial and ethnic minorities. Rural America, 15, 1-8. [6] Moisio, P. (2004) A latent class application to the multi- dimensional measurement of poverty. Quality and Quan- tity, 38, 703-717. doi:10.1007/s11135-004-5940-7 [7] Tsui, K.Y. (1995) Multidimensional generalizations of the relative and absolute indices: The Atkinson-Kolm-Sen approach. Journal of Economics Theory, 67, 251-265. doi:10.1006/jeth.1995.1073 [8] Sen, A. (1976) Poverty: An ordinal approach to measure- ment. Econometrica, 44, 219-231. doi:10.2307/1912718 [9] Dewilde, C. (2004) The multidimensional measurement of poverty in Belgium and Britain: A categorical approach. Social Indicators Research, 68, 331-369. doi:10.1023/B:SOCI.0000033578.81639.89 [10] Krishnakumar, J. and Ballone, P. (2008) Estimating basic capabilities: A structural equation model applied to Bo- livia. World Development, 36, 992-1010. doi:10.1016/j.worlddev.2007.10.006 [11] Park, K. (2005) Text book of preventive and social medi- cine. 18th Edition, Banarsidas Bhanot Publisher, Jabalpur. [12] Reckford, J. (2010) Housing and health: Partners against poverty, Shelter Report. Habitat for Humanity Interna- tional, Atlanta. [13] Sato, H. (2006) Housing inequality and housing poverty in urban China in the late 1990s. China Economic Review, 17, 37-50. doi:10.1016/j.chieco.2004.09.005 [14] Shinns, L.H. and Lyne, M.C. (2003) Symptoms of pov- erty within a group of land reform beneficiaries in the Midlands of KwaZulu-Natal: Analysis and policy rec- ommendations. US Agency for International Development (USAID), Washington DC. [15] Thalmann, P. (2003) House poor or simply poor? Journal of Housing Economics, 12, 291-317. doi:10.1016/j.jhe.2003.09.004 [16] Zeller, M., Sharma, M., Henry, C. and Lapenu, C.C. (2006) An operational method for assessing the poverty out- reach performance of development policies and projects: Results of case studies in Africa, Asia, and Latin America. World Development, 34, 446-464. doi:10.1016/j.worlddev.2005.07.020 [17] Folland, S., Goodman, A. and Stano, M. (2010) Econom- ics of health and health care. 6th Edition, Prentice Hall Inc., Upper Saddle River. [18] Balanda, K.P., Hochart, A., Barron, S. and Fahy, L. (2008) Tackling food poverty: Lessons from the decent food for all (DFfA) intervention. Institute of Public Health in Ire- land, Dublin. [19] Riches, G. (2002) Food banks and food security: Welfare reform, human rights and social policy, lessons from Canada? Social Policy and Administration, 36, 648-663. doi:10.1111/1467-9515.00309 [20] Anand, S. and Sen, A. (2000) Human development and economic sustainability. World Development, 28, 2029- 2049. doi:10.1016/S0305-750X(00)00071-1 [21] Behr, T., Christofides, C. and Neelakantan, P. (2004) The effects of state public k-12 education expenditures on in- come distribution. National Education Association (NEA) Research, Washington DC. [22] Galbraith, K.J. (1991) Economics in the century ahead. Copyright © 2012 SciRes. OPEN ACCESS  A. Shirvanian, M. Bakhshoodeh / Agricultural Sciences 3 (2012) 640-650 649 The Economic Journal, 101, 41-46. doi:10.2307/2233835 [23] Psacharopoulos, G. and Woodhall, M. (1985) Education for development: An analysis of investment choices. Ox- ford University Press, Oxford. [24] Nordtveit, B.H. (2008) Poverty alleviation and integrated service delivery: Literacy, early child development and health. International Journal of Educational Develop- ment, 28, 405-418. doi:10.1016/j.ijedudev.2007.10.004 [25] Tilak, J.B.G. (2007) Post-elementary education, poverty and development in India. International Journal of Edu- cational Development, 27, 435-445. doi:10.1016/j.ijedudev.2006.09.018 [26] Rojas, M. (2006) Life satisfaction and satisfaction in domains of life: Is it a simple relationship? Journal of Happiness Studies, 7, 467-497. doi:10.1007/s10902-006-9009-2 [27] Rojas, M. (2006) Well-being and the complexity of pov- erty: A subjective well-being approach. In: McGillivray, M. and Clarke, M., Eds., Understanding Human Well-Be- ing, United Nations University Press, Tokyo, 182-206. [28] Rojas, M. (2007) The complexity of well-being: A life satisfaction conception and a domains-of-life approach. In: Gough, I. and McGregor, A., Eds., Wellbeing in De- veloping Countries: From Theory to Research, Cambridge University Press, Cambridge, 242-258. [29] Van-Praag, B.M.S., Frijters, P. and Ferrer-i-Carbonell, A. (2003) The anatomy of subjective well-being. Journal of Economic Behavior and Organization, 51, 29-49. doi:10.1016/S0167-2681(02)00140-3 [30] Dixon, C. (1990) Rural development in the third world. Routledge Chapman and Hall Inc., Cambridge. [31] Miltin, D. (2001) Housing and urban poverty: A consid- eration of the criteria of affordability, diversity and inclu- sion. Housing Studies, 16, 509-522. doi:10.1080/02673030120066572 [32] Sengupta, U. (2010) The hindered self-help: Housing po- licies, politics and poverty in Kolkata, India. Habitat In- ternational, 34, 323-331. doi:10.1016/j.habitatint.2009.11.009 [33] Antony, G.M. and Rao, K.V. (2007) A composite index to explain variations in poverty, health, nutritional status and standard of living: Use of multivariate statistical methods. Public Health, 121, 578-587. doi:10.1016/j.puhe.2006.10.018 [34] Nassiri, M. (2007) Geographic distribution of housing poverty and scattering householder divorced women in 22 regions of Tehran. Journal of Social Welfare, 24, 240-223. [35] Babai, N. (2003) Social policy and health. Journal of Social Welfare, 10, 201-232. [36] Ministry of Health and Medical Education (2004) Na- tional document of health sector development on the forth economic, social and cultural program. Deputy of har- mony and community, Ministry of Health and Medical Education, Tehran. [37] Endocrine and Metabolism Research Center (2001) Pre- liminary results in goiter prevalence in Iran provinces. Martyr Beheshti University of Medical Sciences, Tehran. [38] Kimiagar, M. and Badjan, M. (2005) Poverty and malnu- trition in Iran. Journal of Social Welfare, 18, 112-191. [39] Alkire, S. (2007) Choosing dimensions: The capability approach and multidimensional poverty. Department of International Development, Chronic Poverty Research Centre, University of Oxford, Oxford. [40] Ravallion, M. (1992) Poverty comparisons: A guide to concepts and methods. The World Bank, Washington DC. [41] Alexopoulos, Y., Hebberd, K. and Bays, H. (2008) Krause’s food and nutrition therapy. 12th Edition, Elsevier Inc., Amsterdam. [42] The Health Canada Web Site (2010) Canada’s food guide, Farsi Version. http://www.hc-sc.gc.ca/fn-an/food-guide-aliment/index-e ng.php [43] Fasco, A. (2003) On the definition and measurement of poverty: The contribution of multidimensional analysis. Proceedings of the 3rd Conference on the Capability Ap- proach: From Sustainable Development to Sustainable Freedom, Pavia, 7-9 Septamber 2003, 1-39. [44] Saisana, M. and Saltelli, A. (2010) The multidimensional poverty assessment tool (MPAT): Robustness issues and critical assessment. European Commission and Institute for the Protection and Security of the Citizen, Ispra. [45] Veenstra, N. (2006) Social protection in a context of HIV/ AIDS: A closer look at South Africa. Social Dynamics, 32, 111-135. doi:10.1080/02533950608628729 [46] Doorslaer, E.V., O’Donnell, O., Rannan-Eliya, R.P., So- manathan, A., Adhikari, S.R., Garg, C.C., Harbianto, D., Herrin, A.N., Nazmul-Huq, M., Ibragimova, S., Karan, A., Wan-Ng, C., Pande, B.R., Racelis, R., Tao, S., Tin, K., Tisayaticom, K., Trisnantoro, L., Vasavid, C. and Zhao, Y. (2006) Effect of payments for health care on poverty es- timates in 11 countries in Asia: An analysis of household survey data. Lancet, 368, 1357-1364. doi:10.1016/S0140-6736(06)69560-3 [47] Russell, S. (1996) Ability to pay for health care: Concepts and evidence. Health Policy and Planning, 11 , 219-237. doi:10.1093/heapol/11.3.219 [48] UNESCO Institute for Statistics (2008) List of potential international indicators for information supply, access and supporting skills. UNESCO, Paris. [49] UNESCO (2005) Education for all, literacy for life. United Nations Educational, Scientific and Cultural Or- ganization (UNESCO), Paris. [50] UNESCO (2010) Glossary. http://www.uis.unesco.org/glossary [51] Henry, C., Sharma, M., Lapenu, C. and Zeller, M. (2003) Microfinance poverty assessment tool. Consultative Group to Assist the Poor (CGAP) and the World Bank, Washing- ton DC. [52] Naveed, A. and Ul-Islam, T. (2010) Estimating multidi- mensional poverty and identifying the poor in Pakistan: A alternative approach. Research Consortium on Educa- tional Outcomes and Poverty (RECOUP), Cambridge. [53] Saunders, P. (1997) Living standards, choice and poverty. Australian Journal of Labour Economics, 1, 49-70. Copyright © 2012 SciRes. OPEN ACCESS  A. Shirvanian, M. Bakhshoodeh / Agricultural Sciences 3 (2012) 640-650 Copyright © 2012 SciRes. OPEN ACCESS 650 [54] Saunders, P. and Hill, T. (2008) A consistent poverty ap- proach to assessing the sensitivity of income poverty measures and trends. The Australian Economic Review, 41, 371-388. doi:10.1111/j.1467-8462.2008.00521.x [55] Saunders, P., Hill, T. and Bradbury, B. (2007) Poverty in Australia sensitivity analysis and recent trends. Social Policy Research Centre, University of New South Wales, Kensington. [56] Schubert, R. (1994) Poverty in developing countries: Its definition, extent and implications. Economics, 49-50, 17- 40. [57] Smith, P. (1996) Measuring outcome in the public sector. Taylor and Francis Ltd., London. [58] Grootaert, C. and Narayan, D. (2004) Local institutions, poverty and household welfare in Bolivia. World Devel- opment, 32, 1179-1198. doi:10.1016/j.worlddev.2004.02.001 [59] Okunmadewa, F.Y., Yusuf, S.A. and Omonona, B.T. (2007) Effects of social capital on rural poverty in Nige- ria. Pakistan Journal of Social Sciences, 4, 331-339. [60] Muro, P.D., Mazziotta, M. and Pareto, A. (2009) Com- posite indices for multidimensional development and poverty: An application to MDG indicators. University of Roma Tra, Rome. [61] Deutsch, J. and Silber, J. (2005) Measuring multidimen- sional poverty: An empirical comparison of various ap- proaches. Review of Income and Wealth, 51, 145-174. doi:10.1111/j.1475-4991.2005.00148.x [62] Shannon, C.E. (1948) The mathematical theory of com- munication. The Bell System Technical Journal, 27, 379- 423, 623-656. [63] Tsui, K.Y. (1999) Multidimensional inequality and multi- dimensional generalized entropy measures: An axiomatic derivation. Social Choice and Welfare, 16, 145-157. doi:10.1007/s003550050136 [64] Zhi-Hong, Z., Yi, Y. and Jing-Nan, S. (2006) Entropy method for determination of weight indicators in fuzzy synthetic evaluation for water quality assessment. Journal of Environmental Science, 18, 1020-1023. doi:10.1016/S1001-0742(06)60032-6 [65] Foster, J., Greer, J. and Thorbecke, E. (2010) The Fos- ter-Greer-Thorbecke (FGT) poverty measures: 25 years later. Journal of Economic Inequality, 8, 491-524. doi:10.1007/s10888-010-9136-1 [66] Han, J. and Kamber, M. (2006) Data mining: Concepts and techniques. 2nd Edition, Morgan Kaufmann Publish- ers, San Francisco. [67] Margahny, M.H. and Mitwaly, A.A. (2005) Fast algo- rithm for mining association rules. Proceedings of the Ar- tificial Intelligence and Machine Learning 05 Conference, Cairo, 19-21 December 2005, 19-21. [68] Olson, D.L. and Delen, D. (2008) Advanced data mining techniques. Springer, New York. [69] Russell, G.J. and Petersen, A. (2000) Analysis of cross category dependence in market basket selection. Journal of Retailing, 78, 367-392. doi:10.1016/S0022-4359(00)00030-0 [70] Thakur, M., Olafsson, S., Lee, J.S. and Hurburgh, C.R. (2010) Data mining for recognizing patterns in foodborne disease outbreaks. Journal of Food Engineering, 97, 213- 227. doi:10.1016/j.jfoodeng.2009.10.012 [71] Freund, R.J., Mohr, D.L. and Wilson, W.J. (2010) Statis- tical methods. 3th Edition, Elsevier Inc., Amsterdam. [72] Silber, J. (2007) Measuring poverty: Taking a multidi- mensional perspective. Hacienda Publica Espanola/Revis- ta de Economia Publica, 182, 29-73. [73] Bossert, W., Ambrosio, C.D. and Peragine, V. (2007) Deprivation and social exclusion. Econonica, 74, 777-803. doi:10.1111/j.1468-0335.2006.00572.x
|