 Advances in Remote Sensing, 2012, 1, 35-51 http://dx.doi.org/10.4236/ars.2012.12004 Published Online September 2012 (http://www.SciRP.org/journal/ars) 35 An Algorithm for Classification of Algal Blooms Using MODIS-Aqua Data in Oceanic Waters around India Arthi Simon, Palanisamy Shanmugam* Department of Ocean Engineering, Indian Institute of Technology Madras, Chennai, India Email: *pshanmugam@iitm.ac.in Received July 15, 2012; revised August 22, 2012; accepted September 11, 2012 ABSTRACT Increasing incidences and severity of algal blooms are of major concern in coastal waters around India. In this work an automatic algorithm has been developed and applied to a series of MODIS-Aqua ocean color data to classify and moni- tor four major algal blooms in these waters (i.e., Trichodesmium erythareum, Noctiluca scintillans/miliaris (green/brown), and Cochlodinium polykrikoides (red)). The algorithm is based on unique spectral signatures of these blooms previously re- ported by various field sampling programs. An examination of the algorithm results revealed that classified blooms agree very well with in-situ data in most oceanic waters around India. Accuracy assessment based on overall, user’s and producer’s accuracy and Kappa accuracy further revealed that the producer’s/user’s accuracy of the four algal blooms were 100%/100%, 79.16%/79.16%, 100%/80%, 100%/86.95%, respectively. The Kappa coefficient was 1.01. These results suggest that the new algorithm has the potential to classify and monitor these major algal blooms and such in- formation is highly desired by fishermen, fish farmers and public health officials in this region. It should be noted that coefficients with the new algorithm may be fine-tuned based on more in-situ data sets and the optical properties of these algal blooms in oceanic waters around India. Keywords: Algal Blooms; Arabian Sea; MODIS; Automated Algorithm; India. 1. Introduction Green, red and brown algal blooms have been reported to increase spatially and temporally in many coastal and offshore waters around the world. Increased incidences and severity of such algal blooms could be due to nutria- ent enrichment of these waters supplied from anthropo- genic or natural sources, hydrographic changes, or cli- mate change impacts [1-9]. The appearance, persistence and epidemic of some of these blooms have also been reported to cause fish mortality, shellfish poisoning, physiological impairment, and numerous ecological and health impacts [1,5] and references therein. Over the past decades, an increase in the frequency of algal blooms has also been reported in coastal and off- shore waters around India [10-17]. Major algal blooms dominating in this region are Trichodesmium erythareum, Trichodesmium thiebautii, Noctiluca scintillans, Nocti- luca milaris, and Cocholodinium ploykrikoides [11,12,14, 15]. Trichodesmium is a typical genus of pelagic blue- green algae, which has two species T. thiebautii and T. erythareum—both occurring mostly in tropical and sub- tropical seas. These species are known as nitrogen fertil- izer because of their N2 fixing action. They are distin- guishable by their occurrence on the surface waters, and are a common feature from February to May when large areas of the sea (particularly Arabian Sea and coastal waters around India) are covered with clumps of saw- dust colored algae features [17]. Until the late 1990s, N. miliaris, a large dinoflagellate, was a minor component of phytoplankton populations in the Arabian Sea, appearing sporadically in bloom form in coastal regions during the summer southwest monsoon (June-September). Recently, N. miliaris blooms have begun to appear with increased frequency and intensity following the winter northeast monsoon (November-Fe- bruary) [14]. Several cruises conducted by the National Institute of Oceanography (India) have also documented the appearance of extensive blooms of N. miliaris in the late winter to early spring for several consecutive years. N. scintillans is also published as N. miliaris which turns the water green or red depending on its pigment varia- tions and associated constituents. Blooms of N. scintil- lans have been observed in coastal waters of Oman and India (northeastern Arabian Sea, Orissa coast, Kochi coast, and Gulf of Mannar) almost every year with varia- tions in their abundances [10,12,15]). On the other hand, C. polykrikoides is a common ichthyotoxic “red water” bloom species associated with extensive fish kills and great economic loss in Japanese and Korean waters [5,7]. *Corresponding author. C opyright © 2012 SciRes. ARS 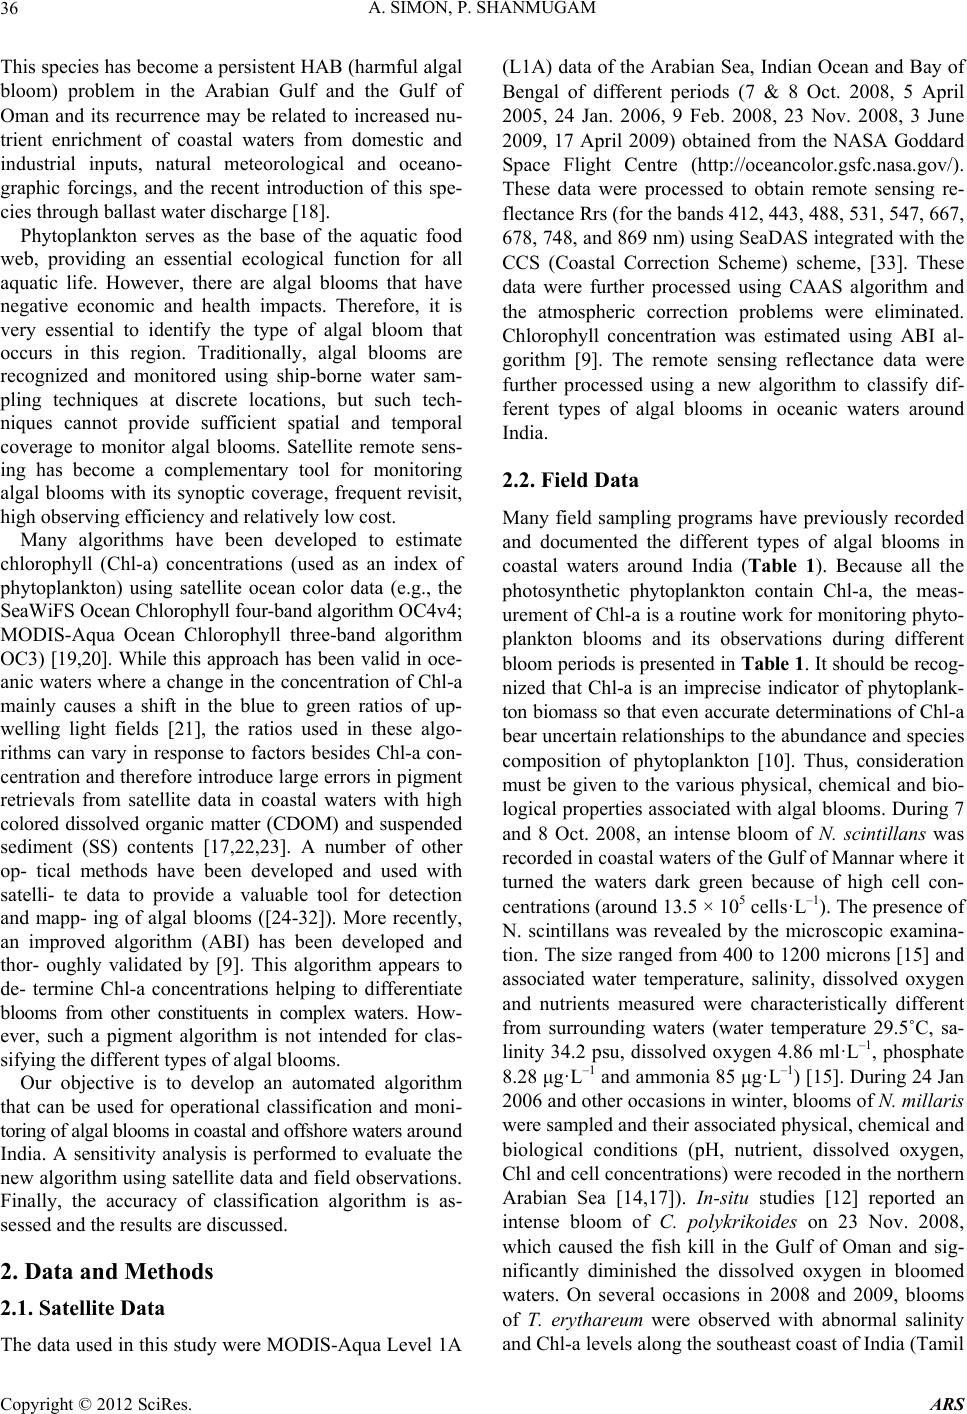 A. SIMON, P. SHANMUGAM 36 This species has become a persistent HAB (harmful algal bloom) problem in the Arabian Gulf and the Gulf of Oman and its recurrence may be related to increased nu- trient enrichment of coastal waters from domestic and industrial inputs, natural meteorological and oceano- graphic forcings, and the recent introduction of this spe- cies through ballast water discharge [18]. Phytoplankton serves as the base of the aquatic food web, providing an essential ecological function for all aquatic life. However, there are algal blooms that have negative economic and health impacts. Therefore, it is very essential to identify the type of algal bloom that occurs in this region. Traditionally, algal blooms are recognized and monitored using ship-borne water sam- pling techniques at discrete locations, but such tech- niques cannot provide sufficient spatial and temporal coverage to monitor algal blooms. Satellite remote sens- ing has become a complementary tool for monitoring algal blooms with its synoptic coverage, frequent revisit, high observing efficiency and relatively low cost. Many algorithms have been developed to estimate chlorophyll (Chl-a) concentrations (used as an index of phytoplankton) using satellite ocean color data (e.g., the SeaWiFS Ocean Chlorophyll four-band algorithm OC4v4; MODIS-Aqua Ocean Chlorophyll three-band algorithm OC3) [19,20]. While this approach has been valid in oce- anic waters where a change in the concentration of Chl-a mainly causes a shift in the blue to green ratios of up- welling light fields [21], the ratios used in these algo- rithms can vary in response to factors besides Chl-a con- centration and therefore introduce large errors in pigment retrievals from satellite data in coastal waters with high colored dissolved organic matter (CDOM) and suspended sediment (SS) contents [17,22,23]. A number of other op- tical methods have been developed and used with satelli- te data to provide a valuable tool for detection and mapp- ing of algal blooms ([24-32]). More recently, an improved algorithm (ABI) has been developed and thor- oughly validated by [9]. This algorithm appears to de- termine Chl-a concentrations helping to differentiate blooms from other constituents in complex waters. How- ever, such a pigment algorithm is not intended for clas- sifying the different types of algal blooms. Our objective is to develop an automated algorithm that can be used for operational classification and moni- toring of algal blooms in coastal and offshore waters around India. A sensitivity analysis is performed to evaluate the new algorithm using satellite data and field observations. Finally, the accuracy of classification algorithm is as- sessed and the results are discussed. 2. Data and Methods 2.1. Satellite Data The data used in this study were MODIS-Aqua Level 1A (L1A) data of the Arabian Sea, Indian Ocean and Bay of Bengal of different periods (7 & 8 Oct. 2008, 5 April 2005, 24 Jan. 2006, 9 Feb. 2008, 23 Nov. 2008, 3 June 2009, 17 April 2009) obtained from the NASA Goddard Space Flight Centre (http://oceancolor.gsfc.nasa.gov/). These data were processed to obtain remote sensing re- flectance Rrs (for the bands 412, 443, 488, 531, 547, 667, 678, 748, and 869 nm) using SeaDAS integrated with the CCS (Coastal Correction Scheme) scheme, [33]. These data were further processed using CAAS algorithm and the atmospheric correction problems were eliminated. Chlorophyll concentration was estimated using ABI al- gorithm [9]. The remote sensing reflectance data were further processed using a new algorithm to classify dif- ferent types of algal blooms in oceanic waters around India. 2.2. Field Data Many field sampling programs have previously recorded and documented the different types of algal blooms in coastal waters around India (Table 1). Because all the photosynthetic phytoplankton contain Chl-a, the meas- urement of Chl-a is a routine work for monitoring phyto- plankton blooms and its observations during different bloom periods is presented in Table 1. It should be recog- nized that Chl-a is an imprecise indicator of phytoplank- ton biomass so that even accurate determinations of Chl-a bear uncertain relationships to the abundance and species composition of phytoplankton [10]. Thus, consideration must be given to the various physical, chemical and bio- logical properties associated with algal blooms. During 7 and 8 Oct. 2008, an intense bloom of N. scintillans was recorded in coastal waters of the Gulf of Mannar where it turned the waters dark green because of high cell con- centrations (around 13.5 × 10⁵ cells·L–1). The presence of N. scintillans was revealed by the microscopic examina- tion. The size ranged from 400 to 1200 microns [15] and associated water temperature, salinity, dissolved oxygen and nutrients measured were characteristically different from surrounding waters (water temperature 29.5˚C, sa- linity 34.2 psu, dissolved oxygen 4.86 ml·L–1, phosphate 8.28 μg·L–1 and ammonia 85 μg·L–1) [15]. During 24 Jan 2006 and other occasions in winter, blooms of N. millaris were sampled and their associated physical, chemical and biological conditions (pH, nutrient, dissolved oxygen, Chl and cell concentrations) were recoded in the northern Arabian Sea [14,17]). In-situ studies [12] reported an intense bloom of C. polykrikoides on 23 Nov. 2008, which caused the fish kill in the Gulf of Oman and sig- nificantly diminished the dissolved oxygen in bloomed waters. On several occasions in 2008 and 2009, blooms of T. erythareum were observed with abnormal salinity and Chl-a levels along the southeast coast of India (Tamil Copyright © 2012 SciRes. ARS 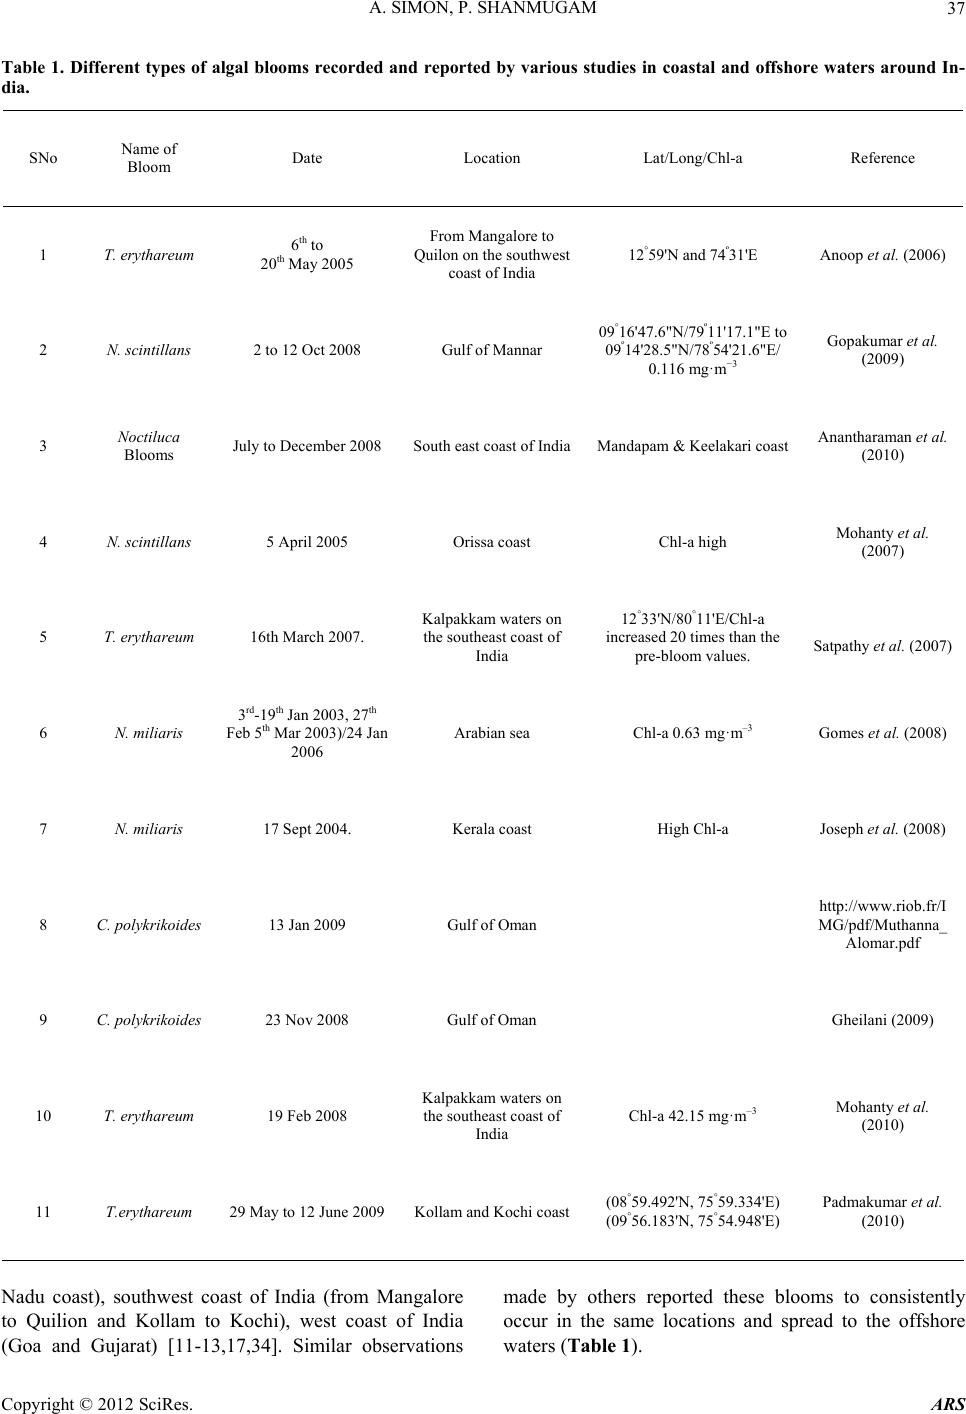 A. SIMON, P. SHANMUGAM Copyright © 2012 SciRes. ARS 37 Table 1. Different types of algal blooms recorded and reported by various studies in coastal and offshore waters around In- dia. SNo Name of Bloom Date Location Lat/Long/Chl-a Reference 1 T. erythareum 6th to 20th May 2005 From Mangalore to Quilon on the southwest coast of India 12°59'N and 74º31'E Anoop et al. (2006) 2 N. scintillans 2 to 12 Oct 2008 Gulf of Mannar 09°16'47.6"N/79º11'17.1"E to 09º14'28.5"N/78º54'21.6"E/ 0.116 mg·m−3 Gopakumar et al. (2009) 3 Noctiluca Blooms July to December 2008 South east coast of IndiaMandapam & Keelakari coast Anantharaman et al. (2010) 4 N. scintillans 5 April 2005 Orissa coast Chl-a high Mohanty et al. (2007) 5 T. erythareum 16th March 2007. Kalpakkam waters on the southeast coast of India 12°33'N/80°11'E/Chl-a increased 20 times than the pre-bloom values. Satpathy et al. (2007) 6 N. miliaris 3rd-19th Jan 2003, 27th Feb 5th Mar 2003)/24 Jan 2006 Arabian sea Chl-a 0.63 mg·m–3 Gomes et al. (2008) 7 N. miliaris 17 Sept 2004. Kerala coast High Chl-a Joseph et al. (2008) 8 C. polykrikoides 13 Jan 2009 Gulf of Oman http://www.riob.fr/I MG/pdf/Muthanna_ Alomar.pdf 9 C. polykrikoides 23 Nov 2008 Gulf of Oman Gheilani (2009) 10 T. erythareum 19 Feb 2008 Kalpakkam waters on the southeast coast of India Chl-a 42.15 mg·m–3 Mohanty et al. (2010) 11 T.erythareum 29 May to 12 June 2009Kollam and Kochi coast(08°59.492'N, 75°59.334'E) (09°56.183'N, 75°54.948'E) Padmakumar et al. (2010) Nadu coast), southwest coast of India (from Mangalore to Quilion and Kollam to Kochi), west coast of India (Goa and Gujarat) [11-13,17,34]. Similar observations made by others reported these blooms to consistently occur in the same locations and spread to the offshore waters (Table 1). 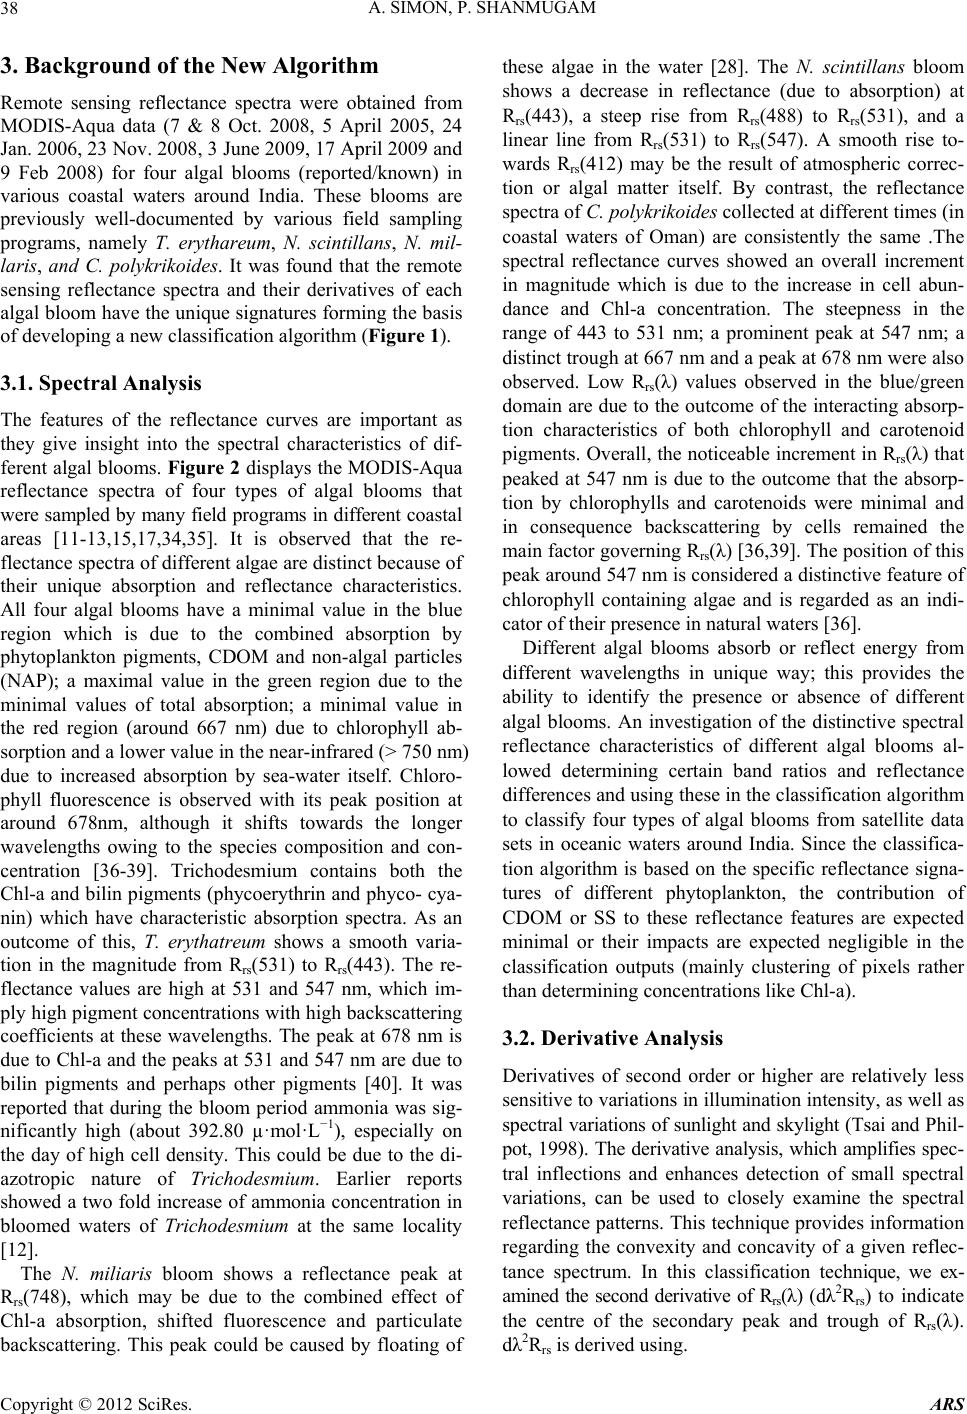 A. SIMON, P. SHANMUGAM 38 3. Background of the New Algorithm Remote sensing reflectance spectra were obtained from MODIS-Aqua data (7 & 8 Oct. 2008, 5 April 2005, 24 Jan. 2006, 23 Nov. 2008, 3 June 2009, 17 April 2009 and 9 Feb 2008) for four algal blooms (reported/known) in various coastal waters around India. These blooms are previously well-documented by various field sampling programs, namely T. erythareum, N. scintillans, N. mil- laris, and C. polykrikoides. It was found that the remote sensing reflectance spectra and their derivatives of each algal bloom have the unique signatures forming the basis of developing a new classification algorithm (Figure 1). 3.1. Spectral Analysis The features of the reflectance curves are important as they give insight into the spectral characteristics of dif- ferent algal blooms. Figure 2 displays the MODIS-Aqua reflectance spectra of four types of algal blooms that were sampled by many field programs in different coastal areas [11-13,15,17,34,35]. It is observed that the re- flectance spectra of different algae are distinct because of their unique absorption and reflectance characteristics. All four algal blooms have a minimal value in the blue region which is due to the combined absorption by phytoplankton pigments, CDOM and non-algal particles (NAP); a maximal value in the green region due to the minimal values of total absorption; a minimal value in the red region (around 667 nm) due to chlorophyll ab- sorption and a lower value in the near-infrared (> 750 nm) due to increased absorption by sea-water itself. Chloro- phyll fluorescence is observed with its peak position at around 678nm, although it shifts towards the longer wavelengths owing to the species composition and con- centration [36-39]. Trichodesmium contains both the Chl-a and bilin pigments (phycoerythrin and phyco- cya- nin) which have characteristic absorption spectra. As an outcome of this, T. erythatreum shows a smooth varia- tion in the magnitude from Rrs(531) to Rrs(443). The re- flectance values are high at 531 and 547 nm, which im- ply high pigment concentrations with high backscattering coefficients at these wavelengths. The peak at 678 nm is due to Chl-a and the peaks at 531 and 547 nm are due to bilin pigments and perhaps other pigments [40]. It was reported that during the bloom period ammonia was sig- nificantly high (about 392.80 µ·mol·L−1), especially on the day of high cell density. This could be due to the di- azotropic nature of Trichodesmium. Earlier reports showed a two fold increase of ammonia concentration in bloomed waters of Trichodesmium at the same locality [12]. The N. miliaris bloom shows a reflectance peak at Rrs(748), which may be due to the combined effect of Chl-a absorption, shifted fluorescence and particulate backscattering. This peak could be caused by floating of these algae in the water [28]. The N. scintillans bloom shows a decrease in reflectance (due to absorption) at Rrs(443), a steep rise from Rrs(488) to Rrs(531), and a linear line from Rrs(531) to Rrs(547). A smooth rise to- wards Rrs(412) may be the result of atmospheric correc- tion or algal matter itself. By contrast, the reflectance spectra of C. polykrikoides collected at different times (in coastal waters of Oman) are consistently the same .The spectral reflectance curves showed an overall increment in magnitude which is due to the increase in cell abun- dance and Chl-a concentration. The steepness in the range of 443 to 531 nm; a prominent peak at 547 nm; a distinct trough at 667 nm and a peak at 678 nm were also observed. Low Rrs(λ) values observed in the blue/green domain are due to the outcome of the interacting absorp- tion characteristics of both chlorophyll and carotenoid pigments. Overall, the noticeable increment in Rrs(λ) that peaked at 547 nm is due to the outcome that the absorp- tion by chlorophylls and carotenoids were minimal and in consequence backscattering by cells remained the main factor governing Rrs(λ) [36,39]. The position of this peak around 547 nm is considered a distinctive feature of chlorophyll containing algae and is regarded as an indi- cator of their presence in natural waters [36]. Different algal blooms absorb or reflect energy from different wavelengths in unique way; this provides the ability to identify the presence or absence of different algal blooms. An investigation of the distinctive spectral reflectance characteristics of different algal blooms al- lowed determining certain band ratios and reflectance differences and using these in the classification algorithm to classify four types of algal blooms from satellite data sets in oceanic waters around India. Since the classifica- tion algorithm is based on the specific reflectance signa- tures of different phytoplankton, the contribution of CDOM or SS to these reflectance features are expected minimal or their impacts are expected negligible in the classification outputs (mainly clustering of pixels rather than determining concentrations like Chl-a). 3.2. Derivative Analysis Derivatives of second order or higher are relatively less sensitive to variations in illumination intensity, as well as spectral variations of sunlight and skylight (Tsai and Phil- pot, 1998). The derivative analysis, which amplifies spec- tral inflections and enhances detection of small spectral variations, can be used to closely examine the spectral reflectance patterns. This technique provides information regarding the convexity and concavity of a given reflec- tance spectrum. In this classification technique, we ex- amined the second derivative of Rrs(λ) (dλ2Rrs) to indicate the centre of the secondary peak and trough of Rrs(λ). dλ2Rrs is derived using. Copyright © 2012 SciRes. ARS 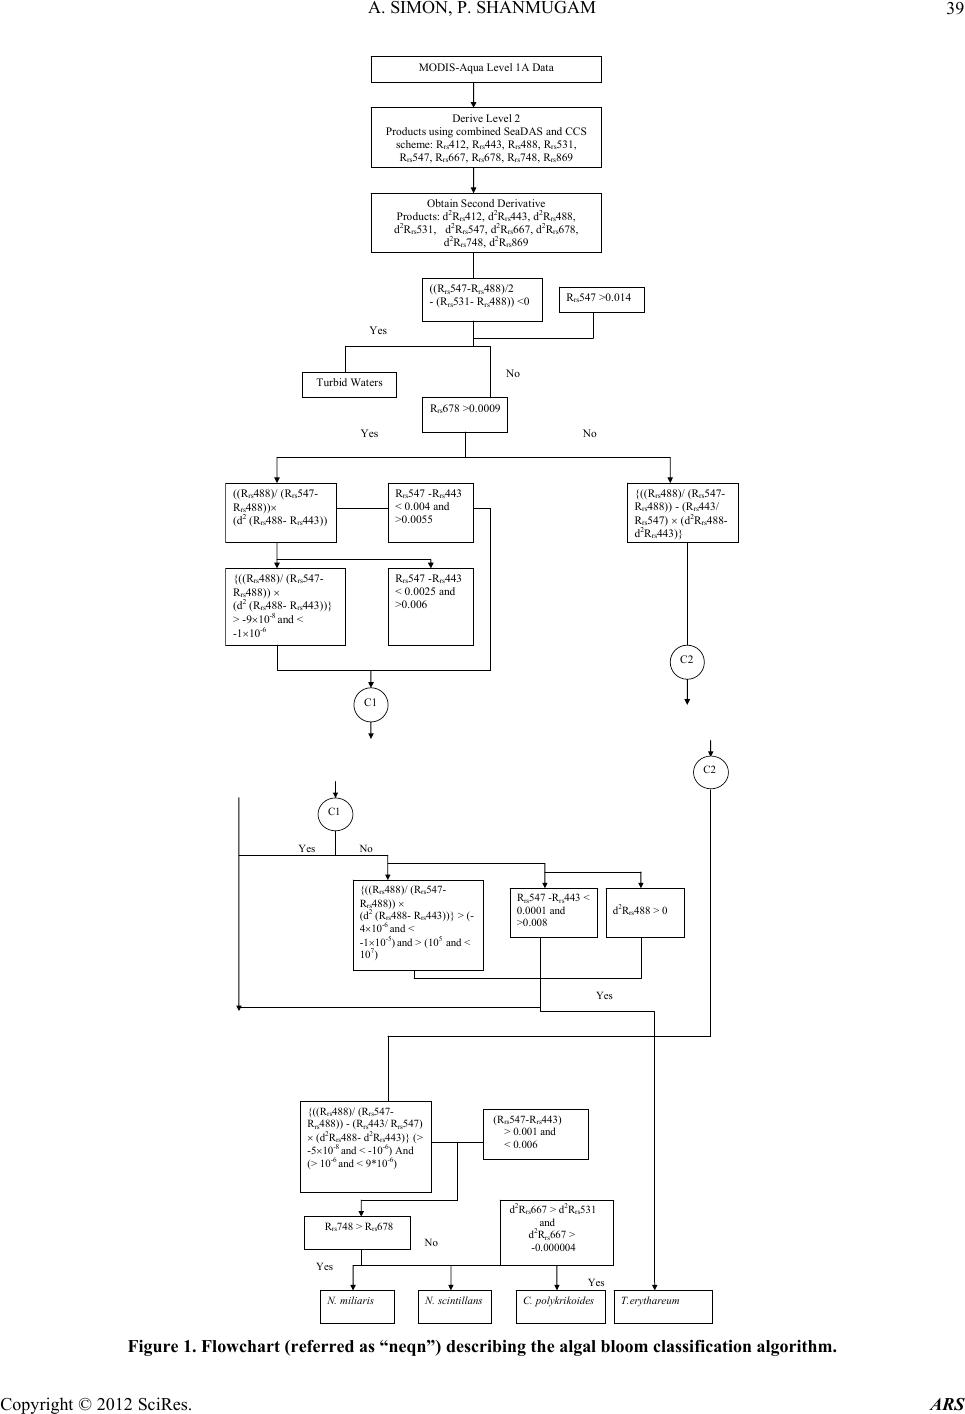 A. SIMON, P. SHANMUGAM Copyright © 2012 SciRes. ARS 39 MODIS-Aqua Level 1A Data Derive Level 2 Products using combined SeaDAS and CCS scheme: R rs 412, R rs 443, R rs 488, R rs 531, R rs 547, R rs 667, R rs 678, R rs 748, R rs 869 R rs 678 >0.0009 Y ((R rs 488)/ (R rs 547- R rs 488)) (d 2 (R rs 488- R rs 443)) {((R rs 488)/ (R rs 547- R rs 488)) - (R rs 443/ R rs 547) (d 2 R rs 488- d 2 R rs 443 Obtain Second Derivative Products: d 2 R rs 412, d 2 R rs 443, d 2 R rs 488, d 2 R rs 531, d 2 R rs 547, d 2 R rs 667, d 2 R rs 678, d 2 R rs 748, d 2 R rs 869 R rs 547 -R rs 443 < 0.0025 and >0.006 {((R rs 488)/ (R rs 547- R rs 488)) (d 2 (R rs 488- R rs 443))} > -910 -8 and < -110 -6 R rs 547 -R rs 443 < 0.004 and >0.0055 C2 ((R rs 547-R rs 488)/2 - (R rs 531- R rs 488)) <0 Turbid Waters Y No C1 R rs 547 >0.014 Y {((R rs 488)/ (R rs 547- R rs 488)) (d 2 (R rs 488- R rs 443))} > (- 410 -6 and < -110 -5 ) and > (10 5 and < 10 7 ) R rs 547 -R rs 443 < 0.0001 and >0.008 d 2 R rs 488 > 0 T.erythareum C1 {((R rs 488)/ (R rs 547- R rs 488)) - (R rs 443/ R rs 547) (d 2 R rs 488- d 2 R rs 443)} (> -510 -8 and < -10 -6 ) And (> 10 -6 and < 9*10 -6 ) R rs 748 > R rs 678 Y N. mi liar i s N. scintillans (R rs 547-R rs 443) > 0.001 and < 0.006 d R rs 667 > d R rs 531 and d 2 R rs 667 > -0.000004 C. polykrikoides Y Y C2 Figure 1. Flowchart (referred as “neqn”) describing the algal bloom classification algorithm.  A. SIMON, P. SHANMUGAM 40 Figure 2. Remote sensing reflectance spectra obtained from. 2 2 (( )2 rsrs irs dR RR d 11 2 ()( )) irs i R (1) where the finite band resolution Δλ = (λi – λi + 1 ). It was found that each bloom has distinct derivative spectra as shown in Figure 3. The derivative spectra have a nega- tive maximum at 667 nm and a negative minimum value at 531 nm for the T. erythareum bloom. N. scintillans has two negative troughs at 531nm and 667nm of the deriva- tive spectra. In the derivative spectra of N. miliaris a positive maximum peak is observed at 667 nm and a minimum peak at 531 nm. Two negative troughs at 531 nm and 667nm are observed in the derivative spectra of C. polykrikoides. In these derivative spectra the promi- nent peak at 667 nm reflects the absorption maxima of Chl-a, whereas the peaks appearing at 488 nm and 531 nm reflect the absorption feature of carotenoids [40]. In this analysis, two sets of reflectance difference/ra- tios along with a difference in derivative spectra were used to differentiate the four types of algal blooms, as follows: 22 488 443 rs dR 488 547 488 rs rs rs rs RdR RR for T. erythareum (2) 22 443 rs dR ( 488)443488 547 488547 rsrs rs rs rsrs RR dR RR R for N. scintillans, N. miliaris and C. polykrikoides (3). A scatterplot of the output from Equations (2) and (3) (Figure 1) versus reflectance difference (547 - 443) is shown in Figure 4 where all four types of algal blooms are well clustered and distinguished. The means of each cluster of the algal blooms were calculated and for each algal bloom type the distances toward class means were calculated (Figure 4). Then, the classification was performed as follows: • The shortest distance to a class mean was found • If the shortest distance to a class mean was nearest to the user-defined threshold, then this class name is as- signed to the output pixel. • Else the undefined value was assigned to the nearest algal bloom type. 4. Accuracy Assessment The error matrix can be used for a series of descriptive and analytical statistical techniques. Perhaps the simplest descriptive statistic is overall accuracy which is com- puted by dividing the total correct (i.e., the sum of the major diago being correctly classified and is really a meas- ure of nal) by the total number of pixels in the error ma- trix. In addition, accuracies of individual categories can be computed in a similar manner. However, this case is a little more complex in that one has a choice of dividing the number of correct pixels in that category by either the total number of pixels in the corresponding row or the corresponding column. Traditionally, the total number of correct pixels in a category is divided by the total number of pixels of that category as derived from the reference data (i.e., the column total). This accuracy measure indi- cates the probability of a reference pixel omission error. This accuracy measure is often called “producer’s accu- racy” because the producer of the classification is interested Copyright © 2012 SciRes. ARS  A. SIMON, P. SHANMUGAM 41 Figure 3. Second-order derivative spectra for the four algal bloom types. Figure 4. Scatterplot of neqn (Figure 1) vs Rrs difference at 547 and 443 nm. in how well a certain area can be classified. If the total number of correct pixels in a category is divided by the total number of pixels that were classified in that cate- gory, then this result is a measure of commission error. This measure, called “user’s accuracy” or reliability, is indicative of the probability that a pixel classified on the image actually represents that category on the ground [41-43]. Copyright © 2012 SciRes. ARS  A. SIMON, P. SHANMUGAM 42 Thus, an error matrix was generated for the classifica- tion technique. Each row of the table was reserved for one of the remote sensing class used by the classification algorithm. Each column displays the corresponding ground truth classes in an identical order. This table was used to properly analyze the validity of each class as well as the classification as a whole. In this way one can evaluate in more detail the efficacy of the classification Overall accuracy = 100% D N (4) D: Total number of correct classifications, N: Total number of classifications. The overall accuracy of the classification technique was calculated. But just because 90% classifications were accurate overall, does not mean that each category was successfully classified at that rate. So the accuracy of each class type was also performed. The user’s accu- racy and the producers accuracy was calculated; User’s Accuracy = 100% D R (5) R: Number in row total. The User’s Accuracy was computed for each row; Producer’s Accuracy = 100% D C (6) C: Number in column total. The Producer’s Accuracy was computed for each column. The user’s accuracy and producer’s accuracy for the four types of algal blooms (T. erythareum, N. scintil- lans, N. millaris, and C. polykrikoides) were calculated. Another measure of map accuracy is the Kappa coeffi- cient, which is a measure of the proportional (or per- centage) improvement by the classifier over a purely random assignment to classes. For an error matrix with r- rows, and hence the same number of columns, where A = the sum of r diagonal elements, B = sum of the r products (row total × column total). Kappa Coefficient,2 AB K B (7) where N is the number of pixels in the error matrix (the sum of all r individual cell values). If the Kappa coeffi- cient is 1, then the classification can be said to be 100% correct. 5. Results The new algorithm was applied to a series of MODIS- Aqua data to classify different types of algal blooms in coastal oceanic waters around India (Arabian Sea, Indian Ocean and Bay of Bengal). The scattering particles that cause the water to be turbid can be composed of many things, including sediments and phytoplankton. In addi- tion to the spectral criteria for each bloom, thresholds were thus applied to exclude extremely turbid waters in coastal regions (e.g., the Gulf of Kutch and Cambay) where the concentration of suspended sediments is con- sistently high through out the year and dominates phyto- plankton populations. Of several examples, an intense bloom of N. scintillans was observed in coastal waters of the Gulf of Mannar where it turned the waters dark green (field data on the right of Figure 5) because of high cell concentrations (around 13.5 × 10⁵ cells·L−1) [15]. The classified bloom was consistent with the field data, ABI_Chl-a and color composite images and appeared to spread along the coast of Gulf of Mannar during 2 to 13 Oct. 2008; no cloud-free scenes were available except 8 Oct. 2008 (Figure 5). It was noted that the occurrence and persistence of this bloom at the narrow strip of coastal area from Kilakarai to Pamban were due to the favorable environmental con- ditions, i.e., high air temperature, high sea surface tem- perature and salinity, low pH, absence of water currents, high concentration of nutrients, absence of rain and the favorable wind along the shore. All these factors influ- enced the sustenance of the bloom around the Islands and coastal waters, where the cell density ranged from 5.1 × 10⁵ cells·L–1 to 13.5 × 10⁵ cells·L–1 [15]. They also ob- served high suspended sediments and Chl-a (115.89 μg·L–1) during the bloom event. The environmental pa- rameters during the waning phase of this bloom were notably at increased levels; e.g., surface water tempera- ture 29.5˚C, salinity 34.2 psu, dissolved oxygen 4.86 ml·L –1, phosphate 8.28 μg·L–1 and ammonia 85 μg·L–1[15]. During 5 April 2005, an intense N. scintillans bloom was detected by MODIS-Aqua data in coastal waters off the Rushikulya River mouth (Figure 6). The color com- posite image showed the linear spread of the bloom and it can be confirmed by the ABI_Chl-a image (Figure 6, bottom panels). An in-situ study observed a prominent discoloration of the surface water in this region caused by dense and red-colored patches of this bloom of ap- proximately 16 square kilometres (Lat. 19°22'N and Long. 85°02'E) [12]. A relatively low-moderate temperature (26.7˚C to 30.6˚C) was reported to trigger the appearance of N. scintillans bloom in this area. Figure 7 shows an example of N. milaris bloom with consistent spatial patterns (in the ABI_Chl-a and color composite images) in the Gulf of Oman during 24 Jan. 2006. Field observations indicate that the bloom covered a wide area and turned the water dark green with streaks of red patches. It persisted for a fortnight in the Gulf and accounted for almost 69% of the phytoplankton popula- tion at off station on 24 Jan. 2006. The MODIS-Aqua image on 23 Nov. 2008 showed an in- tense bloom of C. polykrikoides covering a wide area from coastal waters of Oman to the Gulf of Aden (Figure 8). Copyright © 2012 SciRes. ARS 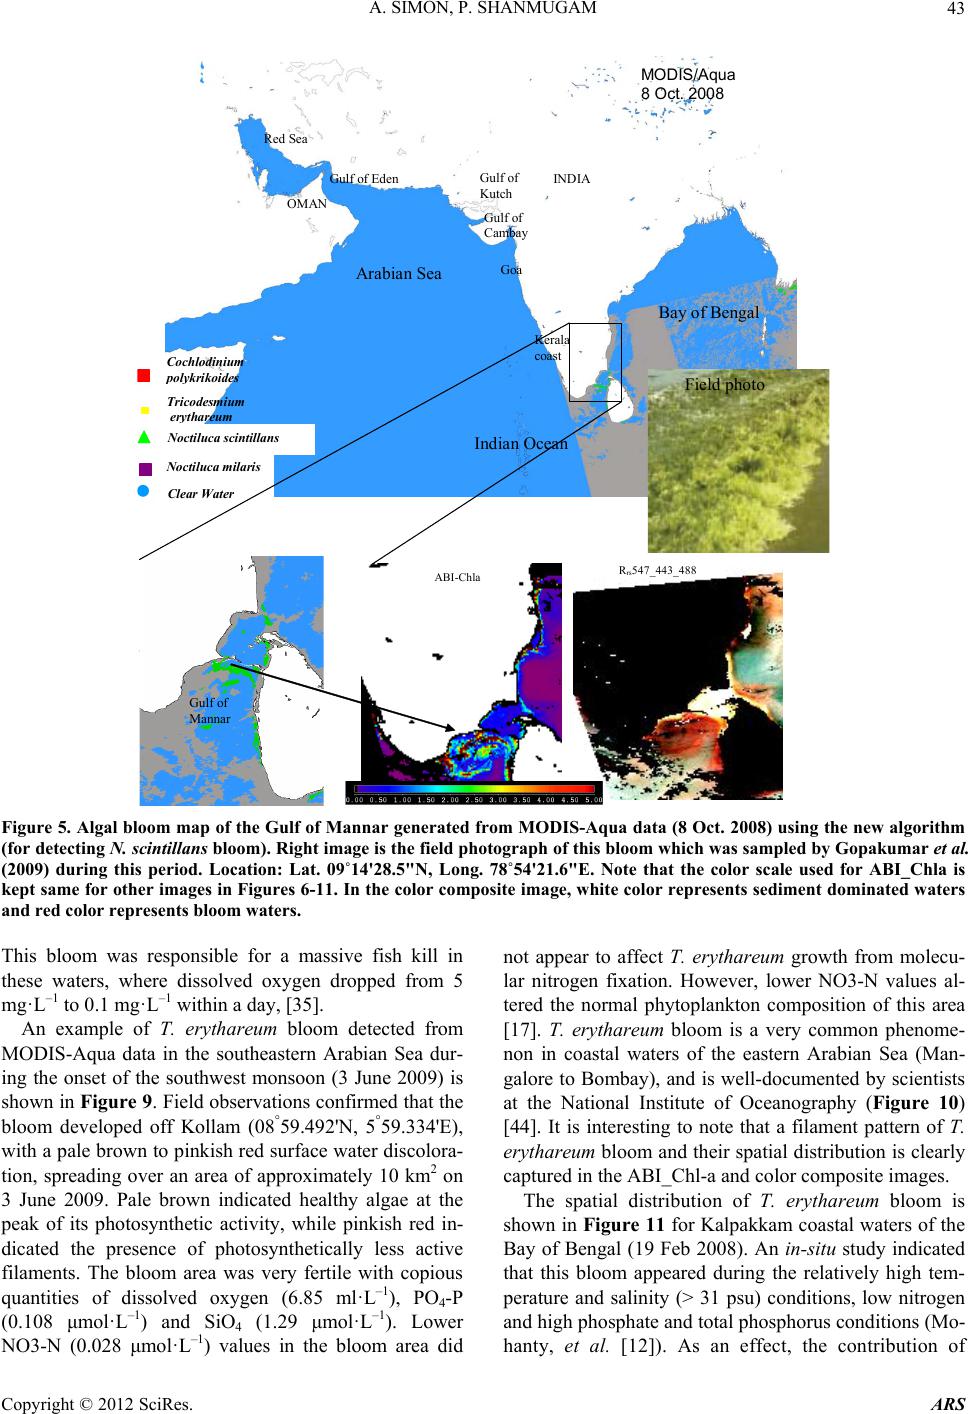 A. SIMON, P. SHANMUGAM Copyright © 2012 SciRes. ARS 43 MODIS/Aq 8 Oct. 2008 Gulf of Kutch INDIA OMAN Gulf of Eden Red Sea Gulf of Mannar Kerala coast Goa Gulf of Cambay Arabian Sea Indian Ocean Bay of B ua engal ABI-Chla Rrs547_443_488 Field photo Cochlodinium ol krikoides Noctiluca milaris Clear Water Tricodesmium er thareum Noctiluca scintillans Figure 5. Algal bloom map of the Gulf of Mannar generated from MODIS-Aqua data (8 Oct. 2008) using the new algorithm (for detecting N. scintillans bloom). Right image is the field photograph of this bloom which was sampled by Gopakumar et al. (2009) during this period. Location: Lat. 09˚14'28.5"N, Long. 78˚54'21.6"E. Note that the color scale used for ABI_Chla is kept same for other images in Figures 6-11. In the color composite image, white color represents sediment dominated waters and red color represents bloom waters. This bloom was responsible for a massive fish kill in these waters, where dissolved oxygen dropped from 5 mg· L –1 to 0.1 mg·L–1 within a day, [35]. An example of T. erythareum bloom detected from MODIS-Aqua data in the southeastern Arabian Sea dur- ing the onset of the southwest monsoon (3 June 2009) is shown in Figure 9. Field observations confirmed that the bloom developed off Kollam (08°59.492'N, 5°59.334'E), with a pale brown to pinkish red surface water discolora- tion, spreading over an area of approximately 10 km2 on 3 June 2009. Pale brown indicated healthy algae at the peak of its photosynthetic activity, while pinkish red in- dicated the presence of photosynthetically less active filaments. The bloom area was very fertile with copious quantities of dissolved oxygen (6.85 ml·L–1), PO4-P (0.108 μmol· L –1) and SiO4 (1.29 μmol· L –1). Lower NO3-N (0.028 μmol· L –1) values in the bloom area did not appear to affect T. erythareum growth from molecu- lar nitrogen fixation. However, lower NO3-N values al- tered the normal phytoplankton composition of this area [17]. T. erythareum bloom is a very common phenome- non in coastal waters of the eastern Arabian Sea (Man- galore to Bombay), and is well-documented by scientists at the National Institute of Oceanography (Figure 10) [44]. It is interesting to note that a filament pattern of T. erythareum bloom and their spatial distribution is clearly captured in the ABI_Chl-a and color composite images. The spatial distribution of T. erythareum bloom is shown in Figure 11 for Kalpakkam coastal waters of the Bay of Bengal (19 Feb 2008). An in-situ study indicated that this bloom appeared during the relatively high tem- perature and salinity (> 31 psu) conditions, low nitrogen and high phosphate and total phosphorus conditions (Mo- hanty, et al. [12]). As an effect, the contribution of 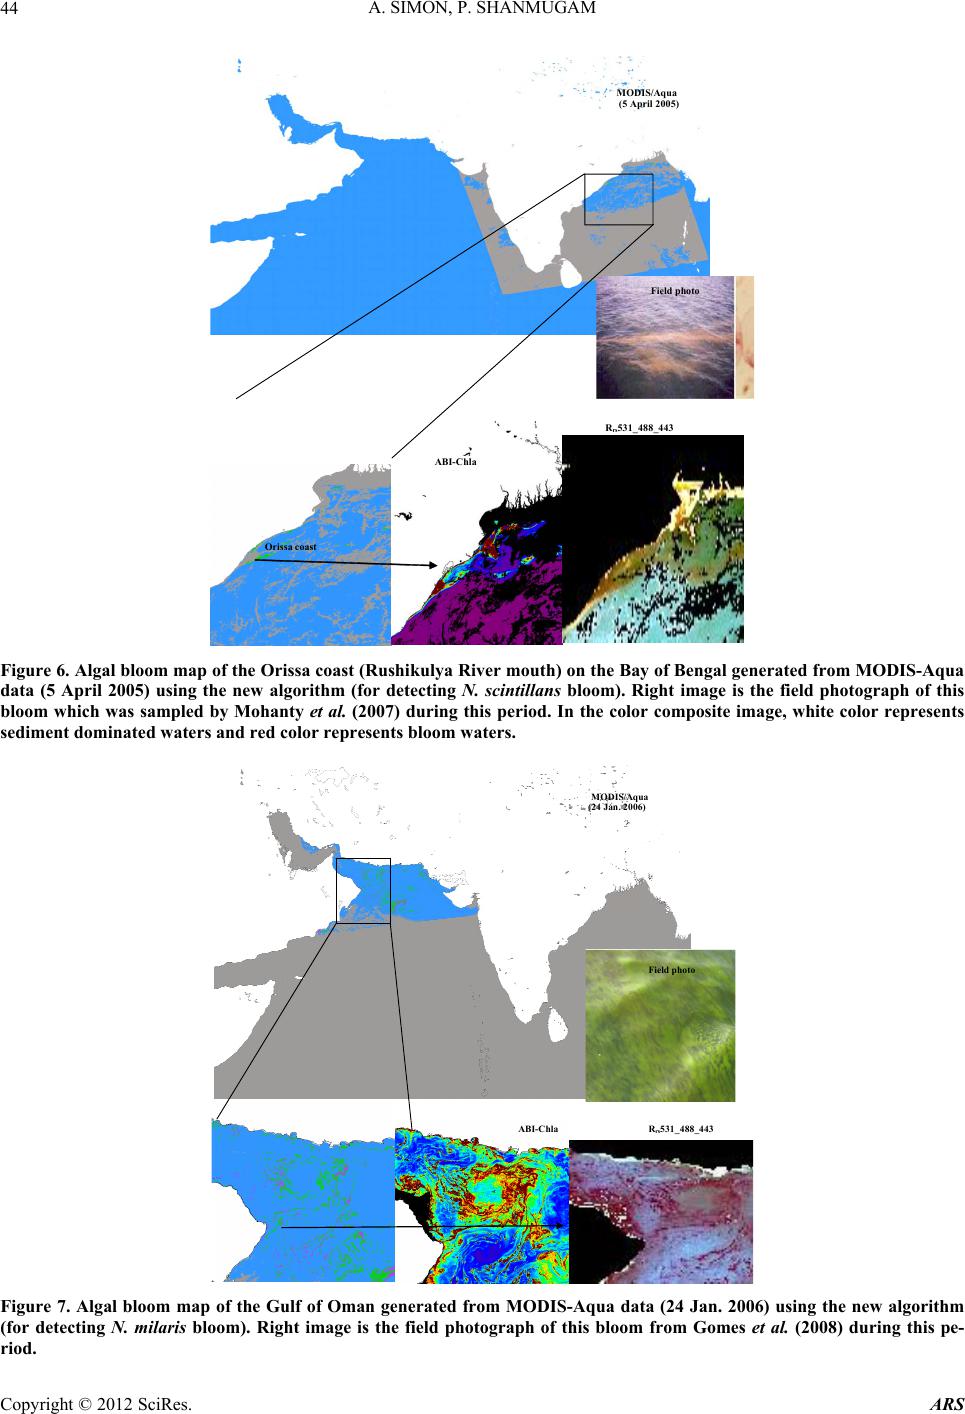 A. SIMON, P. SHANMUGAM 44 MODI (5 Ap Orissa coast S/Aqua ril 2005) ABI-Chla Rrs531_488_ Field ph oto 443 Figure 6. Algal bloom map of the Orissa coast (Rushikulya River mouth) on the Bay of Bengal gene rated from MODIS-Aq ua data (5 April 2005) using the new algorithm (for detecting N. scintillans bloom). Right image is the field photograph of this bloom which was sampled by Mohanty et al. (2007) during this period. In the color composite image, white color represents sediment dominated waters and red color represents bloom waters. ABI-Chla R rs 531_488_443 MODIS/Aqu (24 Jan. 2006) a Field photo Figure 7. Algal bloom map of the Gulf of Oman generated from MODIS-Aqua data (24 Jan. 2006) using the new algorithm (for detecting N. milaris bloom). Right image is the field photograph of this bloom from Gomes et al. (2008) during this pe- riod. Copyright © 2012 SciRes. ARS 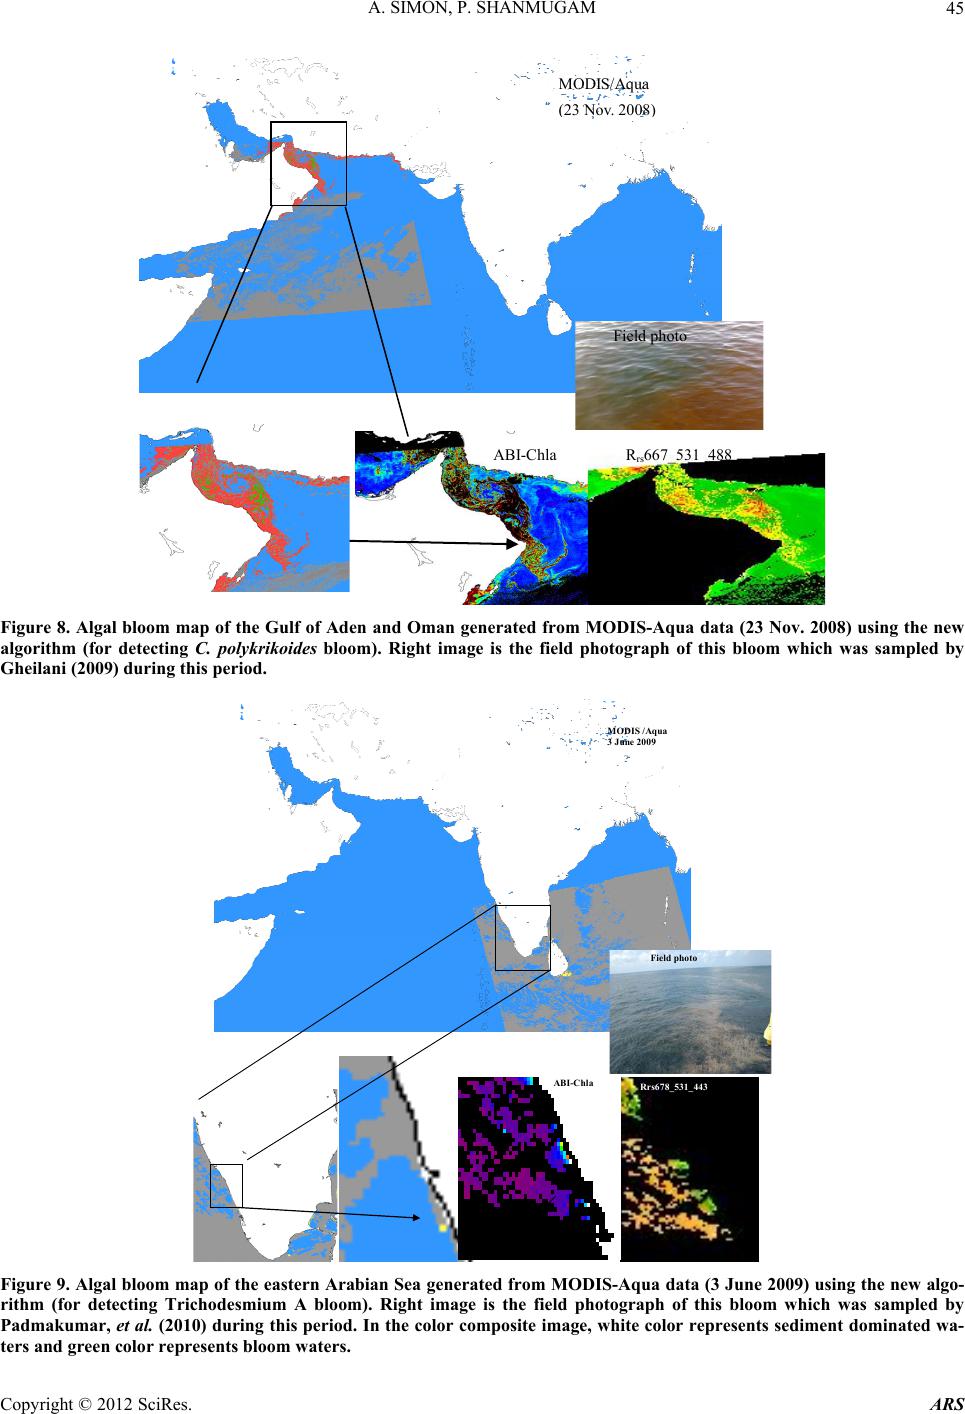 A. SIMON, P. SHANMUGAM 45 MODIS/Aqua 23 Nov. 2008 ABI-Chla R rs 667_531_ Field photo 488 Figure 8. Algal bloom map of the Gulf of Aden and Oman generated from MODIS-Aqua data (23 Nov. 2008) using the new algorithm (for detecting C. polykrikoides bloom). Right image is the field photograph of this bloom which was sampled by Gheilani (2009) during this period. MODIS /Aqu 3 Jun e 2009 a ABI -Ch l Rrs6 Fiel 78_531_443 d photo Figure 9. Algal bloom map of the eastern Arabian Sea generated from MODIS-Aqua data (3 June 2009) using the new algo- rithm (for detecting Trichodesmium A bloom). Right image is the field photograph of this bloom which was sampled by Padmakumar, et al. (2010) during this period. In the color composite image, white color represents sediment dominated wa- ters and green color represents bloom waters. Copyright © 2012 SciRes. ARS 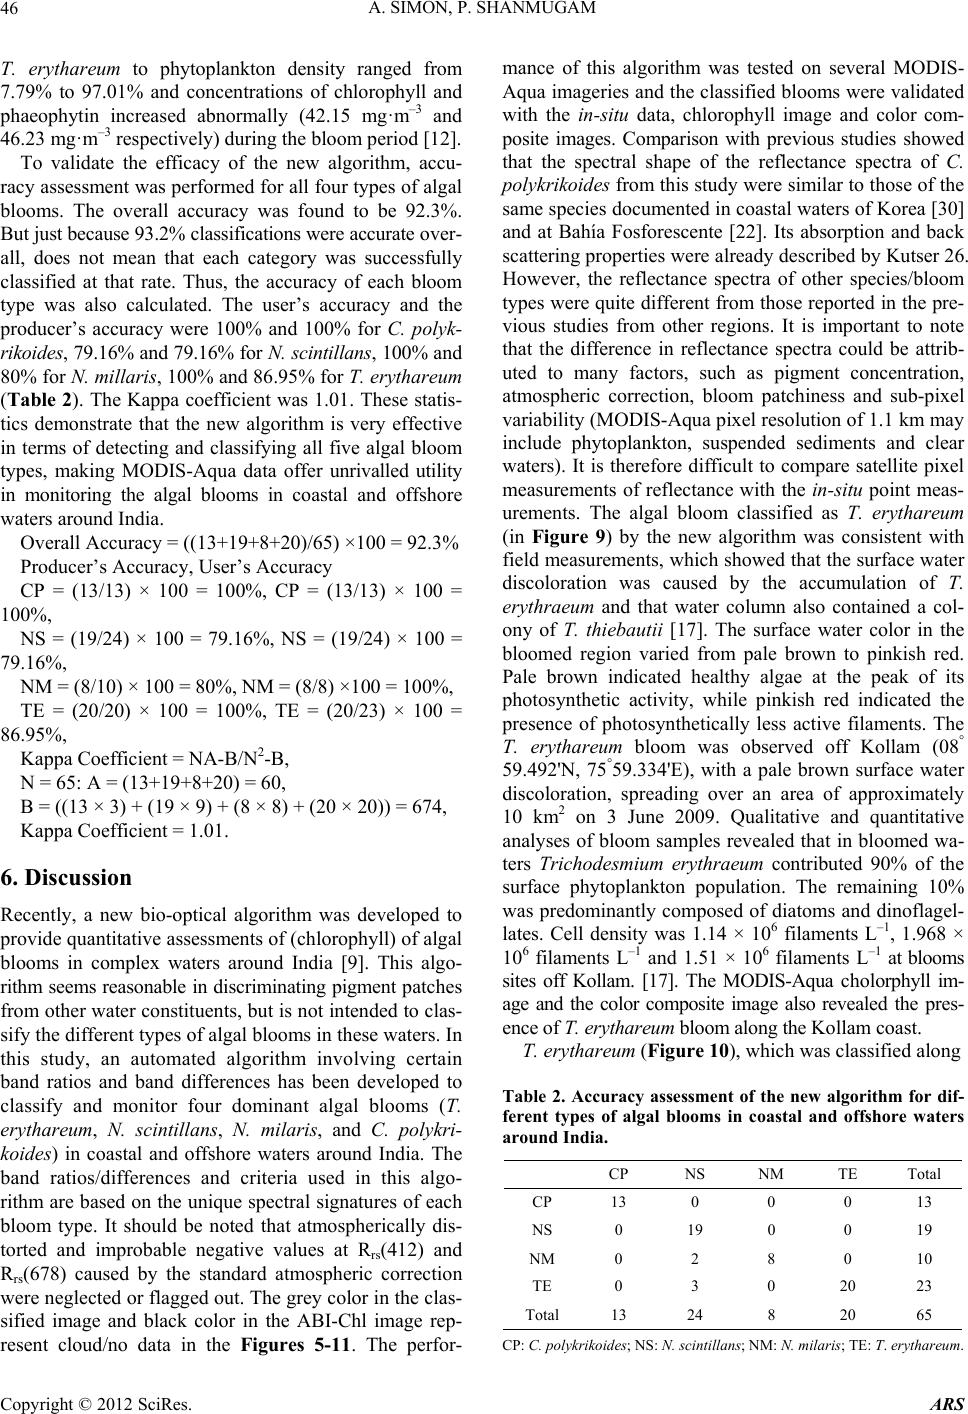 A. SIMON, P. SHANMUGAM Copyright © 2012 SciRes. ARS 46 T. erythareum to phytoplankton density ranged from 7.79% to 97.01% and concentrations of chlorophyll and phaeophytin increased abnormally (42.15 mg·m–3 and 46.23 mg·m–3 respectively) during the bloom period [12]. To validate the efficacy of the new algorithm, accu- racy assessment was performed for all four types of algal blooms. The overall accuracy was found to be 92.3%. But just because 93.2% classifications were accurate over- all, does not mean that each category was successfully classified at that rate. Thus, the accuracy of each bloom type was also calculated. The user’s accuracy and the producer’s accuracy were 100% and 100% for C. polyk- rikoides, 79.16% and 79.16% for N. scintillans, 100% and 80% for N. millaris, 100% and 86.95% for T. erythareum (Table 2). The Kappa coefficient was 1.01. These statis- tics demonstrate that the new algorithm is very effective in terms of detecting and classifying all five algal bloom types, making MODIS-Aqua data offer unrivalled utility in monitoring the algal blooms in coastal and offshore waters around India. Overall Accuracy = ((13+19+8+20)/65) ×100 = 92.3% Producer’s Accuracy, User’s Accuracy CP = (13/13) × 100 = 100%, CP = (13/13) × 100 = 100%, NS = (19/24) × 100 = 79.16%, NS = (19/24) × 100 = 79.16%, NM = (8/10) × 100 = 80%, NM = (8/8) ×100 = 100%, TE = (20/20) × 100 = 100%, TE = (20/23) × 100 = 86.95%, Kappa Coefficient = NA-B/N2-B, N = 65: A = (13+19+8+20) = 60, B = ((13 × 3) + (19 × 9) + (8 × 8) + (20 × 20)) = 674, Kappa Coefficient = 1.01. 6. Discussion Recently, a new bio-optical algorithm was developed to provide quantitative assessments of (chlorophyll) of algal blooms in complex waters around India [9]. This algo- rithm seems reasonable in discriminating pigment patches from other water constituents, but is not intended to clas- sify the different types of algal blooms in these waters. In this study, an automated algorithm involving certain band ratios and band differences has been developed to classify and monitor four dominant algal blooms (T. erythareum, N. scintillans, N. milaris, and C. polykri- koides) in coastal and offshore waters around India. The band ratios/differences and criteria used in this algo- rithm are based on the unique spectral signatures of each bloom type. It should be noted that atmospherically dis- torted and improbable negative values at Rrs(412) and Rrs(678) caused by the standard atmospheric correction were neglected or flagged out. The grey color in the clas- sified image and black color in the ABI-Chl image rep- resent cloud/no data in the Figures 5-11. The perfor- mance of this algorithm was tested on several MODIS- Aqua imageries and the classified blooms were validated with the in-situ data, chlorophyll image and color com- posite images. Comparison with previous studies showed that the spectral shape of the reflectance spectra of C. polykrikoides from this study were similar to those of the same species documented in coastal waters of Korea [30] and at Bahía Fosforescente [22]. Its absorption and back scattering properties were already described by Kutser 26. However, the reflectance spectra of other species/bloom types were quite different from those reported in the pre- vious studies from other regions. It is important to note that the difference in reflectance spectra could be attrib- uted to many factors, such as pigment concentration, atmospheric correction, bloom patchiness and sub-pixel variability (MODIS-Aqua pixel resolution of 1.1 km may include phytoplankton, suspended sediments and clear waters). It is therefore difficult to compare satellite pixel measurements of reflectance with the in-situ point meas- urements. The algal bloom classified as T. erythareum (in Figure 9) by the new algorithm was consistent with field measurements, which showed that the surface water discoloration was caused by the accumulation of T. erythraeum and that water column also contained a col- ony of T. thiebautii [17]. The surface water color in the bloomed region varied from pale brown to pinkish red. Pale brown indicated healthy algae at the peak of its photosynthetic activity, while pinkish red indicated the presence of photosynthetically less active filaments. The T. erythareum bloom was observed off Kollam (08° 59.492'N, 75°59.334'E), with a pale brown surface water discoloration, spreading over an area of approximately 10 km2 on 3 June 2009. Qualitative and quantitative analyses of bloom samples revealed that in bloomed wa- ters Trichodesmium erythraeum contributed 90% of the surface phytoplankton population. The remaining 10% was predominantly composed of diatoms and dinoflagel- lates. Cell density was 1.14 × 10⁶ filaments L–1, 1.968 × 10⁶ filaments L–1 and 1.51 × 10⁶ filaments L–1 at blooms sites off Kollam. [17]. The MODIS-Aqua cholorphyll im- age and the color composite image also revealed the pres- ence of T. erythareum bloom along the Kollam coast. T. erythareum (Figure 10), which was classified along Table 2. Accuracy assessment of the new algorithm for dif- ferent types of algal blooms in coastal and offshore waters around India. CP NS NM TE Total CP 13 0 0 0 13 NS 0 19 0 0 19 NM 0 2 8 0 10 TE 0 3 0 20 23 Total 13 24 8 20 65 CP: C. polykrikoides; NS: N. scintillans; NM: N. milaris; TE: T. erythareum. 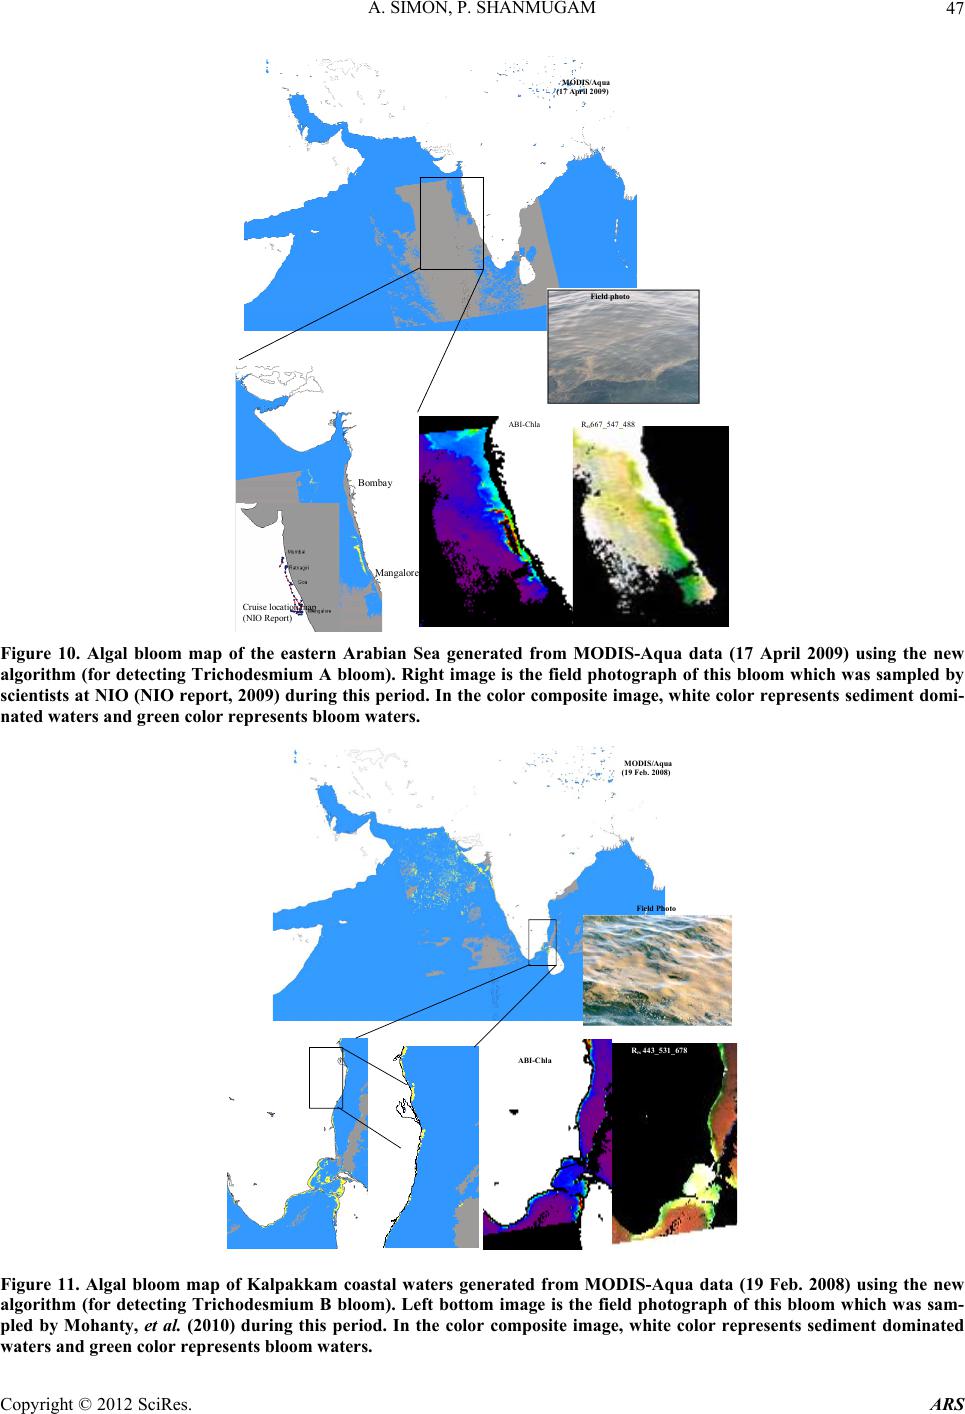 A. SIMON, P. SHANMUGAM 47 MODIS/Aqua (17 April 2009) Cruise location map NIO Re ort Bombay ABI-Chla rs 667_547 Mangalore Field ph _488 oto Figure 10. Algal bloom map of the eastern Arabian Sea generated from MODIS-Aqua data (17 April 2009) using the new algorithm (for detecting Trichodesmium A bl oom). Right image is the field photograph of this bloom which was sampled by scientists at NIO (NIO report, 2009) during this period. In the color composite image, white color represents sediment domi- nated waters and green color represents bloom w a ters. MODIS/Aqua Feb. 2008) (19 ABI-Chl Rrs 443_531_678 Field Photo Figure 11. Algal bloom map of Kalpakkam coastal waters generated from MODIS-Aqua data (19 Feb. 2008) using the new algorithm (for detecting Trichodesmium B bloom). Left bottom image is the field photograph of this bloom which was sam- pled by Mohanty, et al. (2010) during this period. In the color composite image, white color represents sediment dominated waters and green col o r re presents bloom waters. Copyright © 2012 SciRes. ARS 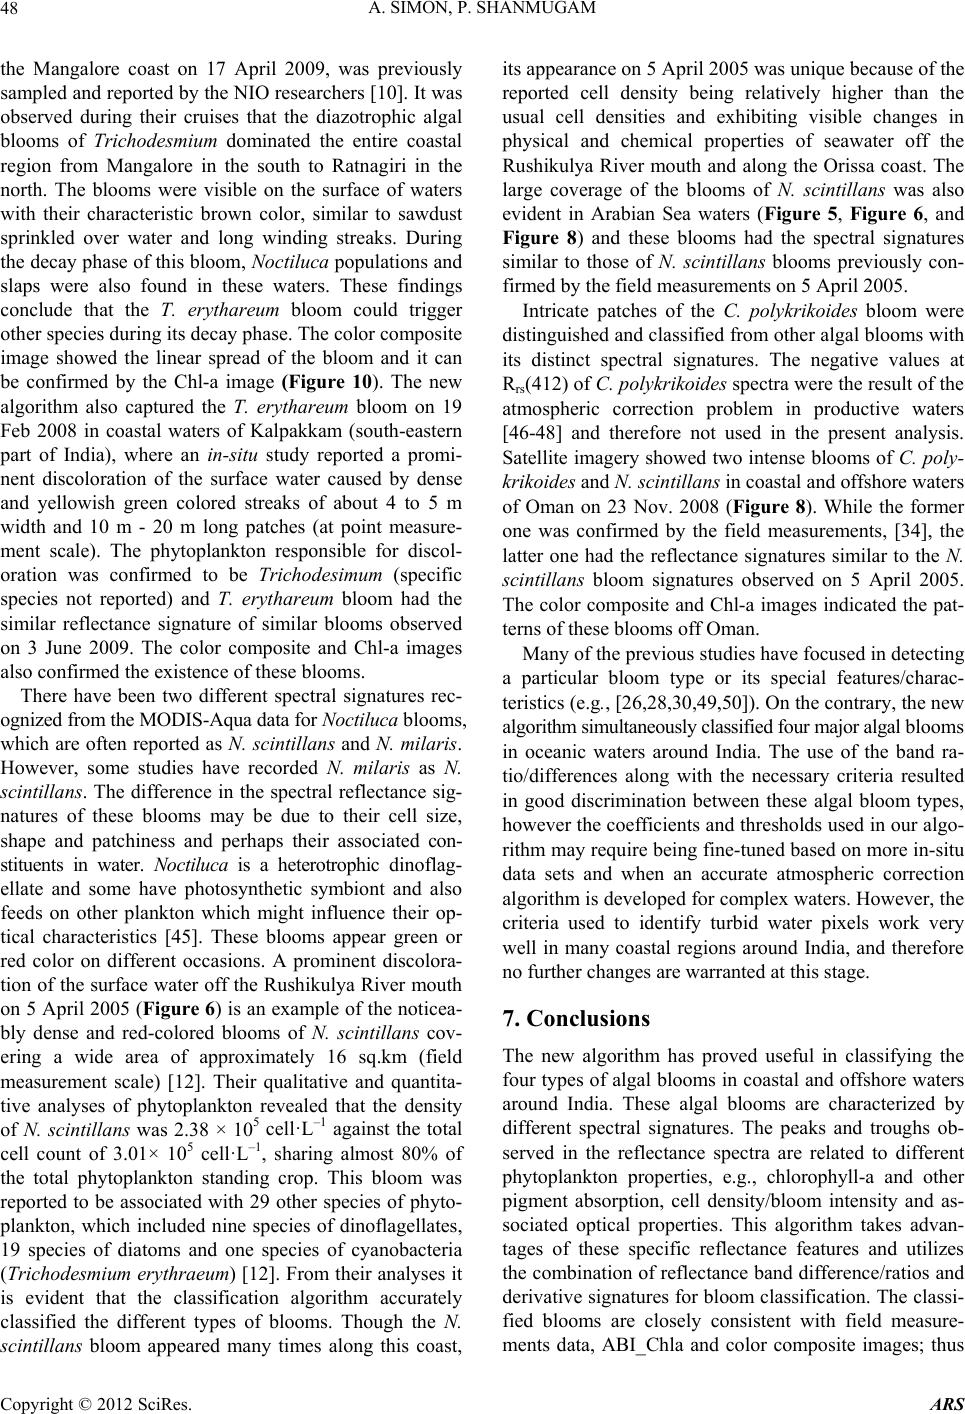 A. SIMON, P. SHANMUGAM 48 the Mangalore coast on 17 April 2009, was previously sampled and reported by the NIO researchers [10]. It was observed during their cruises that the diazotrophic algal blooms of Trichodesmium dominated the entire coastal region from Mangalore in the south to Ratnagiri in the north. The blooms were visible on the surface of waters with their characteristic brown color, similar to sawdust sprinkled over water and long winding streaks. During the decay phase of this bloom, Noctiluca populations and slaps were also found in these waters. These findings conclude that the T. erythareum bloom could trigger other species during its decay phase. The color composite image showed the linear spread of the bloom and it can be confirmed by the Chl-a image (Figure 10). The new algorithm also captured the T. erythareum bloom on 19 Feb 2008 in coastal waters of Kalpakkam (south-eastern part of India), where an in-situ study reported a promi- nent discoloration of the surface water caused by dense and yellowish green colored streaks of about 4 to 5 m width and 10 m - 20 m long patches (at point measure- ment scale). The phytoplankton responsible for discol- oration was confirmed to be Trichodesimum (specific species not reported) and T. erythareum bloom had the similar reflectance signature of similar blooms observed on 3 June 2009. The color composite and Chl-a images also confirmed the existence of these blooms. There have been two different spectral signatures rec- ognized from the MODIS-Aqua data for Noctiluca blooms, which are often reported as N. scintillans and N. milaris. However, some studies have recorded N. milaris as N. scintillans. The difference in the spectral reflectance sig- natures of these blooms may be due to their cell size, shape and patchiness and perhaps their associated con- stituents in water. Noctiluca is a heterotrophic dinoflag- ellate and some have photosynthetic symbiont and also feeds on other plankton which might influence their op- tical characteristics [45]. These blooms appear green or red color on different occasions. A prominent discolora- tion of the surface water off the Rushikulya River mouth on 5 April 2005 (Figure 6) is an example of the noticea- bly dense and red-colored blooms of N. scintillans cov- ering a wide area of approximately 16 sq.km (field measurement scale) [12]. Their qualitative and quantita- tive analyses of phytoplankton revealed that the density of N. scintillans was 2.38 × 10⁵ cell·L–1 against the total cell count of 3.01× 10⁵ cell·L–1, sharing almost 80% of the total phytoplankton standing crop. This bloom was reported to be associated with 29 other species of phyto- plankton, which included nine species of dinoflagellates, 19 species of diatoms and one species of cyanobacteria (Trichodesmium erythraeum) [12]. From their analyses it is evident that the classification algorithm accurately classified the different types of blooms. Though the N. scintillans bloom appeared many times along this coast, its appearance on 5 April 2005 was unique because of the reported cell density being relatively higher than the usual cell densities and exhibiting visible changes in physical and chemical properties of seawater off the Rushikulya River mouth and along the Orissa coast. The large coverage of the blooms of N. scintillans was also evident in Arabian Sea waters (Figure 5, Figure 6, and Figure 8) and these blooms had the spectral signatures similar to those of N. scintillans blooms previously con- firmed by the field measurements on 5 April 2005. Intricate patches of the C. polykrikoides bloom were distinguished and classified from other algal blooms with its distinct spectral signatures. The negative values at Rrs(412) of C. polykrikoides spectra were the result of the atmospheric correction problem in productive waters [46-48] and therefore not used in the present analysis. Satellite imagery showed two intense blooms of C. poly- krikoides and N. scintillans in coastal and offshore waters of Oman on 23 Nov. 2008 (Figure 8). While the former one was confirmed by the field measurements, [34], the latter one had the reflectance signatures similar to the N. scintillans bloom signatures observed on 5 April 2005. The color composite and Chl-a images indicated the pat- terns of these blooms off Oman. Many of the previous studies have focused in detecting a particular bloom type or its special features/charac- teristics (e.g., [26,28,30,49,50]). On the contrary, the new algorithm simultaneously classified four major algal blooms in oceanic waters around India. The use of the band ra- tio/differences along with the necessary criteria resulted in good discrimination between these algal bloom types, however the coefficients and thresholds used in our algo- rithm may require being fine-tuned based on more in-situ data sets and when an accurate atmospheric correction algorithm is developed for complex waters. However, the criteria used to identify turbid water pixels work very well in many coastal regions around India, and therefore no further changes are warranted at this stage. 7. Conclusions The new algorithm has proved useful in classifying the four types of algal blooms in coastal and offshore waters around India. These algal blooms are characterized by different spectral signatures. The peaks and troughs ob- served in the reflectance spectra are related to different phytoplankton properties, e.g., chlorophyll-a and other pigment absorption, cell density/bloom intensity and as- sociated optical properties. This algorithm takes advan- tages of these specific reflectance features and utilizes the combination of reflectance band difference/ratios and derivative signatures for bloom classification. The classi- fied blooms are closely consistent with field measure- ments data, ABI_Chla and color composite images; thus Copyright © 2012 SciRes. ARS  A. SIMON, P. SHANMUGAM 49 its classification accuracy is high for all the classified blooms. These results suggest that the new algorithm has the potential to classify and monitor the investigated al- gal blooms. The new algorithm will become increase- ingly valuable as further improvements are made based on more in-situ data sets for different types of algal blooms. The algorithm coefficients may require being fine-tuned when an accurate atmospheric correction al- gorithm is developed for retrieval of water-leaving radi- ance in complex waters around India. Our further work will therefore focus on improving these parts and pro- viding a detailed validation with large in-situ data sets. 8. Acknowledgements This research was supported by INCOIS and IITM-ISRO Cell under the grants (OEC1011102INCOPSHA and OEC0910129ISROPSHA). REFERENCES [1] D. M. Anderson, P. M. Glibert and J. M. Burkholder, “Harmful Algal Blooms and Eutrophication: Nutrients Sources, Composition, and Consequences,” Estuaries, Vol. 25, No. 4, 2002, pp. 704-726. doi:10.1007/BF02804901 [2] K. G. Sellner, G. J. Doucette and G. J. Kirkpatrick, “Harmful Algal Blooms: Causes, Impacts and Detection,” Journal of Industrial Microbiology & Biotechnology, Vol. 30, No. 7, 2003, pp. 383-406. doi:10.1007/s10295-003-0074-9 [3] M. Edwards, D. G. Johns, S. C. Leterme, E. Svendsen and A. J. Richardson, “Regional Climate Change and Harmful Algal Blooms in the Northeast Atlantic,” Limnology and Oceanography, Vol. 512, 2006, pp. 820-829. doi:10.4319/lo.2006.51.2.0820 [4] C. S. Yentsch, B. E. Lapointe, N. Poulton and D. A. Phin- ney, “Anatomy of a Red Tide Bloom off the Southwest Coast of Florida,” Harmful Algae, Vol. 7, No. 6, 2008, pp. 817-826. doi:10.1016/j.hal.2008.04.008 [5] P. Shanmugam, Y. H. Ahn and P. S. Ram, “SeaWiFS Sensing of Hazardous Algal Blooms and Their Underly- ing Mechanisms in Shelf-Slope Waters of the Northwest Pacific during Summer,” Remote Sensing Environment, Vol. 112, No. 7, 2008. pp. 3248-3270. doi:10.1016/j.rse.2008.04.002 [6] S. Xingyu, H. Liangmin, Z. Jianlin, H. Honghui, L. Tao and S. Qiang, “Harmful Algal Blooms (HABs) in Daya Bay, China: An in Situ Study of Primary Production and Environmental Impacts,” Marine Pollution Bulletin, Vol. 58, No. 9, 2009. pp. 1310-1318. doi:10.1016/j.marpolbul.2009.04.030 [7] A. G. Bauman, A. John, C. Burt, D. A. Feary, E. Marquis and P. Usseglio, “Tropical Harmful Algal Blooms: An Emerging Threat to Coral Reef Communities,” Marine Pollution Bulletin, Vol. 60, No. 11, 2010, pp. 2117-2122. doi:10.1016/j.marpolbul.2010.08.015 [8] J. K. Keesing, D. Liu, P. Fearns and R. Garcia, “ Inter- and Intra-Annual Patterns of Ulva Prolifera Green Tides in the Yellow Sea during 2007-2009, their Origin and Relationship to the Expansion of Coastal Seaweed Aqua- culture in China,” Marine Pollution Bulletin, Vol. 62, No. 6, 2011, pp. 1169-1182. doi:10.1016/j.marpolbul.2011.03.040 [9] P. Shanmugam, “A New Bio-Optical Algorithm for the Remote Sensing of Algal Blooms in Complex Ocean Waters,” Journal of Geophysical Research, Vol. 116, 2011, Article ID: C04016, pp. 1-12. [10] S. Prakash, R. Ramesh and M. S. Sheshshayee, “High New Productivity during a Winter Noctiluca scintillans Bloom in the Northeastern Arabian Sea,” Proceedings of 12th ISMAS Symposium cum Workshop on Mass Spec- trometry. [11] A. K. Anoop, P. K. Krishnakumar and M. Rajagopalan, “Trichodesmium erythraeum (Ehrenberg) Bloom along the Southwest Coast of India (Arabian Sea) and Its Im- pact on Trace Metal Concentrations in Seawater,” Estua- rine, Coastal and Shelf Science, Vol. 71, No. 3-4, 2007, pp. 641-646. doi:10.1016/j.ecss.2006.09.012 [12] A. K. Mohanty, K. K. Satpathy, G. Shahu, S. K.Sasmal, B. K. Sahu and R. C. Panigrahy, “Red Tide of Noctiluca scintillans and Its Impact on the Coastal Water Quality of the Near-Shore Waters, off the Rushikulya River, Bay of Bengal,” Current Science, Vol. 93, No. 5, 2007. pp. 616-618. [13] K. K. Satpathy, A. K. Mohanty, G. Sahu, M. V. R. Prasad, R. Venkatesan, U. Natesan and M. Rajan, “On the Oc- currence of Trichodesmium erythraeum (Ehr.) Bloom in the Coastal Waters of Kalpakkam East Coast of India,” Indian Journal of Science and Technology, Vol. 1, No. 2, 2007, pp. 1-9. [14] H. R. Gomes, I. G. Joaquim, S. G. Prabhu Matondkar, G. P. Sushma, R. N. Adnan, G. Al-Azri Prasad and G. Thoppil, “Blooms of Noctiluca Milliaris in the Arabian Sea-An in Situ and Satellite,” Deep-Sea Research I, Vol. 55, No. 6, 2008, pp. 751-765. doi:10.1016/j.dsr.2008.03.003 [15] G. Gopakumar, B. Sulochanan and V. Venkatesan, “Bloom of Noctiluca scintillans (Macartney) in Gulf of Mannar, Southeast Coast of India,” Journal of the Marine Biological Association of India, Vol. 51, No. 1, 2009. pp. 75-80. [16] P. Anantharaman, G. Thirumaran, R. Arumugam, R. Ra- gupathi Raja Kannan, A. Hemalatha, A. Kannathasan, P. Sampathkumar and T. Balasubramanian, “Monitoring of Noctiluca Bloom in Mandapam and Keelakari Coastal Waters: South East Coast of India,” Recent Research in Science and Technology A, Vol. 2, No. 10, 2010, pp. 51- 58. [17] K. B. Padmakumar, B. R. Smitha, L. C. Thomas, C. L. Fanimo, G. SreeRenjima, N. R. Menon and V. N. San- jeevan, “Blooms of Trichodesmium erythareum in the South Eastern Arabian Sea during the Onset of 2009 Summer Monsoon,” Ocean Science Journal, Vol. 45, No. 3, 2010, pp. 151-157. Copyright © 2012 SciRes. ARS  A. SIMON, P. SHANMUGAM 50 [18] M. L. Richlen, S. L. Morton, E. A. Jamali, A. Rajan and D. M. Anderson, “The Catastrophic 2008-2009 Red Tide in the Arabian Gulf Region, with Observations on the Identification and Phylogeny of the Fish-Killing Dinoflagellate Cochlodinium polykrikoides,” Harmful Algae, Vol. 9, No. 2, 2009, pp. 163-172. doi:10.1016/j.hal.2009.08.013 [19] J. E. O’Reilly, S. Maritorena, B. G. Mitchell, D. A. Siegel, K. L. Carder, S. A. Garver, M. Kahru and C. McClain, “Ocean Color Chlorophyll Algorithms for SeaWiFS,” Journal of Geophysical Research, Vol. 103, No. C11, 1998, pp. 24937-24953. doi:10.1029/98JC02160 [20] J. E. O’Reilly, et al., “Ocean Color Chlorophyll a Algo- rithms for Sea-WiFS, OC2, and OC4: Version 4, in SeaWiFS Postlaunch Calibration and Validation Analy- ses,” Part 3, SeaWiFS Postlaunch Tech. Rep. Ser., Vol. 11, 2000, pp. 9-23. [21] A. Morel and L. Prieur, “Analysis of Variations in Ocean Color,” Limnology and Oceanography, Vol. 22, No. 4, 1977, pp. 709-722. doi:10.4319/lo.1977.22.4.0709 [22] S. Sathyendranath (Ed.), “Remote Sensing of Ocean Color in Coastal, and Other Optically Complex, Waters,” Int. Ocean-Color Coord. Group Rep. 3. 2000. [23] M. Darecki and D. Stramski, “An Evaluation of MODIS and Sea-WiFS Bio-Optical Algorithms in the Baltic Sea,” Remote Sensing of Environment, Vol. 89, No. 3, 2004, pp. 326-350. doi:10.1016/j.rse.2003.10.012 [24] T. T. Wynne, R. P. Stumpf, M. C. Tomlinson, V. Ransi- brahmanakul and T. A. Villareal, “Detecting Karenia Bre- vis Blooms and Algal Resuspension in the Western Gulf of Mexico with Satellite Ocean Color Imagery,” Harmful Algae, Vol. 4, No. 6, 2005, pp. 992-1003. doi:10.1016/j.hal.2005.02.004 [25] R. P. Stumpf, “Applications of Satellite Ocean Color Sensors for Monitoring and Predicting Harmful Algal Blooms,” Human and Ecological Risk Assessment, Vol. 7, No. 5, 2001, pp. 1363-1368. doi:10.1080/20018091095050 [26] A. Subramaniam, C. W. Brown, R. R. Hood, E. J. Car- penter and D. G. Capone, “Detecting Trichodesmium blooms in SeaWiFS imagery,” Deep Sea Research Part II: Topical Studies in Oceanography, Vol. 49, No. 1-3, 2001, pp. 107-121. doi:10.1016/S0967-0645(01)00096-0 [27] M. C. Tomlinson, “Evaluation of the Use of SeaWiFS Imagery for Detecting Karenia brevis Harmful Algal Blooms in the Eastern Gulf of Mexico,” Remote Sensing of Environment, Vol. 91, no. 3-4, 2004, pp. 293-303. doi:10.1016/j.rse.2004.02.014 [28] C. Hu, “A Novel Ocean Color Index to Detect Floating Algae in the Global Oceans,” Remote Sensing of Envi- ronment, Vol. 113, No. 10, 2009, pp. 2118-2129. doi:10.1016/j.rse.2009.05.012 [29] J. F. R. Gower and G. A. Borstad, “Mapping of Phyto- plankton by Solar-Stimulated Fluorescence Using an Im- aging Spectrometer,” International Journal of Remote Sensing, Vol. 11, No. 2, 1990, pp. 313-320. doi:10.1080/01431169008955022 [30] Y. H. Ahn and P. Shanmugam, “Detecting Red Tides from Satellite Ocean Color Observations in Optically Complex Northeast-Asia Coastal Waters,” Remote Sens- ing of Environment, Vol. 103, No. 4, 2006, pp. 419-437. doi:10.1016/j.rse.2006.04.007 [31] T. Kutser, L. N. Metsamaa, Strombeck and E. Vahtma, “Monitoring cyanobacterial Blooms by Satellite Remote Sensing,” Estuarine, Coastal and Shelf Science, Vol. 67, No. 1-2, 2006, pp. 303-312. doi:10.1016/j.ecss.2005.11.024 [32] J. P. Cannizzaro, K. L. Carder, F. R. Chen, C. A. Heil and G. A. Vargo, “A Novel Technique for Detection of the Toxic Dinoflagellate Karenia brevis in the Gulf of Mex- ico from Remotely Sensed Ocean Color Data,” Conti- nental Shelf Research, Vol. 28, No. 1, 2008, pp. 137-158. doi:10.1016/j.csr.2004.04.007 [33] P. Shanmugam, “SeaDAS Atmospheric Correction Algo- rithm to Improve Retrievals of Surface Reflectance in Case 2 Waters,” Paper Presented at Ocean Optics XX, Oceanogr. Soc., Anchorage, Alaska, 25 Sept. to 1 Oct. 2010. [34] R. K. Sarangi, P. Chauhan and S. R. Nayak, “Detection and Monitoring of Trichodesimium Blooms in the Coastal Waters off Saurashtra Coast, India Using IRS-P4 OCM Data,” Current Science, Vol. 86, 2004, pp. 1636-1641. [35] H. A. Gheilani, “Occurrences of Red Tide Blooms in Coastal Waters of Oman: An Overview,” Available from: http://omancoast.org/component/option,com_docman/tas k,cat_view/gid,20/Itemi,26/ [36] A. Gitelson, Y. A. Grits, D. Etzion, Z. Ning and A. Richmond, “Optical Properties of Nannochloropsis sp. and Their Application to Remote Estimation of Cell Mass,” Biotechnology and Bioengineering, Vol. 69, No. 5, 2000, pp. 516-525. doi:10.1002/1097-0290(20000905)69:5<516::AID-BIT6> 3.0.CO;2-I [37] Y. Huot, C. A. Brown and J. J. Cullen, “New Algorithms for MODIS Sun-Induced Chlorophyll Fluorescence and a Comparison with Present Data Products,” Limnology and Oceanography, Vol. 3, 2005, pp. 108-130. doi:10.4319/lom.2005.3.108 [38] Y. H. Ahn and P. Shanmugam, “Derivation and Analysis of the Fluorescence Algorithms to Estimate Phytoplank- ton Pigment Concentrations in Optically Complex Coastal Waters,” Journal of Optics A: Pure and Applied Optics, Vol. 9, No. 4, 2007, pp. 352-362. doi:10.1088/1464-4258/9/4/008 [39] G. A. Borstad, J. F. A .Gower and E. J. Carpenter, “De- velopment of Algorithms for Remote Sensing of Tricho- desmium Blooms,” Marine Pelagic Cyanobacteria: Trichodesmium and Other Diazotrophs, Springer, 1992, pp. 193-210. [40] J. C. Deborah, “Spectral properties and Population Dy- namics of the Harmful Cochlodinium Polykrikoides (Margalef) in South Western Puerto Rico,” Thesis Sub- mitted in Partial Fulfillment of the Requirements for the Degree of Doctor of Philosophy in Marine Sciences (Bio- Copyright © 2012 SciRes. ARS  A. SIMON, P. SHANMUGAM Copyright © 2012 SciRes. ARS 51 logical Oceanography) University Of Puerto Rico May- aguez Campus, 2008. [41] M. Story and R. G. Congalton, “Accuracy Assessment: A User’s Perspective,” Photogrammetric Engineering and Remote Sensing, Vol. 52, No. 3, 1986, pp. 223-227. [42] J. A. Richards, “Classifier Performance and Map Accu- racy,” Remote Sensing of Environment, Vol. 57, No. 3, 1996, pp. 161-166. doi:10.1016/0034-4257(96)00038-7 [43] C. Liu, P. Frazier and L. Kumar, “Comparative Assess- ment of the Measures of Thematic Classification Accu- racy,” Remote Sensing of Environment, Vol. 107, No. 4, 2007, pp. 606-616. doi:10.1016/j.rse.2006.10.010 [44] National Institute of Ocenography (NIO) Report, 2009. [45] P. J. Harrison, K. Furuya, P. M. Glibert, J. Xu, H. B. Liu, K. Yin, J. H. W. Lee, D. M. Anderson, R. Gowen, A. R. Al-Azri and A. Y. T. Ho, “Geographical Distribution of Red and Green Noctiluca scintillans,” Chinese Journal of Oceanology and Limnology, Vol. 29, No. 4, 2011, pp. 807-831. doi:10.1007/s00343-011-0510-z [46] D. A. Siegel, M. Wang, S. Maritorena and W. Robinson, “Atmospheric Correction of Satellite Ocean Color Im- agery: The Black Pixel Assumption” Applied Optics, Vol. 39, No. 21, 2000, pp. 3582-3591. doi:10.1364/AO.39.003582 [47] M. Wang, and W. Shi, “Estimation of Ocean Contribution at the MODIS Near-Infrared Wavelengths along the East Coast of the U.S.: Two Case Studies,” Geophysical re- search Letters, Vol. 32, 2005, L13606. [48] P. Shanmugam and Y. H. Ahn, “New Atmospheric Cor- rection Technique to Retrieve the Ocean Color from SeaWiFS imagery in Complex Coastal Waters,” Journal of Optics A: Pure and Applied Optics, Vol. 9, No. 5, 2007, pp. 511-530. doi:10.1088/1464-4258/9/5/016 [49] S. G. Liew, L. K. Kwoh and H. Lim, “Classification of Algal Bloom Types from Remote Sensing Reflectance,” Proceedings of 21st Asian conference on Remote Sensing, Vol. 2, 2000, pp. 794-799. [50] P. I. Miller, D. J. Shutler, G. F. Moore and B. S. Groom, “SeaWiFS Discrimination of Harmful Algal Bloom Evo- lution,” International Journal of Remote Sensing, Vol. 27, No. 11, 2006, pp. 2287-2301. doi:10.1080/01431160500396816 [51] Gitelson, J. F. Schalles, D. C. Rundquist, F. R. Schiebe and Y. Z. Yacobi, “Comparative Reflectance Properties of Algal Cultures with Manipulated Densities,” Journal of Applied Phycology, Vol. 11, No. 4, 1999, pp. 345-354. doi:10.1023/A:1008143902418
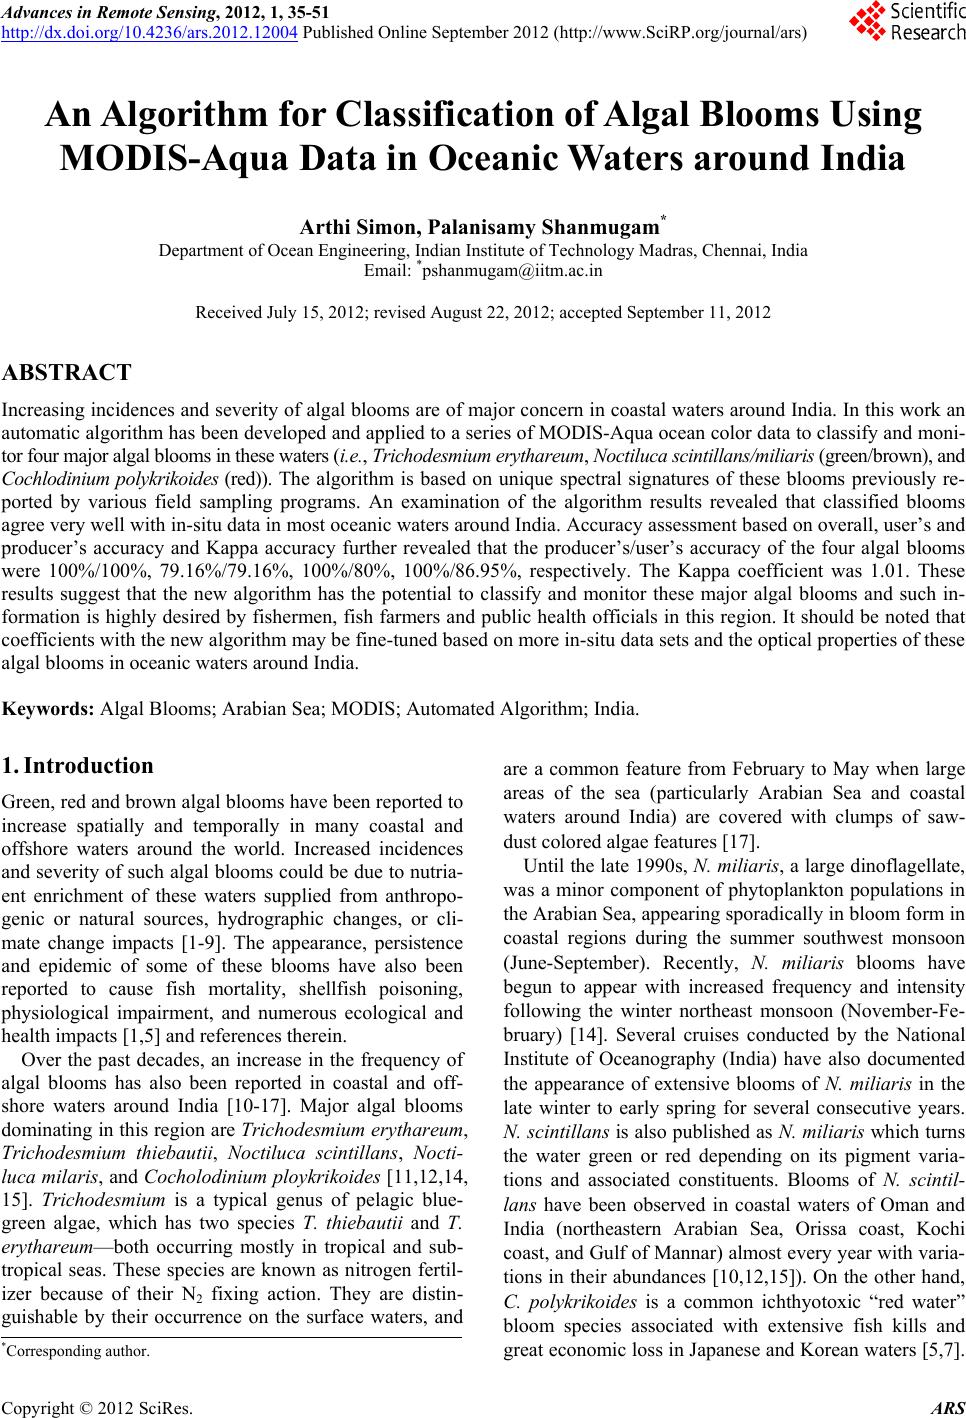
|