Paper Menu >>
Journal Menu >>
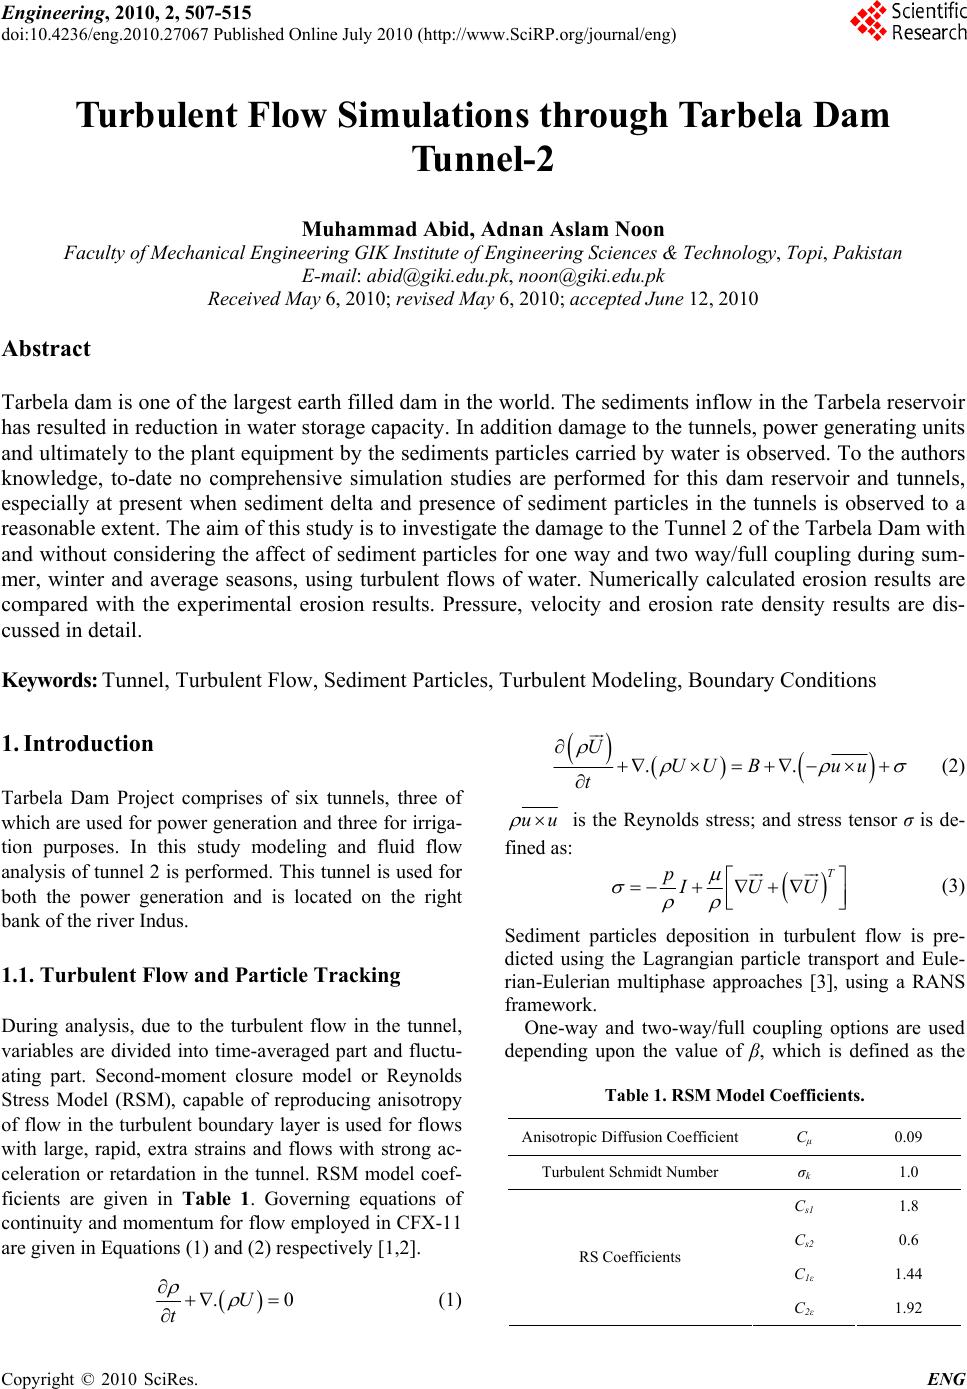 Engineering, 2010, 2, 507-515 doi:10.4236/eng.2010.27067 Published Online July 2010 (http://www.SciRP.org/journal/eng) Copyright © 2010 SciRes. ENG 507 Turbulent Flow Simulations through Tarbela Dam Tunnel-2 Muhammad Abid, Adnan Aslam Noon Faculty of Mechanical Engineering GIK Institute of Engineering Sciences & Technology, Topi, Pakistan E-mail: abid@giki.edu.pk, noon@giki.edu.pk Received May 6, 2010; revised May 6, 2010; accepted June 12, 2010 Abstract Tarbela dam is one of the largest earth filled dam in the world. The sediments inflow in the Tarbela reservoir has resulted in reduction in water storage capacity. In addition damage to the tunnels, power generating units and ultimately to the plant equipment by the sediments particles carried by water is observed. To the authors knowledge, to-date no comprehensive simulation studies are performed for this dam reservoir and tunnels, especially at present when sediment delta and presence of sediment particles in the tunnels is observed to a reasonable extent. The aim of this study is to investigate the damage to the Tunnel 2 of the Tarbela Dam with and without considering the affect of sediment particles for one way and two way/full coupling during sum- mer, winter and average seasons, using turbulent flows of water. Numerically calculated erosion results are compared with the experimental erosion results. Pressure, velocity and erosion rate density results are dis- cussed in detail. Keywords: Tunnel, Turbulent Flow, Sediment Particles, Turbulent Modeling, Boundary Conditions 1. Introduction Tarbela Dam Project comprises of six tunnels, three of which are used for power generation and three for irriga- tion purposes. In this study modeling and fluid flow analysis of tunnel 2 is performed. This tunnel is used for both the power generation and is located on the right bank of the river Indus. 1.1. Turbulent Flow and Particle Tracking During analysis, due to the turbulent flow in the tunnel, variables are divided into time-averaged part and fluctu- ating part. Second-moment closure model or Reynolds Stress Model (RSM), capable of reproducing anisotropy of flow in the turbulent boundary layer is used for flows with large, rapid, extra strains and flows with strong ac- celeration or retardation in the tunnel. RSM model coef- ficients are given in Table 1. Governing equations of continuity and momentum for flow employed in CFX-11 are given in Equations (1) and (2) respectively [1,2]. .U t .. U UU Buu t (2) uu is the Reynolds stress; and stress tensor σ is de- fined as: T pIUU (3) Sediment particles deposition in turbulent flow is pre- dicted using the Lagrangian particle transport and Eule- rian-Eulerian multiphase approaches [3], using a RANS framework. One-way and two-way/full coupling options are used depending upon the value of β, which is defined as the Table 1. RSM Model Coefficients. Anisotropic Diffusion Coefficient Cμ 0.09 Turbulent Schmidt Number σk 1.0 Cs1 1.8 Cs2 0.6 C1ε 1.44 RS Coefficients C2ε 1.92 0 (1) 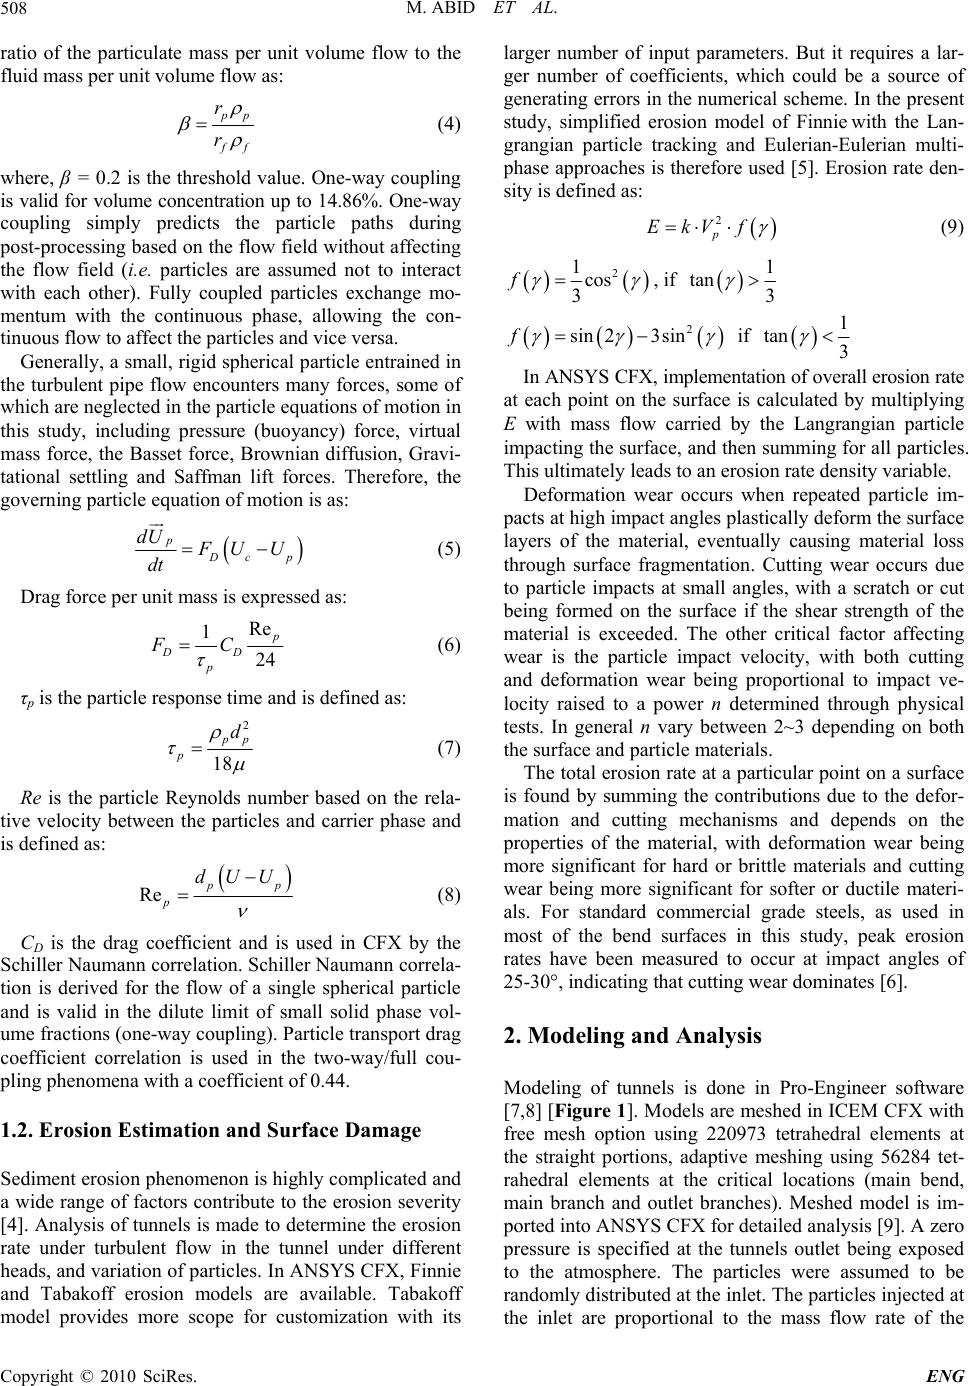 M. ABID ET AL. 508 ratio of the particulate mass per unit volume flow to the fluid mass per unit volume flow as: p p f f r r (4) where, β = 0.2 is the threshold value. One-way coupling is valid for volume concentration up to 14.86%. One-way coupling simply predicts the particle paths during post-processing based on the flow field without affecting the flow field (i.e. particles are assumed not to interact with each other). Fully coupled particles exchange mo- mentum with the continuous phase, allowing the con- tinuous flow to affect the particles and vice versa. Generally, a small, rigid spherical particle entrained in the turbulent pipe flow encounters many forces, some of which are neglected in the particle equations of motion in this study, including pressure (buoyancy) force, virtual mass force, the Basset force, Brownian diffusion, Gravi- tational settling and Saffman lift forces. Therefore, the governing particle equation of motion is as: p D cp dU F UU dt (5) Drag force per unit mass is expressed as: Re 1 24 p DD p FC (6) τp is the particle response time and is defined as: 2 18 p p p d (7) Re is the particle Reynolds number based on the rela- tive velocity between the particles and carrier phase and is defined as: Re p p p dUU (8) CD is the drag coefficient and is used in CFX by the Schiller Naumann correlation. Schiller Naumann correla- tion is derived for the flow of a single spherical particle and is valid in the dilute limit of small solid phase vol- ume fractions (one-way coupling). Particle transport drag coefficient correlation is used in the two-way/full cou- pling phenomena with a coefficient of 0.44. 1.2. Erosion Estimation and Surface Damage Sediment erosion phenomenon is highly complicated and a wide range of factors contribute to the erosion severity [4]. Analysis of tunnels is made to determine the erosion rate under turbulent flow in the tunnel under different heads, and variation of particles. In ANSYS CFX, Finnie and Tabakoff erosion models are available. Tabakoff model provides more scope for customization with its larger number of input parameters. But it requires a lar- ger number of coefficients, which could be a source of generating errors in the numerical scheme. In the present study, simplified erosion model of Finnie with the Lan- grangian particle tracking and Eulerian-Eulerian multi- phase approaches is therefore used [5]. Erosion rate den- sity is defined as: 2 p EkV f (9) 2 1cos 3 f , if 1 tan 3 2 sin 23sinf if 1 tan3 In ANSYS CFX, implementation of overall erosion rate at each point on the surface is calculated by multiplying E with mass flow carried by the Langrangian particle impacting the surface, and then summing for all particles. This ultimately leads to an erosion rate density variable. Deformation wear occurs when repeated particle im- pacts at high impact angles plastically deform the surface layers of the material, eventually causing material loss through surface fragmentation. Cutting wear occurs due to particle impacts at small angles, with a scratch or cut being formed on the surface if the shear strength of the material is exceeded. The other critical factor affecting wear is the particle impact velocity, with both cutting and deformation wear being proportional to impact ve- locity raised to a power n determined through physical tests. In general n vary between 2~3 depending on both the surface and particle materials. The total erosion rate at a particular point on a surface is found by summing the contributions due to the defor- mation and cutting mechanisms and depends on the properties of the material, with deformation wear being more significant for hard or brittle materials and cutting wear being more significant for softer or ductile materi- als. For standard commercial grade steels, as used in most of the bend surfaces in this study, peak erosion rates have been measured to occur at impact angles of 25-30°, indicating that cutting wear dominates [6]. 2. Modeling and Analysis Modeling of tunnels is done in Pro-Engineer software [7,8] [Figure 1]. Models are meshed in ICEM CFX with free mesh option using 220973 tetrahedral elements at the straight portions, adaptive meshing using 56284 tet- rahedral elements at the critical locations (main bend, main branch and outlet branches). Meshed model is im- ported into ANSYS CFX for detailed analysis [9]. A zero pressure is specified at the tunnels outlet being exposed to the atmosphere. The particles were assumed to be randomly distributed at the inlet. The particles injected at the inlet are proportional to the mass flow rate of the Copyright © 2010 SciRes. ENG  M. ABID ET AL.509 water flowing into the tunnel. Details of the Tunnel 2 are summarized in Table 2. The sediment particles volume fraction is only 0.007% at the high head during the months of July, August and September, which increases to 6.1% at the minimum head level in the months of March, April, May and June as per data collected in May 2008 [10]. Both the frac- tions fall in the one-way coupling phenomena. The sam- ples collected in February 2010 showed that the concen- tration of sediment particle has increased to 19.6% which lies in the full coupling region as it crosses the threshold value of 14.86%. The analysis reveal that the continuous flow changes to dispersed flow and flow field is now affected by the sediment particles, which is critical for the damage caused by erosion. Standard no-slip wall functions were applied at all solid surfaces for the fluid phase and the coefficient of restitution for the particles was taken as 0.9 for the parallel coefficient and 1.0 for the perpendicular coefficient. During analysis, air relieve valves are excluded in the geometry which might affect the water velocities and pressures at different locations of the tunnels. Boundary and initial Conditions applied are summa- rized in Table 3. The list of other input parameters is shown in Table 4. Navier–Stokes equations for mass, momentum and fluid turbulence were solved within the commercial code CFX-11 using a finite volume tech- nique. Convection terms in the momentum equations were discretised using a second-order accurate scheme. 3. Results and Discussion 3.1. One Way and Two Way/Full Coupling at All Heads with Sediment Particles 3.1.1. Velocity Maximum velocity of the sediment particles 49.76, 61.28 and 72.25 m/s for one way coupling and 29.7, 38.1 and 44.9 m/s for two way/full coupling is observed at low, medium and high head of water respectively at the inner periphery of the main bend. After the main bend, veloc- ity decreases to 37.45, 46.07 and 60.03 m/s for one way coupling and 17.6, 22.5 and 26.6 m/s for two way/full coupling respectively at low, medium and high water heads. Velocity finally reduces to 12.70, 15.65 and 24.44 m/s for one way coupling and 14.6, 14.8 and 17.4 m/s for two way/full coupling when the water flow is fully de- veloped at 150 m from the vertical section at low, me- dium and high water head respectively. The velocity in- creases abruptly at the outlet branches due to reduction in area at these locations. 3.1.2. Pressure Maximum pressure of the sediment particles 803, 1300 and 1800 kPa for one way coupling and 469, 772 and 1072 kPa for two way/full coupling is observed at the fully developed flow location i.e. 150 m from the vertical section at low, medium and high water heads respec- tively. Minimum pressure 33, 102 and 140 kPa for one way coupling and 20, 33 and 45 kPa for two way/full coupling is observed at the inner periphery of main bend where the velocity has it highest value respectively at low, medium and high water heads. The pressure de- creases abruptly at the main branch and at the outlet branches due to increase in the velocity at these loca- tions. 3.1.3. Erosion Rate Density Maximum erosion rate density of the sediment particles 6.23 × 10⁻⁵, 8.56 × 10⁻⁵, 11.17 × 10⁻⁵ kg s-1 m-2 for one way coupling and 8.69 × 10⁻⁵, 11.36 × 10⁻⁵, 15.13 × 10⁻⁵ kg s-1 m-2 for two way/full coupling is observed at low, medium and high head of water respectively at the inner periphery of the main bend. It changes abruptly at the main branch and at the outlet branches due to the higher impact velocity and impact angle at these locations. Table 2. Details of tunnel. Length (m) 858.7 Inlet Elevation (m) 373 Elevation of straight portion (m) 339.16 Inlet Diameter (m) 10.96 Outlet Branch Diameter (m) 4.87 Outlet Elevation (m) 337.11 High Head (kPa) 578.30 Medium Head (kPa) 950.91 Low Head (kPa) 1323.53 Average volume flow rate (m3/s) 978.63 Quantity of turbines for power generation (Nos) 6 Capacity of each Turbine (MW) 175 For six Turbines (MW) 1050 Table 3. Boundary conditions and Initial conditions. Type Head Value Low 578.30 Medium 950.91 BCs Pressure (P) kPa High 1323.53 Low 7.57 Medium 10.33 ICs Velocity (V) ms-1 High 11.55 Copyright © 2010 SciRes. ENG  M. ABID ET AL. Copyright © 2010 SciRes. ENG 510 Figure 1. Tunnel model. Figure 2. Tunnel mesh. Table 4. Input parameters used in ANSYS CFX. Sr # Parameter Details Numerical numbers 1 Erosion model Finnie k = 1.0 and n = 2.0 2 Particles injection Uniform injection at the tunnel inlet 6.1% particles for one-way coupling and more than 15% particles for full coupling 3 Restitution coefficients Parallel and perpendicular based on impact and rebound velocities 0.9 and 1.0 4 Drag force Schiller and Naumann correlation for the evaluation of drag coefficient 0.00 5 Numerical Scheme Specified blend factor 1.0 6 Particle integration Tracking distance and time 958.70 m and 300 s  M. ABID ET AL. Copyright © 2010 SciRes. ENG 511 3.2. Effect of Coupling at the High Head Velocity, pressure and erosion rate density is the highest at high head during the months of July, August and Sep- tember at different locations. Velocity, pressure and ero- sion density rate profiles at critical locations for one way and two way/full coupling at high head are shown in Figures 3-5 and Figures 6, 7 respectively. Over the time due to the movement of sediment delta towards the tunnels inlet, increase in the concentration of sediment particles is resulting full coupling. Velocity of the sediment particles decreased in the full coupling at all the heads, affecting complete flow field. An increase of 5% sediment particles increased the velocity about 59.7% and decreased pressure about 90%. This concludes the importance of two phase flow (full coupling) of the solid particles flowing in the wa- ter tunnel. It is also observed that the local pressure of the two phase mixture at all the heads is increased due to the de- crease in the local velocity. Erosion rate density observed increased almost 20% because of the higher number of sediment particles striking the tunnel walls with higher velocity. 3.3. Effect of No Sedimentation at High Head Negligible increase of less than 2% in velocity and pres- sure is observed for the flow without the sediment parti- cles flowing through the tunnel. This concludes that the flow field is uneffected in one way coupling. Erosion for flow without the sediment particles is concluded due to the turbulent eddies present at the walls of the tunnels at the critical locations. (a) (b) (c) (d) Figure 3. One way coupling with sediments: Velocity profiles at high head at: (a) Main bend; (b) Main branch; (c), (d) Outlet branches. (a) (b) (c) (d) Figure 4. One way coupling with sediments: Pressure profiles at high head at: (a) Main bend; (b) Main branch; (c), (d) Outlet branches.  M. ABID ET AL. 512 (a) (b) (c) (d) Figure 5. One way coupling with sediments: Erosion rate density profiles at: (a) Main bend; (b) Main branch; (c), (d) Outlet branches. (a) (b) (c) (d) Figure 6. Two way/Full coupling with sediments: Velocity profiles at high head at: (a) Main bend; (b) Main branch; (c), (d) Outlet branches. (a) (b) (c) (d) Figure 7. Two way/Full coupling with sediments: Pressure profiles at high head at: (a) Main bend; (b) Main branch; (c), (d) branches. Outlet Copyright © 2010 SciRes. ENG  M. ABID ET AL. 513 3.4. Erosion Rate Density as a Function of Impact Velocity and Impact Angle Erosion rate density increases for increase in velocity and impact angle because erosion rate is a function of impact speed and impact angle as defined in Equation (9). 3.5. Critical Period and Flow Type for Erosion Damage to the Tunnel Table 5 shows that the velocity and pressure is maxi- mum at high head in the months of July, August and September which impedes the erosion rate and is the most critical period. The medium head remains for five months i.e. April, May, June, October, November, when the velocity and pressure are observed moderate. The low head remains for four months i.e. December, January, February and March when the water velocity and pres- sure are observed minimum. Sediment particles volume fraction flowing through the tunnel is increasing rapidly as the sediment delta is moving towards the tunnels. This increase in particle concentration can change continuous flow into dispersed flow and damage to the tunnel can further increase in the future. Table 5. Velocity, pressure and erosion rate density for tunnel at high head. Location Results Criteria Main Bend After bend Main Branch Branch 1Branch 2Branch 3Branch 4 Branch 5 Branch 6 One-way coupling Without Sediments 72.82 60.17 55.23 61.3761.3761.37 61.37 37.19 37.19 With Sediments 72.25 60.03 54.32 60.3060.3060.30 60.30 36.39 36.39 Full coupling Low Sediments 44.89 31.15 35.73 31.1531.2535.73 31.15 31.15 35.73 Velocity (V) ms-1 High Sediments 71.70 50.49 57.48 50.4943.2550.49 50.49 43.25 50.49 One-way coupling Without Sediments 106 1271 378 106 106 106 106 106 106 With Sediments 102 1290 387 102 102 102 102 102 102 Full coupling Low Sediments 45 661 250 45 45 45 45 45 45 Pressure (P) kPa High Sediments 102 1240 386 102 102 102 102 102 102 One-way coupling Without Sediments ------ ----- ------ ------ ------ ------ ------ ------ ------ With Sediments 11.17 5.94 8.84 6.34 6.34 9.16 9.32 5.94 8.23 Full coupling Low Sediments 15.13 7.45 10.34 7.45 7.45 10.33 11.07 6.37 9.73 High Sediments 17.16 8.93 12.67 8.93 8.93 12.69 13.06 8.33 11.83 Impact Velocity (V) ms-1 72.25 60.03 54.32 60.3060.3060.30 60.30 36.39 36.39 Erosion rate density (E) 10-5 kgs-1m-2 Impact Angle, γ 18.5º < γ < 90º γ < 18.5º 18.5º < γ < 90º γ < 18.5ºγ < 18.5º18.5º < γ < 90º 18.5º < γ < 90º γ < 18.5º 18.5º < γ < 90º Copyright © 2010 SciRes. ENG  M. ABID ET AL. 514 4. Experimental Validation Erosion rate density calculated numerically (0.160 kg s-1 m-2) for straight portion of the tunnel is observed in good agreement with the experimental results (0.148 kg s-1 m-2) [1] with a difference of only 8%. 5. Conclusions 1) A CFD-based velocity, pressure and erosion predic- tion procedure through the tunnel. 2) Based on the number of particles flow, one way and two way/full coupling phenomena are highlighted. 3) The emphasis is on the high head because of the higher velocity and erosion rate during July, August and September. 4) The results are shown for nine different locations of critical importance with and without sediment particles flowing through the tunnel where the velocities and pressures may vary causing the erosive damage at these locations. 5) The erosion rate density is the maximum at the main bend and outlet branches due to several reasons like the higher velocity and impact angle, the lower pressure and the production of turbulent eddies. 6) Numerical simulations as well as experimental ero- sion tests are performed. Comparisons show that the CFD-based erosion prediction procedure is able to rea- sonably predict the erosion profile and satisfactorily capture the trend of erosion with respect to the carrier velocity with an error of about 8%. 7) Particle volume fraction flowing through the tunnel is increasing rapidly as the sediment delta is moving to- wards the tunnels. This increase in particle concentration is changing continuous flow to dispersed flow and dam- age to the tunnel is increasing. 6. Acknowledgements Authors acknowledge Pak-US project, WAPDA and UIUC USA in completing this study. 7. References [1] R. J. K Wood and T. F. Jones, “Investigations of Sand- Water Induced Erosive Wear of AISI 304L Stainless Steel Pipes by Pilot-Scale and Laboratory-Scale Testing,” Wear, Vol. 255, No. 1-6, 2003, pp. 206-218. [2] C. Y. Jin, “A Numerical Simulation of Particle Deposi- tion in Turbulent Pipe Flow,” Newcastle University, [3] L. Bouhadji, “Three Dimensional Numerical Simulation of Turbulent Flow Over Spillways,” ASL-AQFlow Inc, Sidney, British Columbia, Canada. [4] X. H. Chen, B. S. McLaury and S. A. Shirazi, “Applica- tion and Experimental Validation of a Computational Fluid Dynamics (CFD)-Based Erosion Prediction Model in Elbows and Plugged Tees,” Computers & Fluids, Vol. 33, No. 10, 2004, pp. 1251-1272. [5] G. Brown, “Use of CFD to Predict and Reduce Erosion in Industrial Slurry Piping System,” 5th International Con- ference on CFD in the Process Industries, CSIRO, Mel- bourne, Australia, December 2006, pp. 13-15. [6] S. Dosanjh and J. A. C. Humphrey, “The Influence of Turbulence on Erosion by a Particle Laden Fluid Jet,” Wear, Vol. 102, No. 4, 1985, pp. 309-330. [7] Civil Engineering Works. “Contract Documents for Con- struction,” Tarbela Dam Project, TAMS, International 16, Vol. 6, 1967. [8] Pro/Engineer. Wildfire Release 4.0©2009. [9] ANSYS CFX Solver Modeling Guide. Release 11.0. © 1996-2006. [10] Sediment Concentration (ppm). Annual Reservoir Sedi- mentation report, Survey and Hydrology Department, Tarbela Dam Project, 2009, pp. 5. Copyright © 2010 SciRes. ENG  M. ABID ET AL. 515 Nomenclature CD drag coefficient dp particle diameter E erosion rate density FD drag force g gravitational acceleration k erosion model constant m particle mass n erosion model constant p fluid pressure Rep particle Reynolds number rp particulate phase volume fraction rf fluid phase volume fraction Uc fluid velocity Up particle velocity U particle relative velocity β particle mass loadings γ particle impact angle ρf fluid density ρp particle density τp particle response time μ fluid dynamic viscosity ν fluid kinematic viscosity Copyright © 2010 SciRes. ENG |