Paper Menu >>
Journal Menu >>
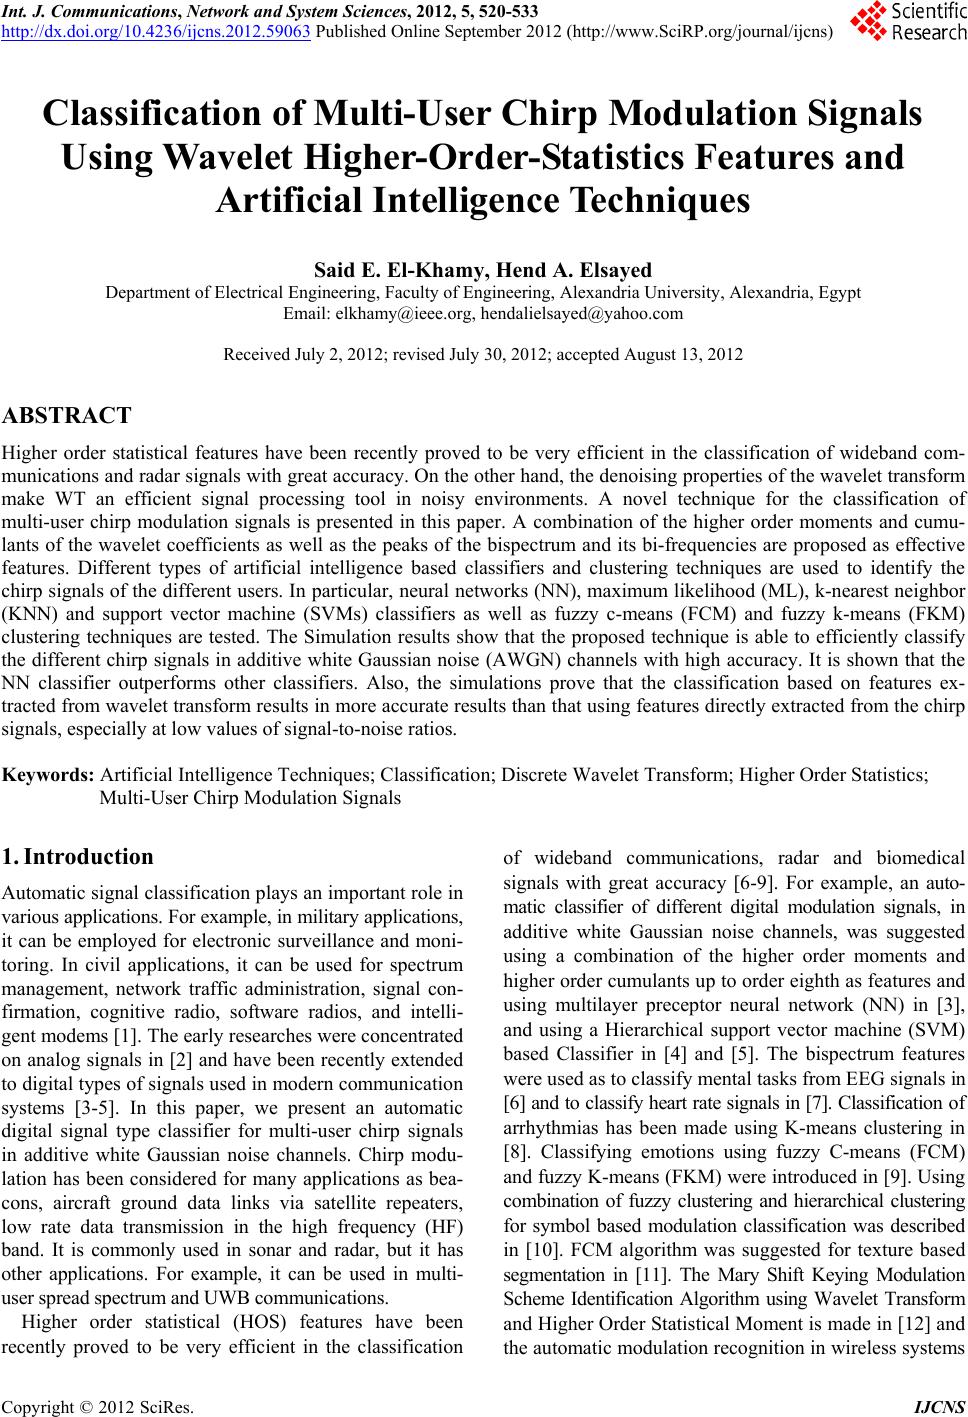 Int. J. Communications, Network and System Sciences, 2012, 5, 520-533 http://dx.doi.org/10.4236/ijcns.2012.59063 Published Online September 2012 (http://www.SciRP.org/journal/ijcns) Classification of Multi-User Chirp Modulation Signals Using Wavelet Higher-Order-Statistics Features and Artificial Intelligence Techniques Said E. El-Khamy, Hend A. Elsayed Department of Electrical Engineering, Faculty of Engineering, Alexandria University, Alexandria, Egypt Email: elkhamy@ieee.org, hendalielsayed@yahoo.com Received July 2, 2012; revised July 30, 2012; accepted August 13, 2012 ABSTRACT Higher order statistical features have been recently proved to be very efficient in the classification of wideband com- munications and radar signals with great accuracy. On the other hand, the denoising properties of the wavelet transform make WT an efficient signal processing tool in noisy environments. A novel technique for the classification of multi-user chirp modulation signals is presented in this paper. A combination of the higher order moments and cumu- lants of the wavelet coefficients as well as the peaks of the bispectrum and its bi-frequencies are proposed as effective features. Different types of artificial intelligence based classifiers and clustering techniques are used to identify the chirp signals of the different users. In particular, neural networks (NN), maximum likelihood (ML), k-nearest neighbor (KNN) and support vector machine (SVMs) classifiers as well as fuzzy c-means (FCM) and fuzzy k-means (FKM) clustering techniques are tested. The Simulation results show that the proposed technique is able to efficiently classify the different chirp signals in additive white Gaussian noise (AWGN) channels with high accuracy. It is shown that the NN classifier outperforms other classifiers. Also, the simulations prove that the classification based on features ex- tracted from wavelet transform results in more accurate results than that using features directly extracted from the chirp signals, especially at low values of signal-to-noise ratios. Keywords: Artificial Intelligence Techniques; Classification; Discrete Wavelet Transform; Higher Order Statistics; Multi-User Chirp Modulation Signals 1. Introduction Automatic signal classification plays an important role in various applications. For example, in military applications, it can be employed for electronic surveillance and moni- toring. In civil applications, it can be used for spectrum management, network traffic administration, signal con- firmation, cognitive radio, software radios, and intelli- gent modems [1]. The early researches were concentrated on analog signals in [2] and have been recently extended to digital types of signals used in modern communication systems [3-5]. In this paper, we present an automatic digital signal type classifier for multi-user chirp signals in additive white Gaussian noise channels. Chirp modu- lation has been considered for many applications as bea- cons, aircraft ground data links via satellite repeaters, low rate data transmission in the high frequency (HF) band. It is commonly used in sonar and radar, but it has other applications. For example, it can be used in multi- user spread spectrum and UWB communications. Higher order statistical (HOS) features have been recently proved to be very efficient in the classification of wideband communications, radar and biomedical signals with great accuracy [6-9]. For example, an auto- matic classifier of different digital modulation signals, in additive white Gaussian noise channels, was suggested using a combination of the higher order moments and higher order cumulants up to order eighth as features and using multilayer preceptor neural network (NN) in [3], and using a Hierarchical support vector machine (SVM) based Classifier in [4] and [5]. The bispectrum features were used as to classify mental tasks from EEG signals in [6] and to classify heart rate signals in [7]. Classification of arrhythmias has been made using K-means clustering in [8]. Classifying emotions using fuzzy C-means (FCM) and fuzzy K-means (FKM) were introduced in [9]. Using combination of fuzzy clustering and hierarchical clustering for symbol based modulation classification was described in [10]. FCM algorithm was suggested for texture based segmentation in [11]. The Mary Shift Keying Modulation Scheme Identification Algorithm using Wavelet Transform and Higher Order Statistical Moment is made in [12] and the automatic modulation recognition in wireless systems C opyright © 2012 SciRes. IJCNS 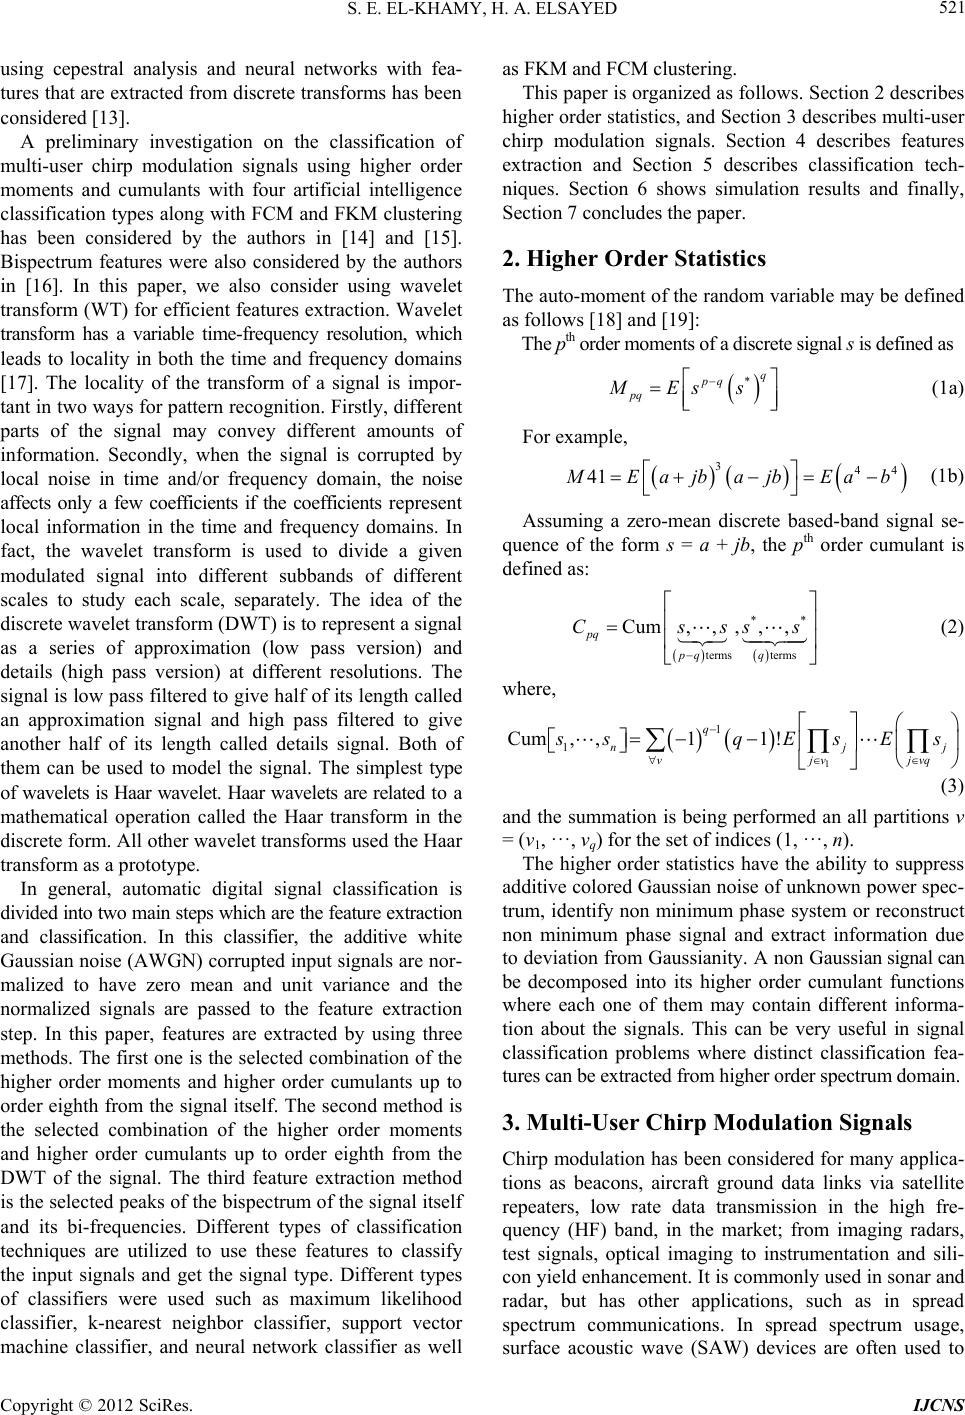 S. E. EL-KHAMY, H. A. ELSAYED 521 using cepestral analysis and neural networks with fea- tures that are extracted from discrete transforms has been considered [13]. A preliminary investigation on the classification of multi-user chirp modulation signals using higher order moments and cumulants with four artificial intelligence classification types along with FCM and FKM clustering has been considered by the authors in [14] and [15]. Bispectrum features were also considered by the authors in [16]. In this paper, we also consider using wavelet transform (WT) for efficient features extraction. Wavelet transform has a variable time-frequency resolution, which leads to locality in both the time and frequency domains [17]. The locality of the transform of a signal is impor- tant in two ways for pattern recognition. Firstly, different parts of the signal may convey different amounts of information. Secondly, when the signal is corrupted by local noise in time and/or frequency domain, the noise affects only a few coefficients if the coefficients represent local information in the time and frequency domains. In fact, the wavelet transform is used to divide a given modulated signal into different subbands of different scales to study each scale, separately. The idea of the discrete wavelet transform (DWT) is to represent a signal as a series of approximation (low pass version) and details (high pass version) at different resolutions. The signal is low pass filtered to give half of its length called an approximation signal and high pass filtered to give another half of its length called details signal. Both of them can be used to model the signal. The simplest type of wavelets is Haar wavelet. Haar wavelets are related to a mathematical operation called the Haar transform in the discrete form. All other wavelet transforms used the Haar transform as a prototype. In general, automatic digital signal classification is divided into two main steps which are the feature extraction and classification. In this classifier, the additive white Gaussian noise (AWGN) corrupted input signals are nor- malized to have zero mean and unit variance and the normalized signals are passed to the feature extraction step. In this paper, features are extracted by using three methods. The first one is the selected combination of the higher order moments and higher order cumulants up to order eighth from the signal itself. The second method is the selected combination of the higher order moments and higher order cumulants up to order eighth from the DWT of the signal. The third feature extraction method is the selected peaks of the bispectrum of the signal itself and its bi-frequencies. Different types of classification techniques are utilized to use these features to classify the input signals and get the signal type. Different types of classifiers were used such as maximum likelihood classifier, k-nearest neighbor classifier, support vector machine classifier, and neural network classifier as well as FKM and FCM clustering. This paper is organized as follows. Section 2 describes higher order statistics, and Section 3 describes multi-user chirp modulation signals. Section 4 describes features extraction and Section 5 describes classification tech- niques. Section 6 shows simulation results and finally, Section 7 concludes the paper. 2. Higher Order Statistics The auto-moment of the random variable may be defined as follows [18] and [19]: The pth order moments of a discrete signal s is defined as *q pq pq MEss (1a) For example, 344 41 M Eajb ajbEa b (1b) Assuming a zero-mean discrete based-band signal se- quence of the form s = a + jb, the pth order cumulant is defined as: ** terms terms Cum,, ,,, pq pq q Csss s j (2) where, 1 1 1 Cum,,11 ! q nj vjv jvq s sqEsE s (3) and the summation is being performed an all partitions v = (v1, ···, vq) for the set of indices (1, ···, n). The higher order statistics have the ability to suppress additive colored Gaussian noise of unknown power spec- trum, identify non minimum phase system or reconstruct non minimum phase signal and extract information due to deviation from Gaussianity. A non Gaussian signal can be decomposed into its higher order cumulant functions where each one of them may contain different informa- tion about the signals. This can be very useful in signal classification problems where distinct classification fea- tures can be extracted from higher order spectrum domain. 3. Multi-User Chirp Modulation Signals Chirp modulation has been considered for many applica- tions as beacons, aircraft ground data links via satellite repeaters, low rate data transmission in the high fre- quency (HF) band, in the market; from imaging radars, test signals, optical imaging to instrumentation and sili- con yield enhancement. It is commonly used in sonar and radar, but has other applications, such as in spread spectrum communications. In spread spectrum usage, surface acoustic wave (SAW) devices are often used to Copyright © 2012 SciRes. IJCNS 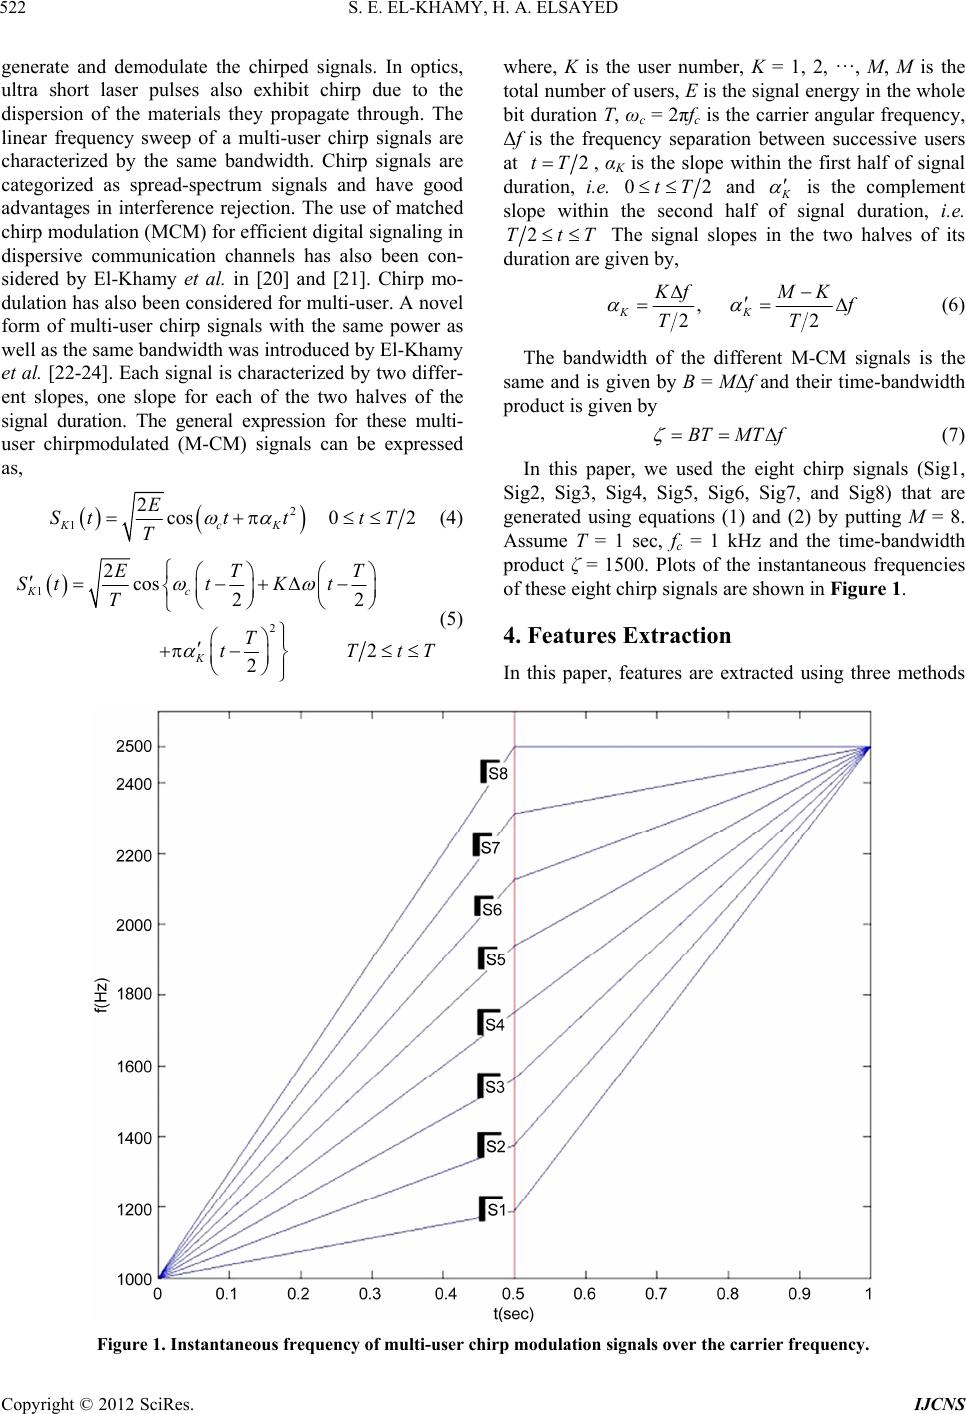 S. E. EL-KHAMY, H. A. ELSAYED Copyright © 2012 SciRes. IJCNS 522 generate and demodulate the chirped signals. In optics, ultra short laser pulses also exhibit chirp due to the dispersion of the materials they propagate through. The linear frequency sweep of a multi-user chirp signals are characterized by the same bandwidth. Chirp signals are categorized as spread-spectrum signals and have good advantages in interference rejection. The use of matched chirp modulation (MCM) for efficient digital signaling in dispersive communication channels has also been con- sidered by El-Khamy et al. in [20] and [21]. Chirp mo- dulation has also been considered for multi-user. A novel form of multi-user chirp signals with the same power as well as the same bandwidth was introduced by El-Khamy et al. [22-24]. Each signal is characterized by two differ- ent slopes, one slope for each of the two halves of the signal duration. The general expression for these multi- user chirpmodulated (M-CM) signals can be expressed as, where, K is the user number, K = 1, 2, ···, M, M is the total number of users, E is the signal energy in the whole bit duration T, ωc = 2πfc is the carrier angular frequency, Δf is the frequency separation between successive users at 2tT , αK is the slope within the first half of signal duration, i.e. 02tT and K is the complement slope within the second half of signal duration, i.e. 2TtT The signal slopes in the two halves of its duration are given by, , 22 KK KfM K f TT (6) The bandwidth of the different M-CM signals is the same and is given by B = MΔf and their time-bandwidth product is given by BTMTf (7) In this paper, we used the eight chirp signals (Sig1, Sig2, Sig3, Sig4, Sig5, Sig6, Sig7, and Sig8) that are generated using equations (1) and (2) by putting M = 8. Assume T = 1 sec, fc = 1 kHz and the time-bandwidth product ζ = 1500. Plots of the instantaneous frequencies of these eight chirp signals are shown in Figure 1. 2 1 2cos0 2 KcK E Stt ttT T (4) 1 2 2cos 22 2 2 Kc K ET T SttK t T T tT tT (5) 4. Features Extraction In this paper, features are extracted using three methods Figure 1. Instantaneous frequency of multi-user chirp modulation signals over the carrier frequency. 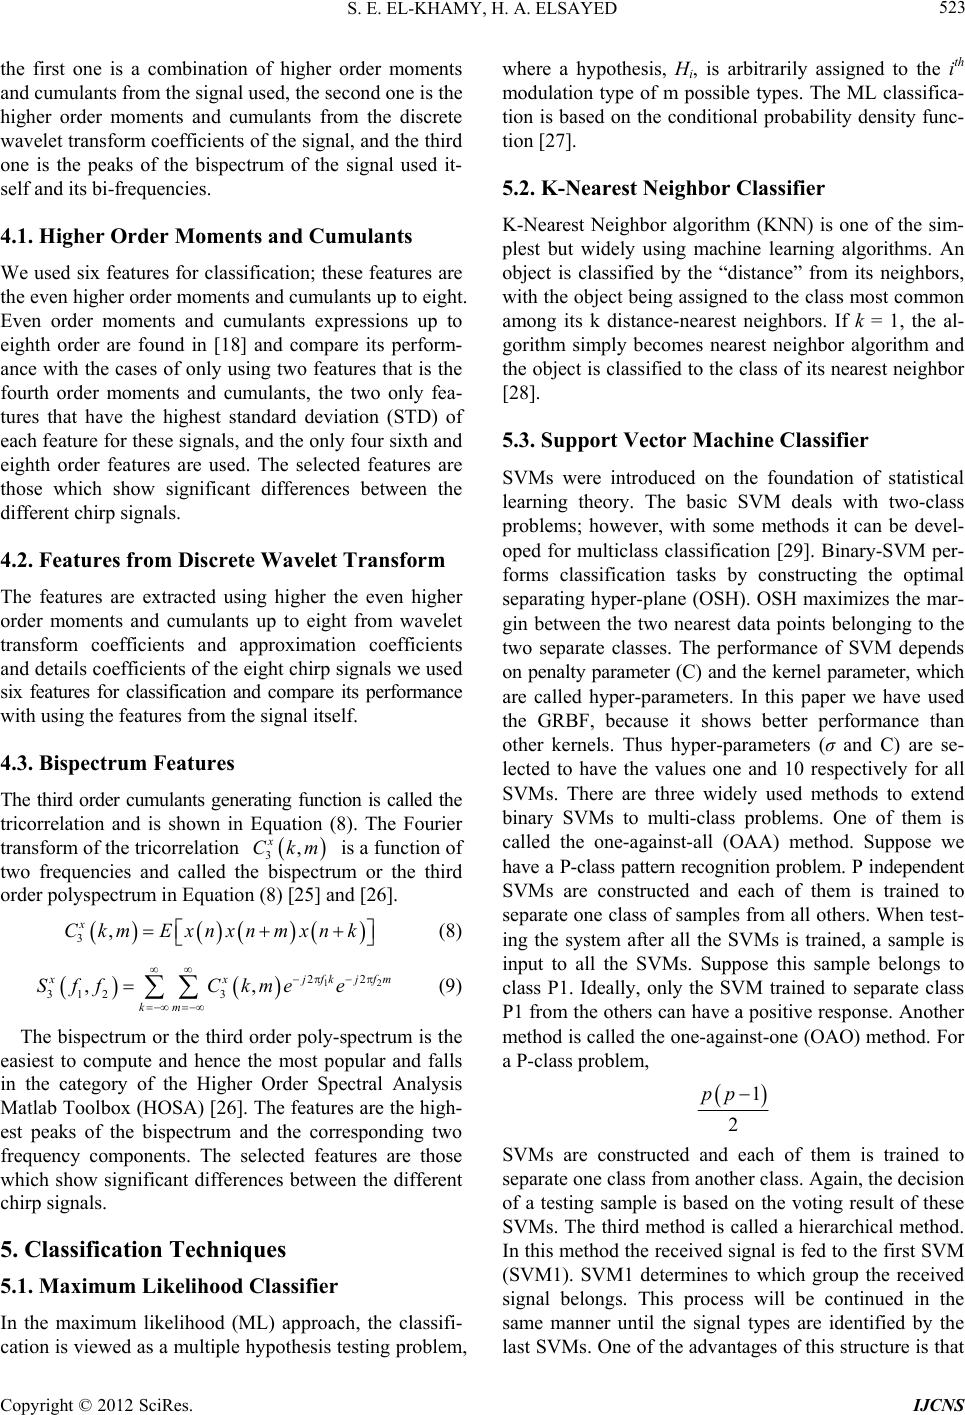 S. E. EL-KHAMY, H. A. ELSAYED 523 the first one is a combination of higher order moments and cumulants from the signal used, the second one is the higher order moments and cumulants from the discrete wavelet transform coefficients of the signal, and the third one is the peaks of the bispectrum of the signal used it- self and its bi-frequencies. 4.1. Higher Order Moments and Cumulants We used six features for classification; these features are the even higher order moments and cumulants up to eight. Even order moments and cumulants expressions up to eighth order are found in [18] and compare its perform- ance with the cases of only using two features that is the fourth order moments and cumulants, the two only fea- tures that have the highest standard deviation (STD) of each feature for these signals, and the only four sixth and eighth order features are used. The selected features are those which show significant differences between the different chirp signals. 4.2. Features from Discrete Wavelet Transform The features are extracted using higher the even higher order moments and cumulants up to eight from wavelet transform coefficients and approximation coefficients and details coefficients of the eight chirp signals we used six features for classification and compare its performance with using the features from the signal itself. 4.3. Bispectrum Features The third order cumulants generating function is called the tricorrelation and is shown in Equation (8). The Fourier transform of the tricorrelation is a function of two frequencies and called the bispectrum or the third order polyspectrum in Equation (8) [25] and [26]. 3, x Ckm 3, x CkmE xnxnmxnk (8) 12 22 312 3 ,, j fkjf m xx km SffCkme e (9) The bispectrum or the third order poly-spectrum is the easiest to compute and hence the most popular and falls in the category of the Higher Order Spectral Analysis Matlab Toolbox (HOSA) [26]. The features are the high- est peaks of the bispectrum and the corresponding two frequency components. The selected features are those which show significant differences between the different chirp signals. 5. Classification Techniques 5.1. Maximum Likelihood Classifier In the maximum likelihood (ML) approach, the classifi- cation is viewed as a multiple hypothesis testing problem, where a hypothesis, Hi, is arbitrarily assigned to the ith modulation type of m possible types. The ML classifica- tion is based on the conditional probability density func- tion [27]. 5.2. K-Nearest Neighbor Classifier K-Nearest Neighbor algorithm (KNN) is one of the sim- plest but widely using machine learning algorithms. An object is classified by the “distance” from its neighbors, with the object being assigned to the class most common among its k distance-nearest neighbors. If k = 1, the al- gorithm simply becomes nearest neighbor algorithm and the object is classified to the class of its nearest neighbor [28]. 5.3. Support Vector Machine Classifier SVMs were introduced on the foundation of statistical learning theory. The basic SVM deals with two-class problems; however, with some methods it can be devel- oped for multiclass classification [29]. Binary-SVM per- forms classification tasks by constructing the optimal separating hyper-plane (OSH). OSH maximizes the mar- gin between the two nearest data points belonging to the two separate classes. The performance of SVM depends on penalty parameter (C) and the kernel parameter, which are called hyper-parameters. In this paper we have used the GRBF, because it shows better performance than other kernels. Thus hyper-parameters (σ and C) are se- lected to have the values one and 10 respectively for all SVMs. There are three widely used methods to extend binary SVMs to multi-class problems. One of them is called the one-against-all (OAA) method. Suppose we have a P-class pattern recognition problem. P independent SVMs are constructed and each of them is trained to separate one class of samples from all others. When test- ing the system after all the SVMs is trained, a sample is input to all the SVMs. Suppose this sample belongs to class P1. Ideally, only the SVM trained to separate class P1 from the others can have a positive response. Another method is called the one-against-one (OAO) method. For a P-class problem, 1 2 pp SVMs are constructed and each of them is trained to separate one class from another class. Again, the decision of a testing sample is based on the voting result of these SVMs. The third method is called a hierarchical method. In this method the received signal is fed to the first SVM (SVM1). SVM1 determines to which group the received signal belongs. This process will be continued in the same manner until the signal types are identified by the last SVMs. One of the advantages of this structure is that Copyright © 2012 SciRes. IJCNS 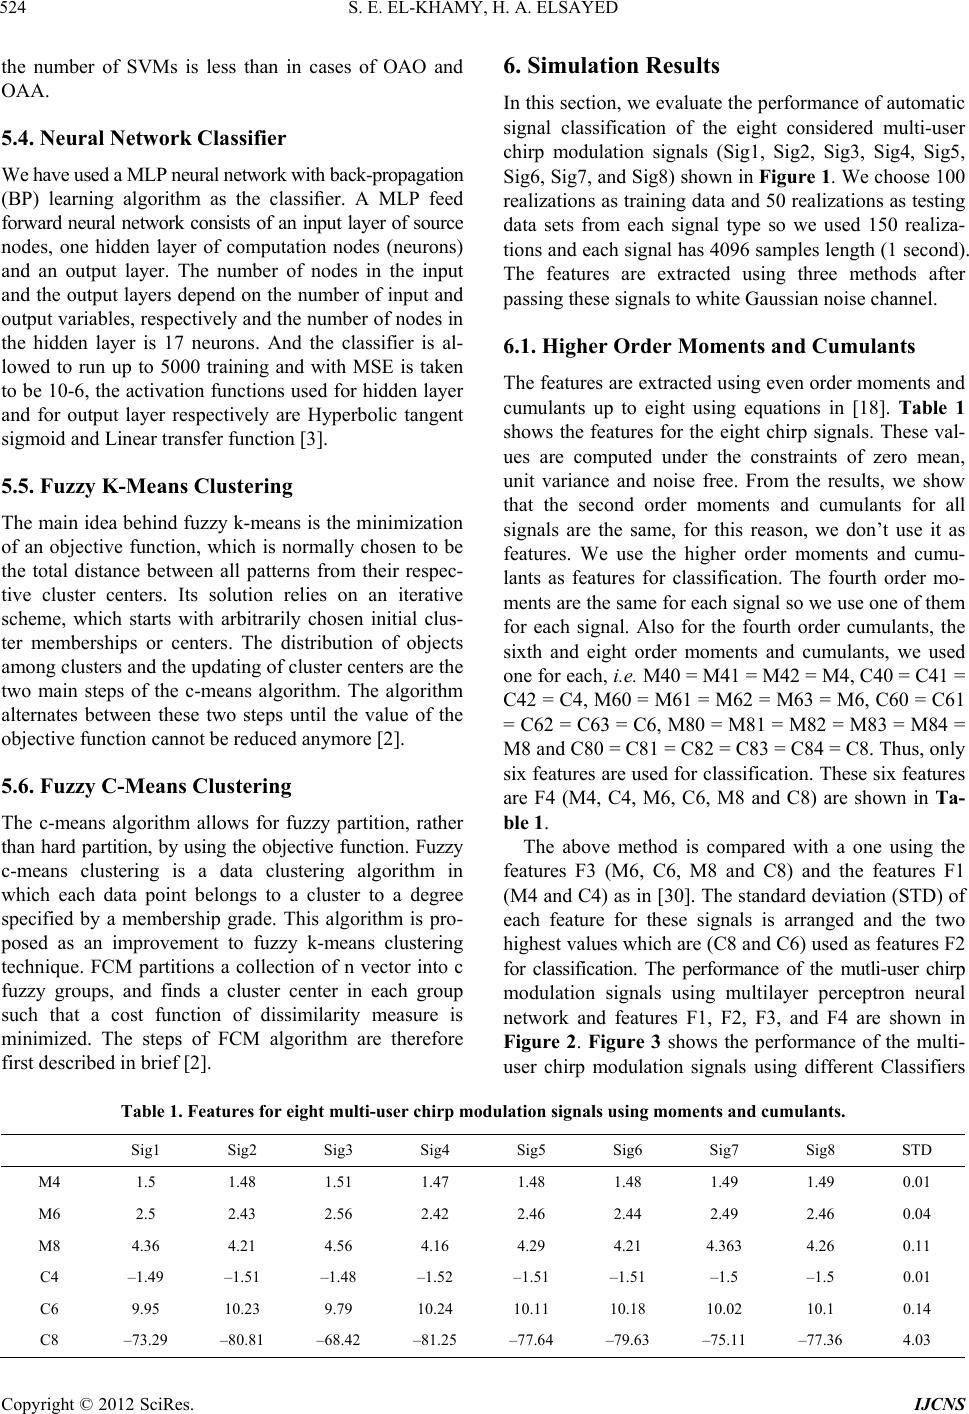 S. E. EL-KHAMY, H. A. ELSAYED 524 the number of SVMs is less than in cases of OAO and OAA. 5.4. Neural Network Classifier We have used a MLP neural network with back-propagation (BP) learning algorithm as the classifier. A MLP feed forward neural network consists of an input layer of source nodes, one hidden layer of computation nodes (neurons) and an output layer. The number of nodes in the input and the output layers depend on the number of input and output variables, respectively and the number of nodes in the hidden layer is 17 neurons. And the classifier is al- lowed to run up to 5000 training and with MSE is taken to be 10-6, the activation functions used for hidden layer and for output layer respectively are Hyperbolic tangent sigmoid and Linear transfer function [3]. 5.5. Fuzzy K-Means Clustering The main idea behind fuzzy k-means is the minimization of an objective function, which is normally chosen to be the total distance between all patterns from their respec- tive cluster centers. Its solution relies on an iterative scheme, which starts with arbitrarily chosen initial clus- ter memberships or centers. The distribution of objects among clusters and the updating of cluster centers are the two main steps of the c-means algorithm. The algorithm alternates between these two steps until the value of the objective function cannot be reduced anymore [2]. 5.6. Fuzzy C-Means Clustering The c-means algorithm allows for fuzzy partition, rather than hard partition, by using the objective function. Fuzzy c-means clustering is a data clustering algorithm in which each data point belongs to a cluster to a degree specified by a membership grade. This algorithm is pro- posed as an improvement to fuzzy k-means clustering technique. FCM partitions a collection of n vector into c fuzzy groups, and finds a cluster center in each group such that a cost function of dissimilarity measure is minimized. The steps of FCM algorithm are therefore first described in brief [2]. 6. Simulation Results In this section, we evaluate the performance of automatic signal classification of the eight considered multi-user chirp modulation signals (Sig1, Sig2, Sig3, Sig4, Sig5, Sig6, Sig7, and Sig8) shown in Figure 1. We choose 100 realizations as training data and 50 realizations as testing data sets from each signal type so we used 150 realiza- tions and each signal has 4096 samples length (1 second). The features are extracted using three methods after passing these signals to white Gaussian noise channel. 6.1. Higher Order Moments and Cumulants The features are extracted using even order moments and cumulants up to eight using equations in [18]. Table 1 shows the features for the eight chirp signals. These val- ues are computed under the constraints of zero mean, unit variance and noise free. From the results, we show that the second order moments and cumulants for all signals are the same, for this reason, we don’t use it as features. We use the higher order moments and cumu- lants as features for classification. The fourth order mo- ments are the same for each signal so we use one of them for each signal. Also for the fourth order cumulants, the sixth and eight order moments and cumulants, we used one for each, i.e. M40 = M41 = M42 = M4, C40 = C41 = C42 = C4, M60 = M61 = M62 = M63 = M6, C60 = C61 = C62 = C63 = C6, M80 = M81 = M82 = M83 = M84 = M8 and C80 = C81 = C82 = C83 = C84 = C8. Thus, only six features are used for classification. These six features are F4 (M4, C4, M6, C6, M8 and C8) are shown in Ta- ble 1. The above method is compared with a one using the features F3 (M6, C6, M8 and C8) and the features F1 (M4 and C4) as in [30]. The standard deviation (STD) of each feature for these signals is arranged and the two highest values which are (C8 and C6) used as features F2 for classification. The performance of the mutli-user chirp modulation signals using multilayer perceptron neural network and features F1, F2, F3, and F4 are shown in Figure 2. Figure 3 shows the performance of the multi- user chirp modulation signals using different Classifiers Table 1. Features for eight multi-user chirp modulation signals using moments and cumulants. Sig1 Sig2 Sig3 Sig4 Sig5 Sig6 Sig7 Sig8 STD M4 1.5 1.48 1.51 1.47 1.48 1.48 1.49 1.49 0.01 M6 2.5 2.43 2.56 2.42 2.46 2.44 2.49 2.46 0.04 M8 4.36 4.21 4.56 4.16 4.29 4.21 4.363 4.26 0.11 C4 –1.49 –1.51 –1.48 –1.52 –1.51 –1.51 –1.5 –1.5 0.01 C6 9.95 10.23 9.79 10.24 10.11 10.18 10.02 10.1 0.14 C8 –73.29 –80.81 –68.42 –81.25 –77.64 –79.63 –75.11 –77.36 4.03 Copyright © 2012 SciRes. IJCNS 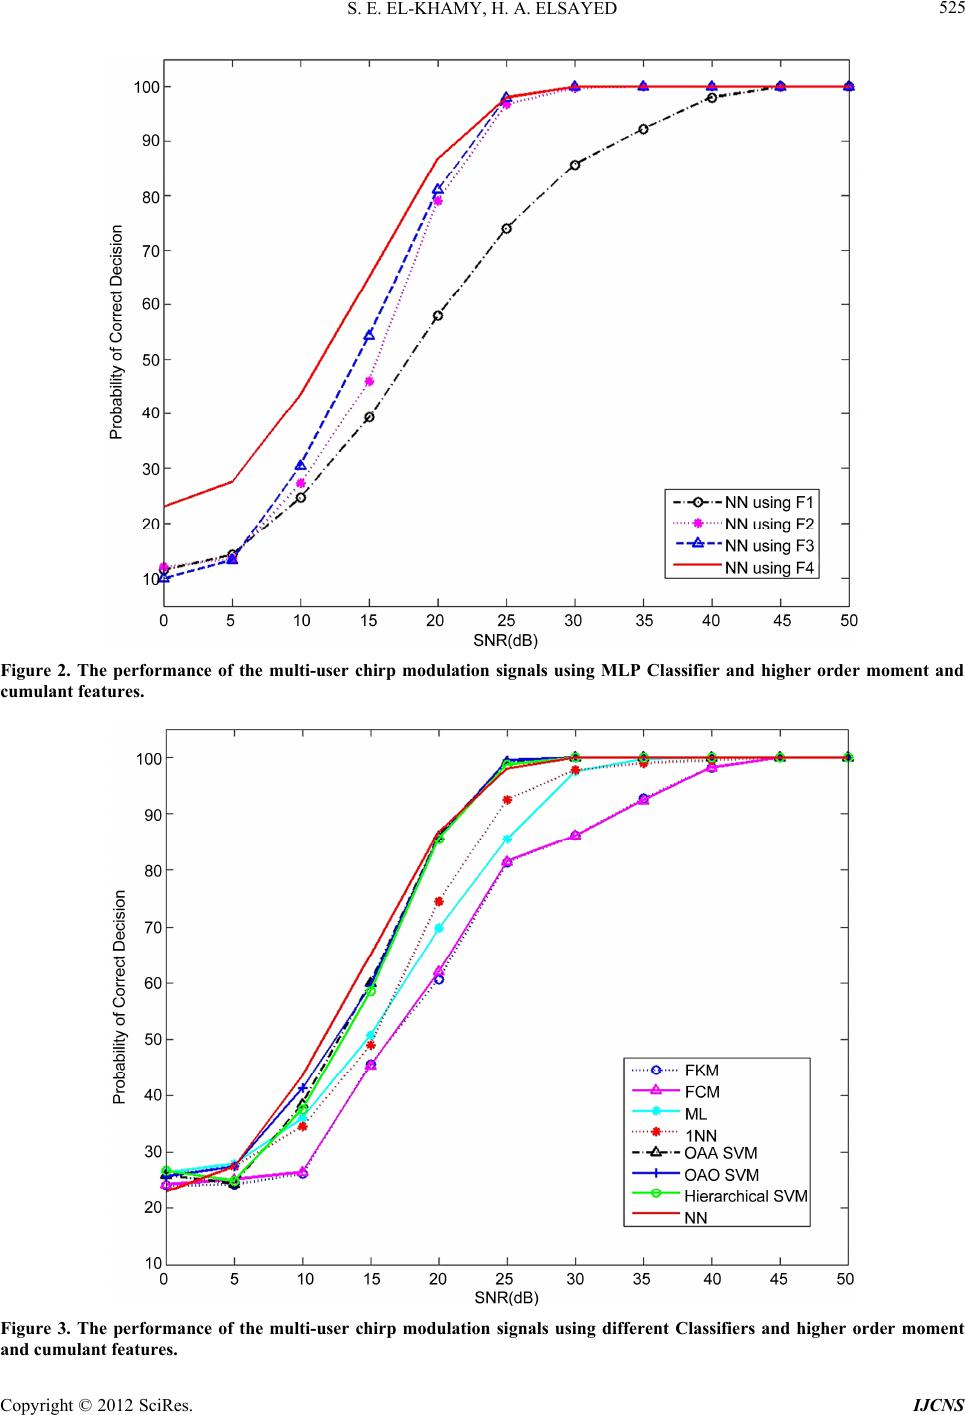 S. E. EL-KHAMY, H. A. ELSAYED 525 Figure 2. The performance of the multi-user chirp modulation signals using MLP Classifier and higher order moment and cumulant features. Figure 3. The performance of the multi-user chirp modulation signals using different Classifiers and higher order moment and cumulant features. Copyright © 2012 SciRes. IJCNS 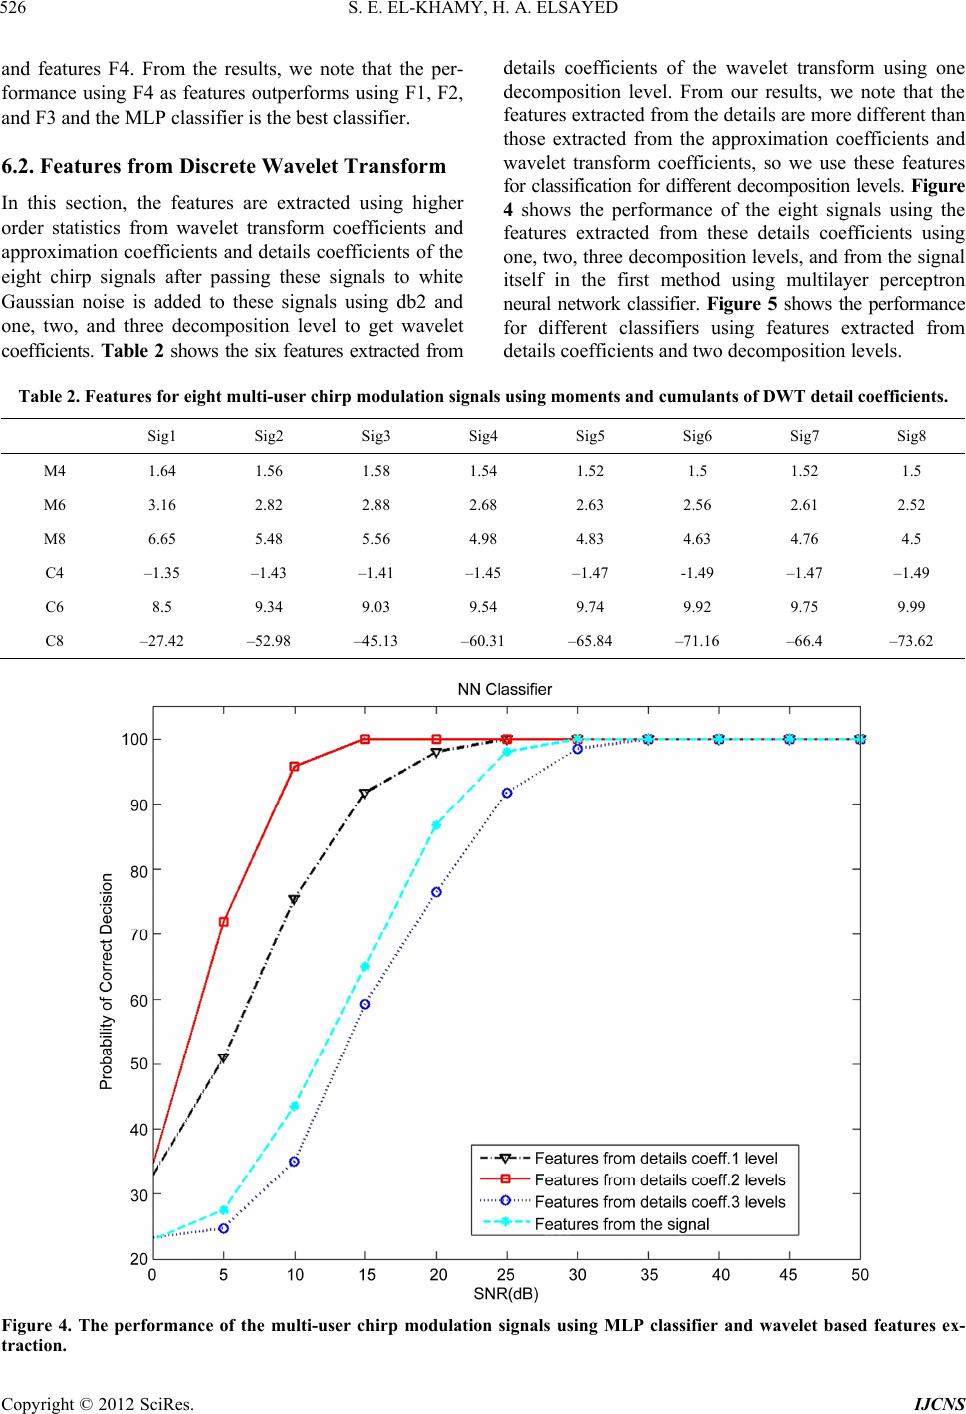 S. E. EL-KHAMY, H. A. ELSAYED Copyright © 2012 SciRes. IJCNS 526 details coefficients of the wavelet transform using one decomposition level. From our results, we note that the features extracted from the details are more different than those extracted from the approximation coefficients and wavelet transform coefficients, so we use these features for classification for different decomposition levels. Figure 4 shows the performance of the eight signals using the features extracted from these details coefficients using one, two, three decomposition levels, and from the signal itself in the first method using multilayer perceptron neural network classifier. Figure 5 shows the performance for different classifiers using features extracted from details coefficients and two decomposition levels. and features F4. From the results, we note that the per- formance using F4 as features outperforms using F1, F2, and F3 and the MLP classifier is the best classifier. 6.2. Features from Discrete Wavelet Transform In this section, the features are extracted using higher order statistics from wavelet transform coefficients and approximation coefficients and details coefficients of the eight chirp signals after passing these signals to white Gaussian noise is added to these signals using db2 and one, two, and three decomposition level to get wavelet coefficients. Table 2 shows the six features extracted from Table 2. Features for eight multi-user chirp modulation signals using moments and cumulants of DWT detail coefficients. Sig1 Sig2 Sig3 Sig4 Sig5 Sig6 Sig7 Sig8 M4 1.64 1.56 1.58 1.54 1.52 1.5 1.52 1.5 M6 3.16 2.82 2.88 2.68 2.63 2.56 2.61 2.52 M8 6.65 5.48 5.56 4.98 4.83 4.63 4.76 4.5 C4 –1.35 –1.43 –1.41 –1.45 –1.47 -1.49 –1.47 –1.49 C6 8.5 9.34 9.03 9.54 9.74 9.92 9.75 9.99 C8 –27.42 –52.98 –45.13 –60.31 –65.84 –71.16 –66.4 –73.62 Figure 4. The performance of the multi-user chirp modulation signals using MLP classifier and wavelet based features ex- traction. 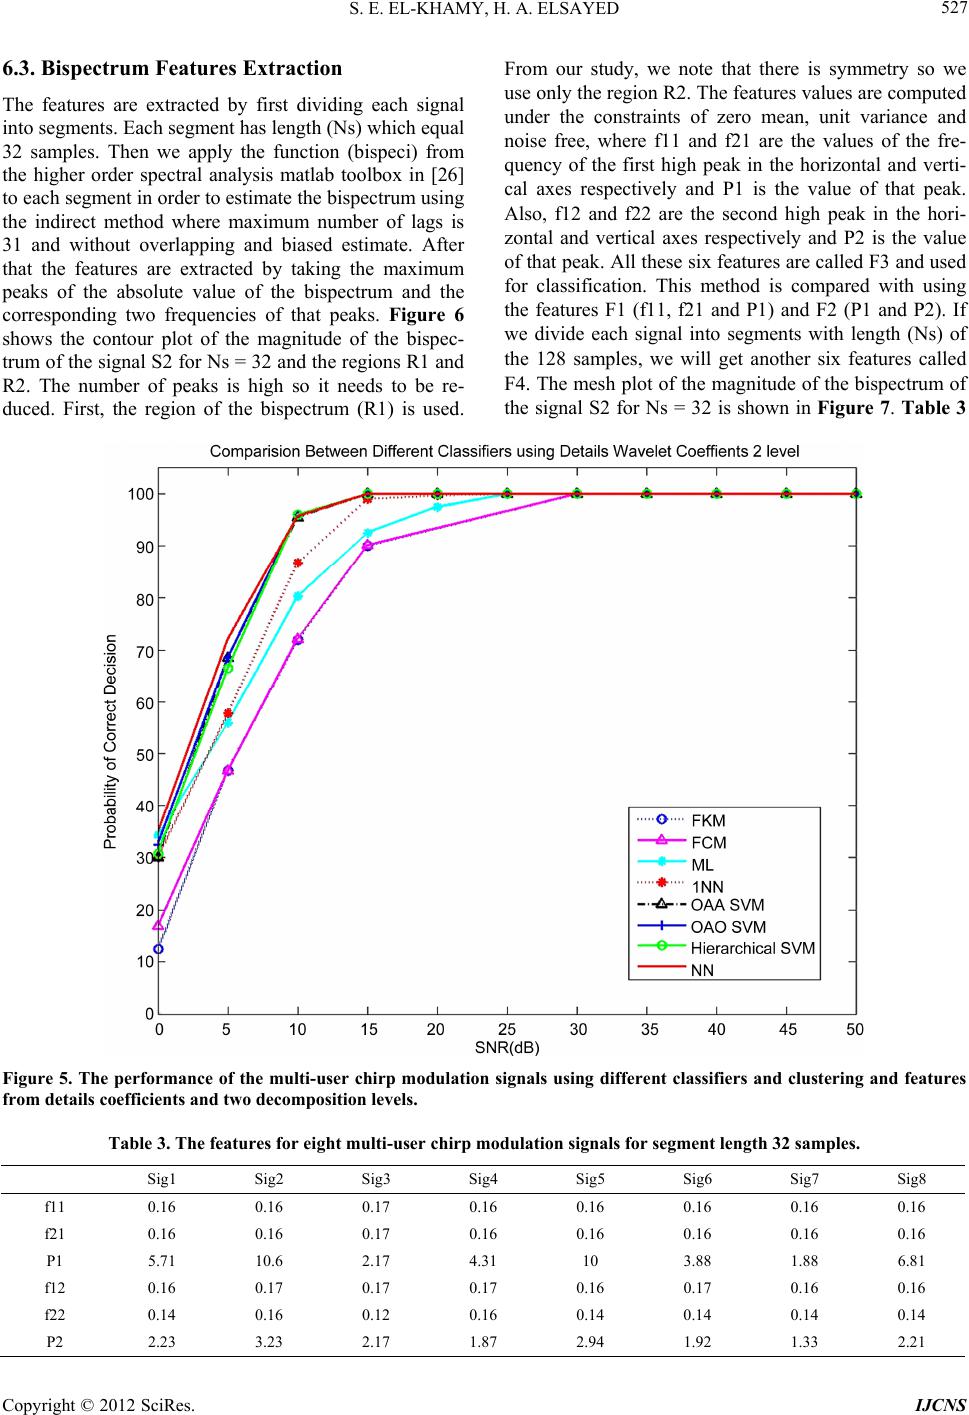 S. E. EL-KHAMY, H. A. ELSAYED 527 6.3. Bispectrum Features Extraction The features are extracted by first dividing each signal into segments. Each segment has length (Ns) which equal 32 samples. Then we apply the function (bispeci) from the higher order spectral analysis matlab toolbox in [26] to each segment in order to estimate the bispectrum using the indirect method where maximum number of lags is 31 and without overlapping and biased estimate. After that the features are extracted by taking the maximum peaks of the absolute value of the bispectrum and the corresponding two frequencies of that peaks. Figure 6 shows the contour plot of the magnitude of the bispec- trum of the signal S2 for Ns = 32 and the regions R1 and R2. The number of peaks is high so it needs to be re- duced. First, the region of the bispectrum (R1) is used. From our study, we note that there is symmetry so we use only the region R2. The features values are computed under the constraints of zero mean, unit variance and noise free, where f11 and f21 are the values of the fre- quency of the first high peak in the horizontal and verti- cal axes respectively and P1 is the value of that peak. Also, f12 and f22 are the second high peak in the hori- zontal and vertical axes respectively and P2 is the value of that peak. All these six features are called F3 and used for classification. This method is compared with using the features F1 (f11, f21 and P1) and F2 (P1 and P2). If we divide each signal into segments with length (Ns) of the 128 samples, we will get another six features called F4. The mesh plot of the magnitude of the bispectrum of the signal S2 for Ns = 32 is shown in Figure 7. Ta ble 3 Figure 5. The performance of the multi-user chirp modulation signals using different classifiers and clustering and features from details coefficients and two decomposition levels. Table 3. The features for eight multi-user chirp modulation signals for segment length 32 samples. Sig1 Sig2 Sig3 Sig4 Sig5 Sig6 Sig7 Sig8 f11 0.16 0.16 0.17 0.16 0.16 0.16 0.16 0.16 f21 0.16 0.16 0.17 0.16 0.16 0.16 0.16 0.16 P1 5.71 10.6 2.17 4.31 10 3.88 1.88 6.81 f12 0.16 0.17 0.17 0.17 0.16 0.17 0.16 0.16 f22 0.14 0.16 0.12 0.16 0.14 0.14 0.14 0.14 P2 2.23 3.23 2.17 1.87 2.94 1.92 1.33 2.21 Copyright © 2012 SciRes. IJCNS  S. E. EL-KHAMY, H. A. ELSAYED 528 Figure 6. Contour plot of the magnitude of the bispectrum of the signal S2 for Ns = 32 on the bi-frequencies (f1, f2) and the regions R1 and R2. Figure 7. Mesh plot of the magnitude of the bispectrum of the signal S2, Ns = 32. Copyright © 2012 SciRes. IJCNS  S. E. EL-KHAMY, H. A. ELSAYED Copyright © 2012 SciRes. IJCNS 529 neural network outperforms other classifiers such as maximum likelihood classifier, support vector machine classifier, k nearest neighbor classifiers, fuzzy c-means clustering, and fuzzy k-means clustering because it take long time for training. In addition, the performance of the fuzzy c-means clustering is better than the fuzzy k-means clustering for most the SNR in case of using higher order moments and cumulants as features. Also, using features extracted from WT get better performance than without WT because the WT have denoising properties which remove the noise, features extracted form details coefficients is better than using features extracted from the approxima- tion and wavelet coefficients and using two decomposi- tion is better than one and three and bispectrum features is better than higher order moment and cumulant features and features extracted from the details discrete wavelet transform coefficients using two decomposition levels. We also note that, in the support vector machine classifiers, the performance of the one-against-all classifier is better than one-against-one and hierarchical support vector machine. Finally, we note that, the performance of non clustering techniques is better than clustering techniques but clustering don’t need to train the classifier and it is easy to implement and faster than non clustering techniques. shows the features for the eight chirp signals when Ns is 32 samples. Figure 8 shows the contour plot of the eight signals where Ns = 32 samples is used and the region R2 is shown. The performance of the mutli-user chirp modula- tion signals using multilayer perceptron neural network and features F1, F2, F3, and F4 is shown in Figure 9. Figure 10 shows the performance of the multi-user chirp modulation signals using different classifiers and features F4 is used. From these results, we note that using F4 as features outperforms using F1, F2, and F3. Figure 11 shows the comparison between the performances of the multi-user chirp modulation signals using multilayer per- ceptron neural network classifier and the three different features extraction methods using higher order moment and cumulant (F4), using features extracted from the de- tails discrete wavelet transform coefficients using two decomposition levels, and bispectrum features (F4). From this figure, we note that using bispectrum features is bet- ter than using features extraction from higher order mo- ment and cumulant (F4) and using features extracted from the details discrete wavelet transform coefficients using two decomposition levels at low signal to noise ratio and the low signal power From these results, we note that the performance using Figure 8. Contour plot of the magnitude of the bispectrum of the eight signals on the bi-frequencies (f1, f2) and the region R2.  S. E. EL-KHAMY, H. A. ELSAYED 530 Figure 9. The performance of the multi-user chirp modulation signals using MLP classifier and bispectrum features. Figure 10. The performance of the multi-user chirp modulation signals using different classifie r s and Bispectrum features F4. Copyright © 2012 SciRes. IJCNS  S. E. EL-KHAMY, H. A. ELSAYED Copyright © 2012 SciRes. IJCNS 531 Figure 11. Comparison between the performances of the multi-user chirp modulation signals using MLP classifier and dif- ferent features ex traction methods. 7. Conclusions the classifier and it is easy to implement and faster than non clustering techniques. Also, using features extracted from WT get better performance than without WT be- cause the WT have denoising properties which remove the noise, features extracted form details coefficients is better than using features extracted from the approxima- tion and wavelet coefficients and using two decomposi- tion is better than one and three and bispectrum features is better than higher order moment and cumulant features and features extracted from the details discrete wavelet transform coefficients using two decomposition levels. So this signal is type of UWB because it needs low signal to noise ratio and then it is low signal power and also, we deals with low power level spectrum signal, so this chirp signal is type of spread spectrum signals. In this paper, we presented classification of multi-user chirp modulation signals using wavelet higher order sta- tistics features and artificial intelligence techniques. In this method, different types of classifiers are used and different features extraction methods are used. We note the dependence of the classifier performance on the clas- sifier type, the classifier parameters, the features used, the discrete wavelet coefficients, number of decomposi- tion levels, the method of features extraction, and the length of each segment. Simulation results show that the performance of the multilayer perceptron neural network classifier is better than other classifiers such as maximum likelihood classi- fier, support vector machine classifier, k nearest neighbor classifiers, fuzzy c-means clustering, and fuzzy k-means clustering because it take long time for training. In addi- tion, the performance of the fuzzy c-means clustering is better than the fuzzy k-means clustering for most the SNR in case of using higher order moments and cumu- lants as features. We also note that, in the support vector machine classifiers, the performance of the one-against- all classifier is better than one-against-one and hierarchi- cal support vector machine. Finally, we note that, the performance of non clustering techniques is better than clustering techniques but clustering don’t need to train REFERENCES [1] C. R. C. M. da Silva, W. C. Headley, J. D. Reed and Y. Zhao, “The Applications of Distributed Spectrum Sensing and Available Resources Maps to Cognitive Radio Sys- tems,” Proceedings of Information Theory and Applica- tion Workshop, San Diegoq, 27 January-1 February 2008, pp. 53-57. [2] H. Guldemır and A. Sengur, “Comparison of Clustering Algorithms for Analog Modulation Classification,” Ex- pert Systems with Applications, An International Journal,  S. E. EL-KHAMY, H. A. ELSAYED 532 Vol. 30, No. 4, 2006, pp. 642-649. [3] A. Ebrahimzadeh and M. Ebrahimzadeh, “An Expert Sys- tem for Digital Signal Type Classification,” Journal of Electrical Engineering, Vol. 58, No. 6, 2007, pp. 334-341. [4] X. Zhou, Y. Wu and B. Yang, “Signal Classification Meth- od Based on Support Vector Machine and High-Order Cumulants,” Wireless Sensor Network, Vol. 2, No. 1, 2010, pp. 48-52. doi:10.4236/wsn.2010.21007 [5] A. Ebrhimzadeh, H. Azimi and H. M. Naeemi, “Classifi- cation of Communication Signals Using an Optimized Classifier and Efficient Features,” The Arabian Journal for Science and Engineering, Vol. 35, No. 1B, 2010, pp. 225-235. [6] S. M. Zhou, J. Q. Gan and F. Sepulveda, “Classifying Mental Tasks Based on Features of Higher-Order Statis- tics from EEG Signals in Brain-Computer Interface,” In- formation Sciences, Vol. 178, No. 6, 2008, pp. 1629-1640. doi:10.1016/j.ins.2007.11.012 [7] C. K. Chua, V. Chandran, R. U. Acharya and L. C. Min, “Cardiac Health Diagnosis Using Higher Order Spectra and Support Vector Machine,” The Open Medical Infor- matics Journal, Vol. 3, 2009, pp. 1-8. doi:10.2174/1874431100903010001 [8] M. Kaur and A. S. Arora, “Unsupervised Analysis of Arr- hythmias Using K-Means Clustering,” International Jour- nal of Computer Science and Information Technologies, Vol. 1, No. 5, 2010, pp. 417-419. [9] M. Murugappan, M. Rizon, R. Nagarajan, S. Yaacob, I. Zunaidi and D. Hazry, “EEG Feature Extraction for Clas- sifying Emotions Using FCM and FKM,” Internat- ional Journal of Computers and Communications, Vol. 1, 2007, pp. 21-25. [10] N. Ahmadi and R. Berangi, “Symbol Based Modulation Classification Using Combination of Fuzzy Clustering and Hierarchical Clustering,” Signal Processing: An In- ternational Journal, Vol. 4, No. 2, 2010, pp. 123-137. [11] M. Sayadi, L. Tlig and F. Fnaiech, “A New Texture Seg- mentation Method Based on the Fuzzy C-Mean Algorithm and Statistical Features,” Applied Mathematical Sciences, Vol. 1, No. 60, 2007, pp. 2999-3007. [12] P. Prakasam and M. Madheswaran, “Mary Shift Keying Modulation Scheme Identification Algorithm Using Wave- let Transform and Higher Order Statistical Moment,” Jour- nal of Applied Science, Vol. 8, No. 1, 2008, pp. 112-119. doi:10.3923/jas.2008.112.119 [13] R. M. Al-Makhlasawy, W. Hamouda, M. M. Abd Elnaby, H. A. El-Khobby and F. E. Abd El-Samie, “Automatic Modulation Recognition Using Cepestral Analysis and Neural Networks in Wireless Systems,” 29th National Radio Science Conference, Cairo, 10-12 April 2012. [14] S. E. El-Khamy H. A. Elsayed and M. M. Rizk, “Classi- fication of Multi-User Chirp Modulation Signals Using Higher Order Cumulant Features and Four Types of Clas- sifiers,” 28th National Radio Science Conference, Cairo, Egypt, 26-28 April 2011. [15] H. A. Elsayed, S. E. El-Khamy and M. R. Rizk, “Higher Order Statistics Classification of Multi-User Chirp Modu- lation Signals Using Clustering Techniques,” URSI GASS 2011, Istanbul, 13-20 August 2011. [16] S. E. El-Khamy, H. A. Elsayed and M. R. Rizk, “Bispec- trum Classification of Multi-User Chirp Modulation Sig- nals Using Artificial Intelligent Techniques,” WorldComp 2011, Las Vegas, 18-21 July 2011. [17] S. E. El-Khamy and M. B. Al-Ghoniemy, “The Wavelet Transform: A Review and Application to Enhanced Data Storage Reduction in Mismatched Filter Receivers,” Pro- ceedings of the Thirteenth National Radio Science Con- ference, Cairo, 19-21 March 1996. [18] M. P. Fargues and G. Hatzichristos, “A Hierarchical Ap- proach to the Classification of Digital Modulation Types In Multipath Environments,” Conference Record of the Thirty-Fifth Asilomar Conference on Signals, Systems and Computers, Pacific Grove, 4-7 November 2001. [19] C. L. Nikias and J. M. Mendel, “Signal Processing with Higher Order Spectra,” IEEE Signal Processing Maga- zine, Vol. 10, No. 3, 1993, pp. 10-37. doi:10.1109/79.221324 [20] S. E. El-Khamy, “Matched Swept-Frequency Digital Mo- dulation for Binary Signaling in Inhomogeneous Disper- sive Media,” IEEE Transactions on Antennas and Pro- pagation, Vol. 28, No. 1, 1980, pp. 29-35. doi:10.1109/TAP.1980.1142283 [21] S. E. El-Khamy and S. E. Shaaban, “Matched Chirp Mo- dulation: Detection and Performance in Dispersive Com- munication Channels,” IEEE Transactions on Communi- cations, Vol. 36, No. 4, 1988, pp. 506-509. doi:10.1109/26.2777 [22] S. E. El-Khamy, S. E. Shaaban and E. A. Thabet, “Multi- User Chirp Modulation Signals (M-CM) for Efficient Multiple Access Communication Systems,” Proceedings of the Thirteenth National Radio Science Conference, Cairo, 19-21 March 1996. [23] S. E. El-Khamy, S. E. Shaaban and E. A. Thabet, “Effic- ient Multiple-Access Communications Using Multi-User Chirp Modulation Signals,” IEEE 4th International Sym- posium on Spread Spectrum Techniques and Applications Proceedings, Mainz, 22-25 September 1996, pp. 1209-1213. [24] S. E. El-Khamy, S. E. Shaaban and E. A. Thabet, “Fre- quency Hopped-Chirp Modulation (FH-CM) for Multi- User Signaling in Multipath Dispersive Media,” IEEE Antennas and Propagation Society International Sympo- sium, Orlando, 11-16 July 1999, pp. 396-399. [25] C. L. Nikias and A. P. Petropulu, “Higher-Order Spectra Analysis: A Nonlinear Signal Processing Framework,” PTR Prentice-Hall, Englewood Cliffs, 1993. [26] High Order Spectral Analysis Matlab Toolbox (9 February 2011). http://www.mathworks.com/matlabcentral/fileexchange/3 013 [27] A. V. Rosti, “Statistical Methods in Modulation Classifi- cation,” Master’s Thesis, Tampere University of Technol- ogy, Tampere, 1999. [28] H. Yoshioka, “A Fast Modulation Recognition Technique Using Nearest Neighbor Rules with Optimized Threshold for Modulation Classification in Rayleigh Fading Chan- nels,” Proceedings of WPMC, Honolulu, 27-30 October Copyright © 2012 SciRes. IJCNS  S. E. EL-KHAMY, H. A. ELSAYED Copyright © 2012 SciRes. IJCNS 533 2002, pp. 1049-1052. [29] C. Burges, “A Tutorial on Support Vector Machines for Pattern Recognition,” Data Mining and Knowledge Dis- covery, Vol. 2, No. 2, 1998, pp. 121-167. doi:10.1023/A:1009715923555 [30] A. Swami and B. M. Sadler, “Hierarchical Digital Modu- lation Classification Using Cumulants,” IEEE Transac- tions on Communications, Vol. 48, No. 3, 2000, pp. 416-429. doi:10.1109/26.837045 |