Software Reuse in Cardiology Related Medical Database Using K-Means Clustering Technique
684
4. Methodology and Experimental Results
In this article a novel methodology for cardiac medical
data reusability is proposed. A database from archives
[11] is considered for carrying out our proposed work. In
this method, we have first categorised the data into 3
groups namely, normal, pro-cardiac and cardiac. We
have considered the scenario of Chintapalli, a remote
tribal village in Andhra Pradesh, India, where no super-
speciality services for treating cardiac patients are avail-
able. It is necessary in such conditions to supplement the
patient with sufficient primary aid so that he can sustain
for the minimum period of shifting. Depending upon the
clinical reports of the patient’s data, he is to be catego-
rized into one of the levels presented in Sections 2.1-2.3.
A dissimilarity matrix is constructed with the readings
from the clinical observations and identifying the most
leading factors that may be prone to the cardiac diseases
as per the experts’ references. The various readings con-
sidered are categorized into the above mentioned three
groups and a database is formulated from the realistic
data obtained from medical patients from the data re-
ferred in [10]. The predominant features considered in
the database are: blood pressure (BP), heartbeat (HB),
pulse rate (PR), ECG (normal/abnormal), pain in the left
shoulder region, sweating, nausea/vomiting, over weight,
chest pain and breathlessness.
For the testing purpose in this paper, we have used a
database of ten patients with the above mentioned ten
features; if the reading is present we have represented it
by using a value 1 else 0 (binary). Following this proce-
dure for the other inputs, a binary matrix [11] is obtained
and this matrix is to be categorized; K-Means algorithm
is utilized for the same. Now within the clusters, the ho-
mogenous data is obtained. To classify a patient, the dis-
similarity matrix is again formulated and is classified by
calculating the minimum distance between the posed
query data and the retrieved data by using the clustering
technique.
Reuse Metrics
The reuse components for partitioning the data are di-
vided into 4 steps performed at each phase in preparation
to the next phase. These steps are:
1) Developing a reuse plan or strategy after studying
the problem and available solutions to the problem.
2) Identifying a solution structure for the problem fol-
lowing the reuse plan or strategy.
3) Reconfiguring the solution structure to improve the
possibility of using predefined components available at
the next phase.
4) Evaluating the system.
The major tasks under the first step are to understand
the problem about the cardiac patients, build-up the
knowledge for categorizing them into groups and de-
velop a plan or strategy for their treatment. In the second
step, apply the knowledge to develop a solution structure
that is best suited for the problem following the reuse
plan or strategy developed in the above phase. In the next
step, reconfigure the solution in order to optimize the
reuse both at both the current phase and next phase. Fi-
nally the computed components are to be classified using
test features.
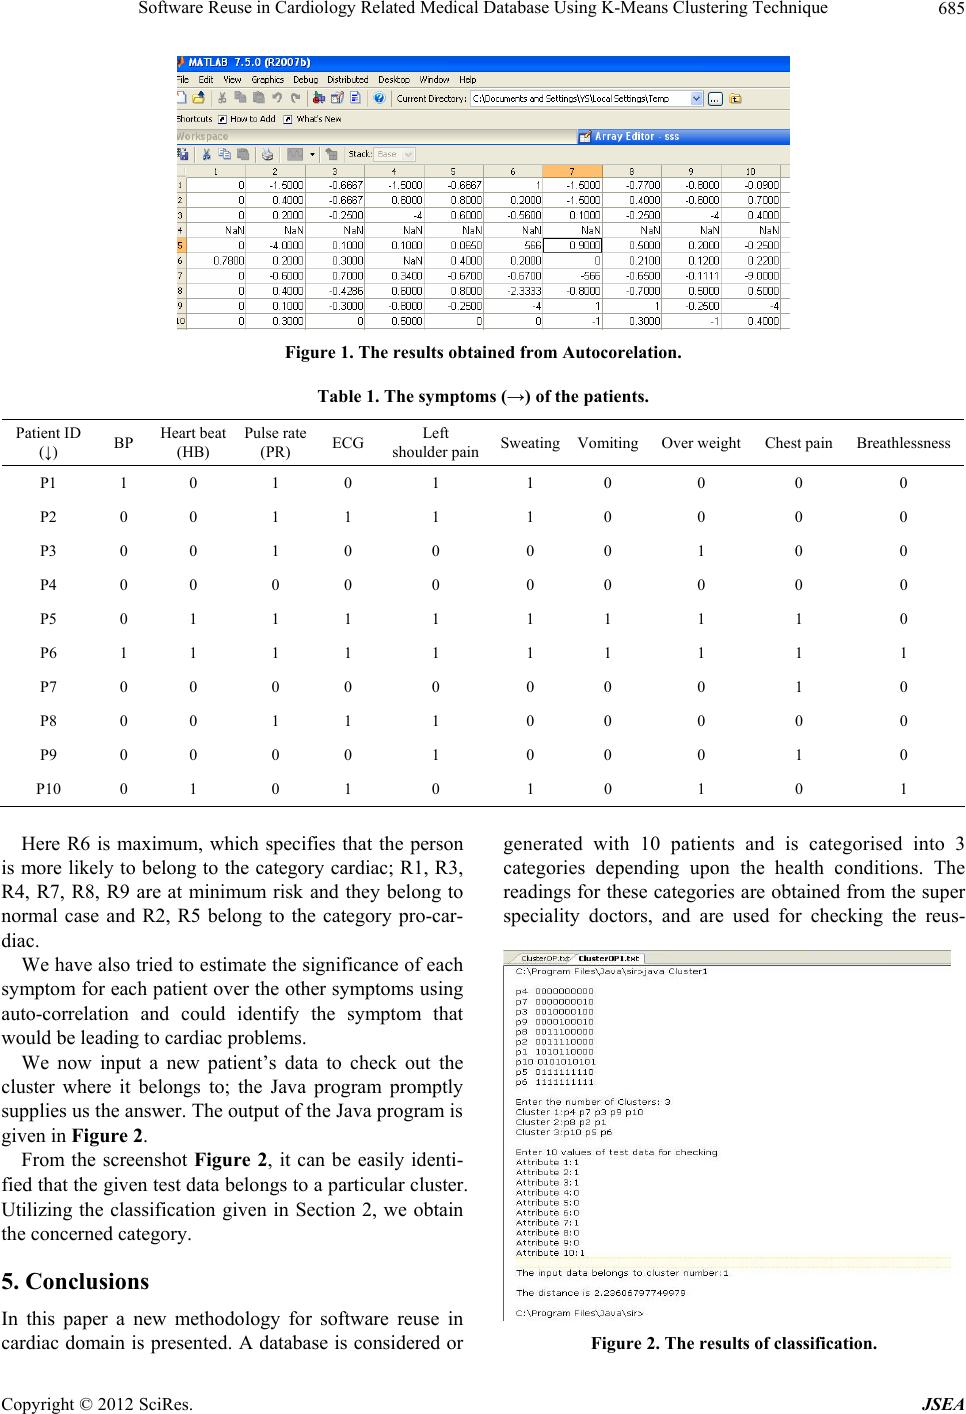
The data of 10 patients, from the archives [10] is con-
verted into a binary matrix as above. The concepts in the
clustering partition in reusable components [8] are util-
ized to construct a Java program that takes in the data
from the Table 1. The program constructs the clusters by
classifying the data using the Euclidean distance. After
the K-Means clustering, the data is divided based on the
binary clustering, into three groups. The patients with Ids
(P4, P7, P3, P9, P10) belong to the first cluster, patients
with Ids (P8, P2, P1) belong to the second cluster and
patients with Ids (P5, P6, P10) belong to the third cluster.
The basic aim in this context is to assist the patients
with minimum first aid for sustainability till he/she is
shifted to the nearest multi-speciality clinic from the re-
mote place Chintapalli considered here. In order to cate-
gorize the patients, it is necessary to identify the exact-
ness of the category and thereby suggesting the minimum
essential supportive drugs to maintain or better the cur-
rent condition. It becomes clear by now that it is neces-
sary to find the exactness of the disease if we are to
achieve our goals.
To find the most exact solution in this concept, an
auto-correlation model is used to find the exact correla-
tion and categorization of the patients. The auto-correla-
tion formula used here is given by
1
2
1
n
ttk
tk
kn
t
t
YYY Y
r
YY
where t is the patient with the first symptom, K + 1 is the
patient with the second symptom and so on.
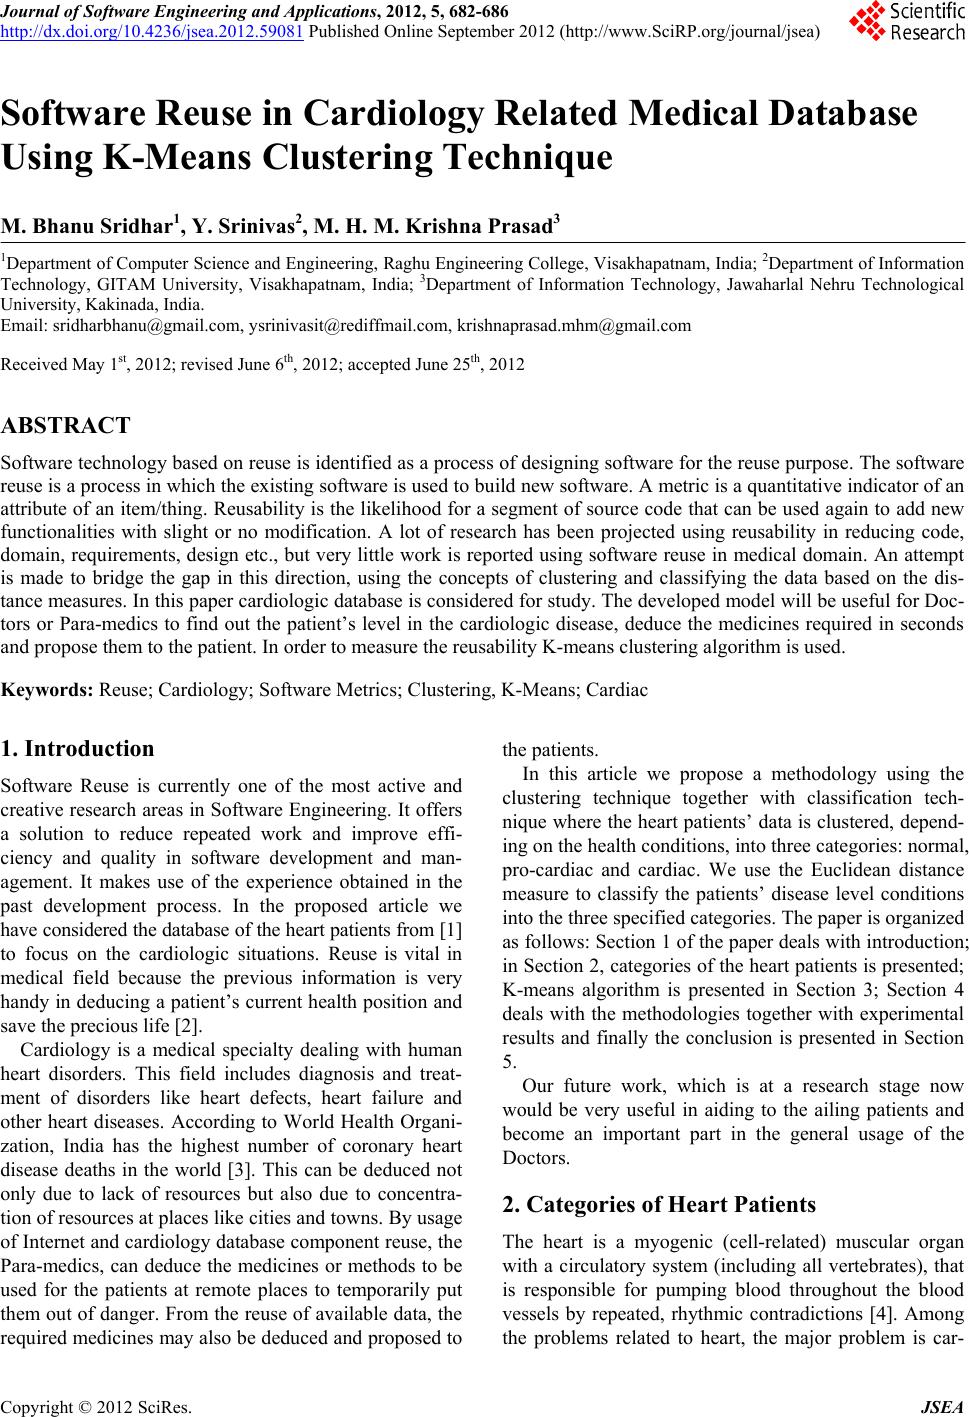
In this model, we try to correlate the data to each pa-
tient by considering the auto-correlation model and the
results obtained are tabulated (Figure 1).
From the above considered data, it can be clearly seen
that the patient with R6 is having highest auto-correlation
factor and is likely to have symptoms of a cardiac. The
value obtained here is 0.9. The patient with Ids P5 and P6
i.e. R5 and R6 have the next immediate ranges and they
are also likely to be cardiac-prone. The values obtained
by using the above quoted autocorrelation formula are
given under:
R1 = 0.3, R2 = 0.3, R3 = 0.1, R4 = 0.0023, R5 = 0.7,
6 = 0.9, R7 = 0.11, R8 = 0.3, R9 = 0.1, R10 = 0.72 R
Copyright © 2012 SciRes. JSEA