Smart Grid and Renewable Energy, 2012, 3, 231-238
http://dx.doi.org/10.4236/sgre.2012.33032 Published Online August 2012 (http://www.SciRP.org/journal/sgre) 231
Energy Consumption Monitoring Analysis for Residential,
Educational and Public Buildings
Allan Hani, Teet-Andrus Koiv
Environmental Department, Tallinn University of Technology, Tallinn, Estonia.
Email: allan.hani@rkas.ee
Received June 2nd, 2012; revised July 27th, 2012; accepted August 5th, 2012
ABSTRACT
In the present article thermal and electrical energy consumptions for different types of buildings are analyzed. The lati-
tude and longitude of the researched area are defined 59˚00'N and 26˚00'E. According to Köppen climate classification
the area is located in warm summer continental climate. The study consist 40 residential, 7 educational and 44 public
buildings. Three years data for each building type among 2006-2011 was used. Several detailed energy balances are
presented for apartment buildings. In addition the different ways of domestic hot water preparation are analyzed for
apartment buildings. The school buildings average consumption values are represented in study. Also valu able informa-
tion of measured electrical energy consumption balance for a new office building is presented. Finally there is included
the energy consumption analysis of public buildings.
Keywords: Specific Energy Consumption; Thermal Energy; Electrical Energy; Residential Buildings;
Educational Buildings ; Office Buildings
1. Introduction
He energy prices are rising continuously in most countries
all over the world. Currently the targets are to consume less
energy and produce more green energy. The bu ilding sector
is responsible for approximately 40% consumption from
total countries energy balances in EU and USA. In devel-
oping countries the value is around 20%. A comprehensive
research conclusion is presented in 2007 [1]. The biggest
consumers of non-domestic buildings sector are supermar-
kets, hospitals, restaurants. The research of urban energy
consumption distribution in USA [2] shows the variety of
residential, public and industrial buildings en ergy consump-
tion. Also energy balances for residential and public build-
ings are presented. The electrical energy consumption in
public buildings is a con cern. London pub lic buildings have
been researched [3,4]—the office buildings specific energy
consumption values range is w ide. In addition, a scenario of
energy consumption in London until 2050 is presented.
Similar scenarios could be suggested also to other countries.
Statistical analysis of Chin ese buil di ngs has be en carried out
in some extent [5,6]. The disper sion diagra ms are pr esented
(offices, hotels, governmental buildings). The Malaysian
office buildings are co mpared w ith other countri es [7]. A lso
the results of electrical motor variable speed drives eco-
nomical calculation are carried out and the solution can be
suggested. The calculated energy consumptions and real
measurement result differ 1.2 - 1.5 times in lots of cases
[8,9]. The calculation methods must be revised. To have
more precise calculation results the iterative calibration
process for dynamic simulations is prepared [10]. Already
in 2002 an envelope shape and other building parameters
based strategies have been suggested for designing low en-
ergy office buildings [11]. Th is information is valuable and
can be used by architects, engineers and design companies.
In China the trends for heating and cooling energy con-
sumption in differ ent clima te areas are resear ched. Th e sce-
nario for period 2009-2100 is presented [12]. To lower a
cooling load and glaring of the light in buildings the win-
dows can b e coated w ith pro tective films [13]. The solution
suits well for the older buildings. A very interesting research
of LEED certification effects to energy consumption is done
in North America [14]. Averagely LEED buildings con-
sume 18% - 39% less energy per floor area than o thers. But
28% - 35% LEED buildings consume more energy per floor
area than others. To lower the ventilation air exchange rates
reduces energy consumption. A good solution is to use 8 l/s
per person and lower the ventilation rate when absent [15].
The energy saving measures shall be selected according to
the building.
2. Methods
2.1. The Compensation of External Air
Temperature Variety for Different
Years Heat Consumption
The degree-days are widely used to eliminate the influ-
Copyright © 2012 SciRes. SGRE
Energy Consumption Monitoring Analysis for Residential, Educational and Public Buildings
232
ence of external air temperature difference for different
years to heat energy consumption. The heat energy con-
sumption is reduced to reference year basis. The refer-
ence year degree-days in Estonia are selected from 1975-
2004 (30-year period) and defined for six different loca-
tions (Tallinn, Tartu, Jõhvi, Pärnu, Valga, Ristna).
Determinati o n of de gree-day reference year
Following Equation (1) expresses the equation for de-
gree-day reference year creation [16].

EXTi
1
n
B
i
i
Stt

(1)
where, S is number of degree-days, ˚K·d; n is number of
days (in a month or a year);
B
tt
1
is internal air tempera-
ture (balance temperature), ˚C; EXT is external air tem-
perature of day, ˚C; i
ii
, if ;
EXTi
tt
B0
i
, if
EXTi
Determination of heat energy consumption normalized
with reference year
B
tt
The following Equation (2) is used to eli minate the in-
fluence of external air temperature to heat energy.

REAL REAL
N
n
S
QQ CC
S

(2)
where, n is heat consumption normalized with reference
year, MWH/year; QREAL is heat consumption of real year,
MWH/year; SN is degree-days of reference year, ˚K·d; SREAL
is degree-days of real year, ˚K·d; C is heat consumption
where degree-days do not have affect (e.g. hot water),
MWH/year.
Q
The actual research heat energy consumption values are
normalized according to Equation (2). In addition the elec-
trical ene rgy co nsum pti on is a dde d.
2.2. Degree-Day Energy Consumption
Calculations with Variable Balance
Temperature
The method is also expressed in [16].
Determination of free heat in residential building
The sources of free heat in the building are people,
electric devices, electric lightning, and solar radiation.
The main comp onents of the free heat load are calculated
by the Equation (3 ).
AFHPEOPLIGHT EQUIP SOLAR
  (3)
where, AFH is the average free heat load, kW; PEOP
is
the people average effective free heat load, kW; LIGHT
is the electric lighting average effective free heat load,
kW; EQUIP is the average effective free heat load of
equipments, kW; SOLAR is the average effective free
heat load due to the solar radiation, kW.
The respective free heat loads are determined
by the amounts of free heat energy and the dura-
tion of the respective period
(4).
free
free
Q
free
free 1000 Q
 (4)
where is the free heat energy of the building,
MWH;
is the duration of the period, h.
free
Q
Determination of the ba lance temperatur e on the basis
of free heat
On the basis of the degree days it is possible to calcu-
late the heat requirements for heating the building by
Equation (5)
–3
24 10
kN
QHS  (5)
where, SN is the number of degree-days corresponding to
the balance temperature of th e building; 24 is the n umber
of hours in a day; H is the specific heat losses, kW/˚K,
determined by Equation (6).
Specific heat losses of the building
1
n
ii
i
H
UA Lc

(6)
where, i is the U-value of envelope element
W/(m2˚K); Ai is the area of envelope element , m2; n is
the number of different envelope elements; L is the air
change, m3/s; c is the specific heat of the air, J/(kg˚K);
is the density of the air, kg/m3.
U i
i
To more precisely display the heat conservation ob-
tained by renovation it is expedient to use the degree
days with a variable balance temperature.
In renovating the building (e.g. insulating the envelope
elements) the specific heat losses decrease and thus af-
fect the balance temperature.
The internal air temperature of the building is made up
by the heat provided by the heating system and free heat
(7).
int extheat
h
tt tt
 (7)
Balance temperatures can be found by Equation (8)
int
B
fh
tt t
 (8)
where, tint is internal air temperature; text is the external
air temperature;
B
t is the balance temperature;
f
h
t
is
the rise in the temperature at the expense of the free heat
taking part in the heat balance of the building.
The rise in the temperature at the expense of free heat
can be found by Equation (9)
free
1000
fh
t
H
 (9)
The useful free heat load needed in determining the
balance temperature is determined by Equation (10)
free dfree
 (10)
where, dfree
is the design free heat load, W;
is the
utilization factor.
The value of the utilization factor depends on the con-
Copyright © 2012 SciRes. SGRE
Energy Consumption Monitoring Analysis for Residential, Educational and Public Buildings
Copyright © 2012 SciRes. SGRE
233
trol level of the heating system. (e.g. if the temperature of
the heating systems’ flow water is controlled by the ex-
ternal air temperature and the heat output of the radiators
is controlled, we can acquaint more use of free heat than
if we control only the temperature of the flow water).
Based on balance temperature degree days the energy
consumption balance can be calculated and evaluated
with real measurement results. A decrease of the balance
temperature brings remarkable savings in the heat re-
quirements of the building. The method is used for
apartment buildings thermal energy balance calculations
and saving estimations. Nevertheless, for public build-
ings, where the tB varies remarkably during the year, dy-
namic simulations (IDA Indoor Climate and Energy,
TRNSYS, Energy Plus, etc.) or real measurements for
energy balance determination can be su ggested.
3. Results and Discussion
3.1. Residential Buildings
Total 40 buildings thermal and electrical energy con-
sumptions (200 6-2010) were collected and analyzed. The
detailed energy balance analysis was carried out for 14
buildings. Information about reconstructions, heating
source, internal air temperature, air exchange rate and
domestic hot water production is presented in Table 1.
Following abbreviation s are used: DH-district heating;
WB—wood fired boiler; GB—gas fired boiler; DHW—
domestic hot water; ACH—air exchange rate; HS—heat-
ing substation; EL—electrical heaters; win—windows;
bal—balancing works; full —full reconstruction.
During actual research the energy audits, prepared by
professional auditors, were evaluated. In a numerous
cases the systematic errors were found. DHW is prepared
with decentralized electrical heaters, but the auditors
have calculated once again the DHW energy consump-
tion to heating energy balance and this is not correct.
Among current energy balance calculations all the mis-
takes were corrected. Furthermore the packages of saving
measures did not include ventilation reconstruction
measures. This leads to the fact that among studied audits
no ventilation improvement was done (2006-2010). The
ventilation reconstruction problems shall be taken to the
focus in further auditor trainings. The solutions with heat
recovery (decentralized roo m or apartment based v entila-
tion, and exhaust air heat pump) are available to use in
reconstruction projects. In following Figures 1 and 2 the
energy balances, specific gross consumptions and aver-
age specific consumptions of 14 apartment buildings are
presented.
The Figures 1 and 2 the average specific energy con-
sumptions:
Table 1. The main information about researched buildings.
Bld. County Reconstructions Heating sourceTintavg ACH DHW
Envelope Heating system [˚C] [1/h]
A1 Pärnu - - DH 20.0 0.40 HS
A2 Harju 2010 roof 300 mm, <2010 win 86% 2007 HS, 2008 bal DH 20.0 0.40 HS
A3 Saare 2006 roof 400 mm, 2007 win 66% 2000 HS DH 22.5 0.27 HS
A4 Tartu 2001 win 100% 2001 HS DH 23.0 0.25 HS
A5 Harju <2010 win 85% - GB 20.0 0.30 HS
A6 Ida-Viru <2010 win 54%, walls 100 mm 36% 2003 HS, 2007 bal DH 20.5 0.20 HS
A7 Harju 2009 roof 200 mm, <2010 win 93% 1997 HS, bal DH 21.0 0.40 HS
A8 Viljandi <2009 win 89% 2008 full DH 21.0 0.33 HS
A9 Jõgeva - - DH 19.0 0.35 EL
A10 Põlva - - DH 23.0 0.24 EL
A11 Ida-Viru <2008 win 47% - DH 19.0 0.31 EL
A12 Valga <2008 win 63%, doors - DH 22.0 0.30 EL
A13 Harju <2009 win85% <2009 HS DH 21.0 0.20 HS
A14 Tartu <2009 win 77% - DH 19.5 0.20 EL
Energy Consumption Monitoring Analysis for Residential, Educational and Public Buildings
234
Figure 1. Dynamics of energy balance and specific energy consumption in the analyzed buildings (DHW prepared in substa-
tion).
Figure 2. Dynamics of energy balance and specific energy consumption in the analyzed buildings (DHW prepared with elec-
trical heaters in apartments).
1) Heating 120 - 140, kWh/(·year);
heated
2) Air exchange and infiltration 20 - 30,
kWh/( ·year);
2
m
heated
3) Domestic hot water 30, kWh/(·year);
2
m
heated
4) Electricity 30 without electrical heaters,
kWh/( ·year);
2
m
heated
5) Electricity 50 with electrical heaters,
kWh/( ·year);
2
m
heated
6) Total 200 - 25 0, kWh/(·year).
2
m
heated
2
m
The heated area m2 is a basis for specific energy con-
sumption val ue s .
Earlier studies [17] have indicated average specific
heating energy consumption of 185 kWh/(m2·year). Cur-
rent analyse results gave 180 - 185 kWh/(m2·year) with-
out electrical energy consumption.
The Figure 3 presents dispersion of specific thermal
and electrical energy consumption for analyzed 40
apartment buildings.
Copyright © 2012 SciRes. SGRE
Energy Consumption Monitoring Analysis for Residential, Educational and Public Buildings 235
Figure 3. Dispersion of specific energy consumption of apartment buildings.
Figure 4. Specific energy consumption in the analyzed educational buildings.
Most of the apartment buildings energy consumption
varies between 18 0 - 220 kWh/(m2·year).
3.2. Educational buildings
Total 7 school buildings thermal and electrical energy
consumptions (2009-2011) were collected and analyzed.
The heat energy consumption is normalized with refer-
ence year. Following Figure 4 presents the specific en-
ergy consumption of studied buildings.
The net area m2 is a basis for specific energy con-
sumption val ue s .
1) Average specific thermal energy consumption (in-
cludes DHW) is 90 kWh/(·year).
net
2) Average specific electrical energy consumption is
35 kWh/(·year).
2
m
net
3)Total ~125 kWh/(·year).
2
m
net
The specific consumption value is relativ ely low, but 3
months during the year the usage of school buildings is
nearly 0. Also, the net area in typical school buildings is
ca 1.5 times bigger than heated area [18]. Furthermore,
the current schools investment schematic supports the
2
m
Copyright © 2012 SciRes. SGRE
Energy Consumption Monitoring Analysis for Residential, Educational and Public Buildings
236
low energy consumption, but the poor indoor climate
aspects shall be considered [19].
3.3. Public Buildings
Total 44 public buildings th ermal and electrical energy
consumptions (2009-2011) were collected and analyzed.
In addition one typical new ten-storey office building
electrical energy balance is analyzed more in deep.
Measured energy balance of an office building
The importance of electrical energy consumption in
new office buildings is frequently underestimated in warm
summer continental climate. Following Figure 5 repre-
sents the energy balance of a ten-storey office building.
The measurements base on 2011 energy consumption.
The electrical energy balance (100%) division:
1) Lighting and electrical equipment (10 floors) 42.2%;
2) Cooling (chiller un it, pumps, dr y-coolers, sp lit-units)
27.6%;
3) Servers 8.9%;
4) Ventilation (fans, heating pumps, heat recovery
wheel) 7.0%;
5) External electrical heating (ramp heating, rainwater
gullies) 4.7%;
6) External and parking area lighting 3.3%;
7) Technical rooms and video surveillance 2.8%;
8) Heating substation (boilers, pumps) 2.2%;
9) Elevators 1.3%.
The analysis of 44 public buildings
It is more complicated to evolve energy saving meas-
ures in public building sector than in residential buildings.
The national heritage board has grounded restrictions to
public buildings envelope and finishing. The internal
insulation can not be added due to climatic conditions.
Windows change is whether expensive or not allowed.
As well the heating system reconstruction is more com-
plicated (employees and equipment have to be moved;
valuable finishing materials can be destroyed; more ex-
pensive heating elements are required by architect, etc.).
Thermal
energ y
30%
Ifl
2%
IIfl
3%
IIIfl
4%
IVfl
3%
Vfl
3%
VIfl
2%
VIIfl
3%
VIIIfl
3%
IXfl
2%
Xfl
2%
Server1
2%
Server2
1% Server3
3%
Canteen
2%
Elevators
1%
Heating
substation
2%
Videosurveillan ce,
extract ventilators
2%
Ram pheating
3%
Serversplits, dry
coolers,sewage
pumping
3%
Undergr.parkingand
ext e rn al illumination
2%
Chillers
11%
Coolingpumps
6%
Airhandlingunits
(S V1, SV2,SV3)
5%
Electricalenerg y
70%
Figure 5. Measured energy balance of a high rise office building.
Figure 6. Dispersion of specific energy consumption of public buildings.
Copyright © 2012 SciRes. SGRE
Energy Consumption Monitoring Analysis for Residential, Educational and Public Buildings 237
Usually roof insulation is the easiest saving measure to
be done.
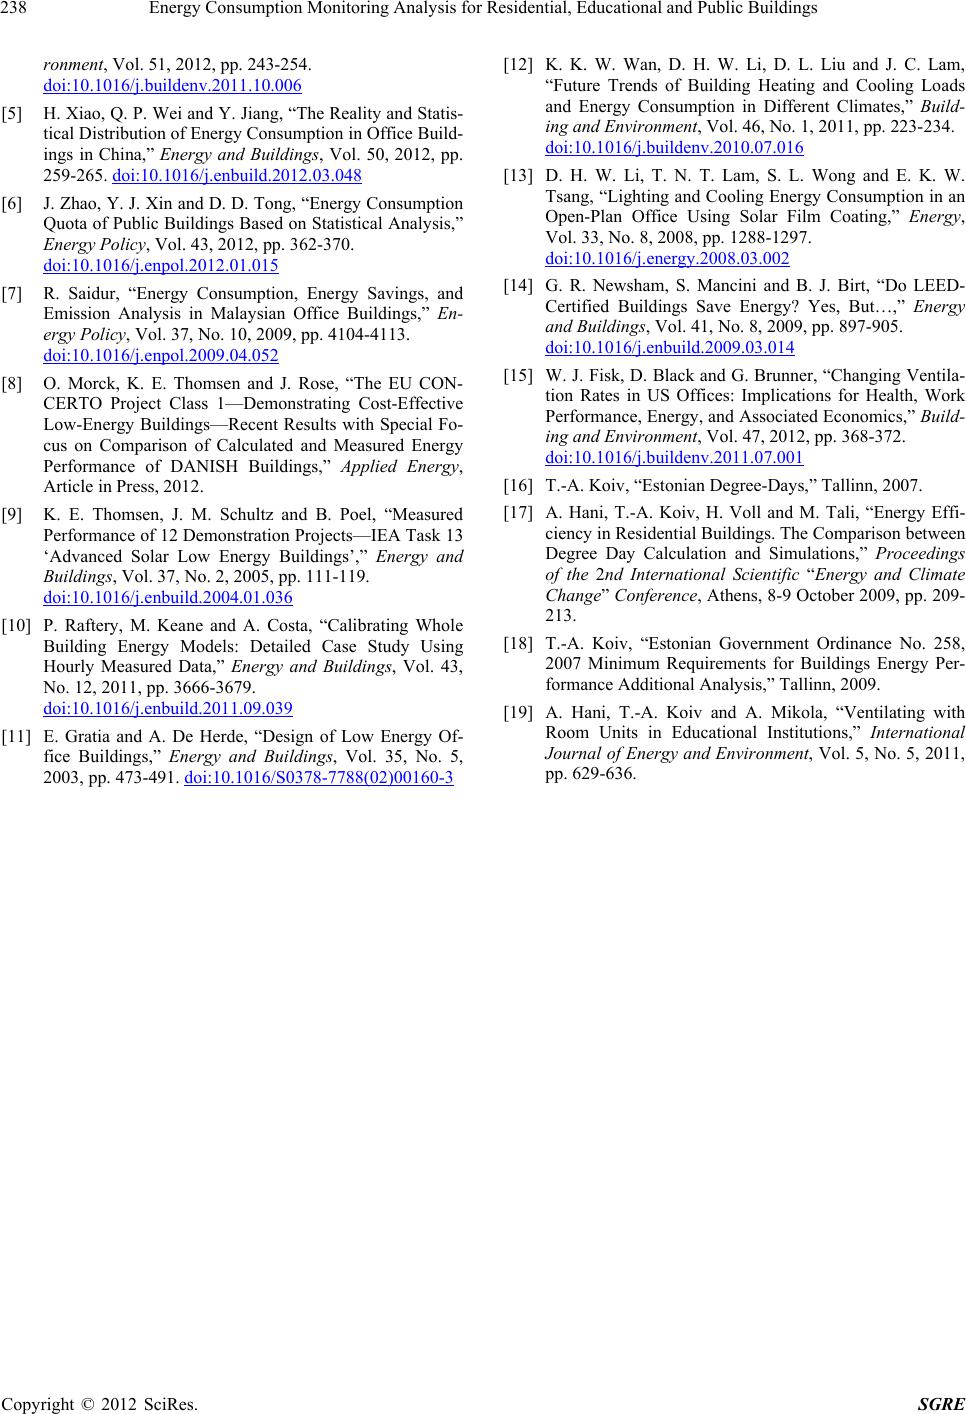
The current analysis is based on 44 public buildings
thermal and electrical energy consumption. The heat en-
ergy consumption is normalized with reference year. The
net area m2 is a basis for specific energy consumption
values. In following Figure 6 the dispersion of specific
energy consumption of analysed buildings is presented.
The energy consumption varies widely and the energy
saving measures can be worked out only case by case.
Average share of thermal energy is 60% and electrical
40% in public buildings. In 10 cases the electrical energy
consumpt i on w a s 25%.
Among the study 4 buildings were electrically heated
and their energy consumptions rating were in 12th, 28th,
34th and 38th position in a regressive row. Nevertheless,
the electrical energy is more expensive than other energy
resources.
4. Conclusions
Based on the analysis of the energy consumption of resi-
dential, educational and public buildings following find-
ings can be categorized:
Residential buildings
1) Reconstructions have been carried out without ven-
tilation improvement. To maintain normal energy con-
sumption heat recovery ventilation must be designed;
2) The energy balance calculations of energy auditors
include occasionally errors in DHW handling.
3) The energy consumption for DHW preparation is
lower with electrical heating compared to district heating.
Nevertheless, the electrical energy is more expensive.
4) In several cases slight under-heating appears (tint =
20˚C).
5) Reconstruction works have lowered energy co-
sumption averagely to 180 - 220 kWh/ (m2·year).
Educational buildings
1) The heated area m2 information is usually not avail-
able. In further research this information shall be col-
lected. Based on the net area the energy consumption
values are relatively low.
2) The ventilation systems are not working properly
due to lack of maintenan ce knowledge and contro l possi-
bilities.
3) In several occasions the investment model for
schools directs to extreme energy saving. The poor in-
door climate or energetically inefficient wind ow opening
(air exchange without heat recovery) is the result.
4) Simple building management systems for heating
substations and ventilation systems are suggested.
5) More attention must be paid to educational build-
ings energy efficient use and reconstructions.
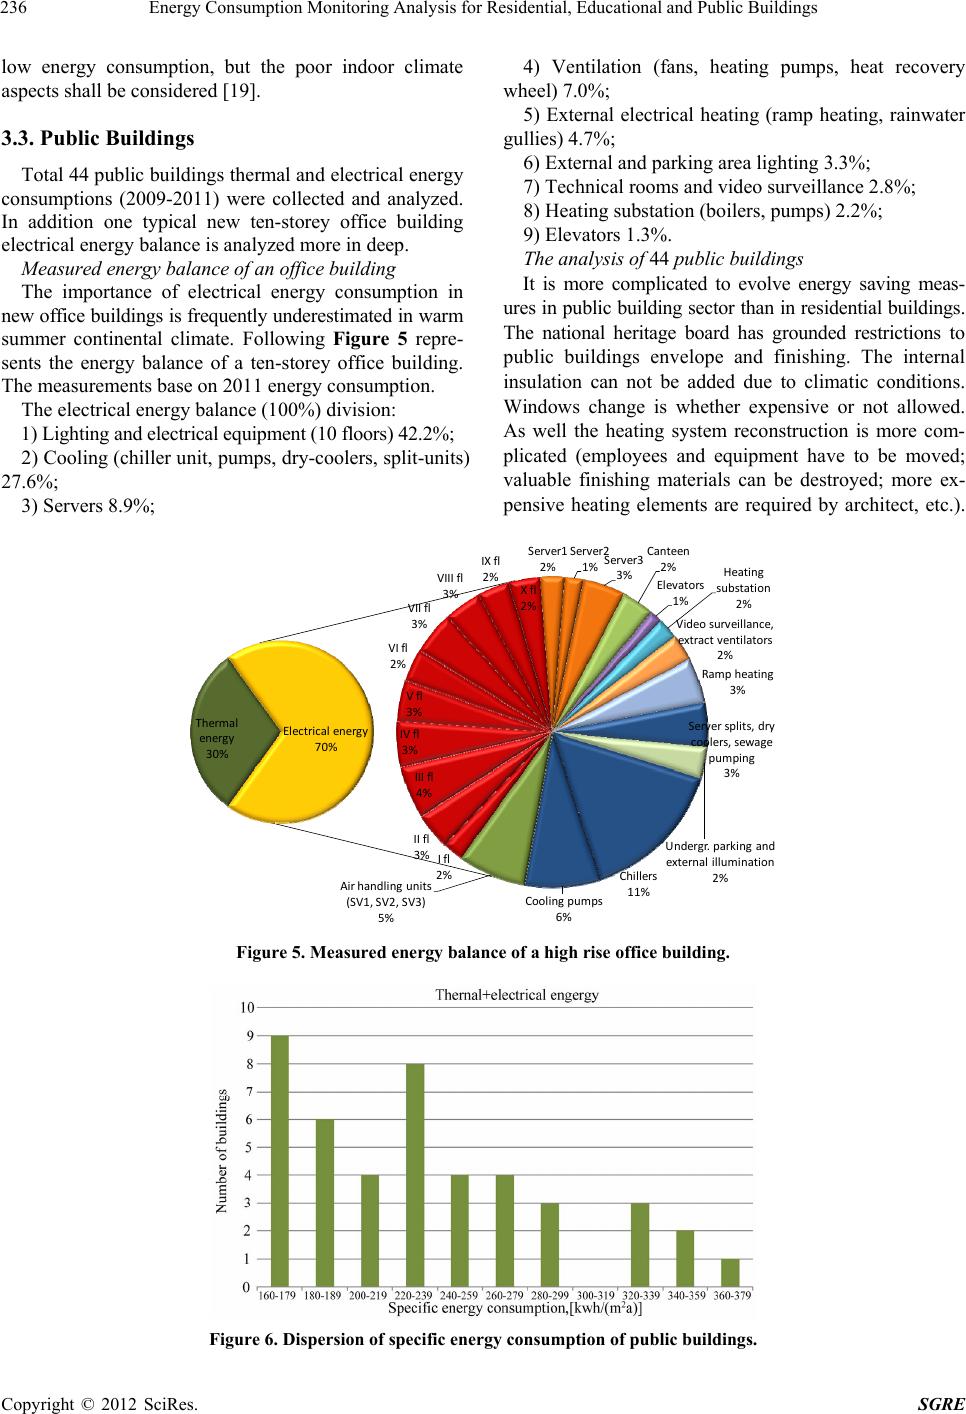
Public buildings
1) There are mainly two types of buildings: very old
cultural heritage buildings and new office buildings.
2) For old cultural heritage buildings the envelope re-
construction measures can be almost excluded (in some
cases window, door replacement and roof insulation can
be suggested).
3) Heat recovery ventilation ha s been installed in most
of the cases.
4) In new office building the electrical energy con-
sumption was 70% of total energy consumption. The
biggest electrical energy consumers were cooling system
and server rooms. The ramp heating set parameters shall
be also adjusted. In design phase the ventilation air ex-
change rates must be selected conservatively, but the
capacity of air handling units and main ducts shall be
selected with reservations. Furthermore, meeting rooms
location selection shall be well considered and VAV
systems designed.
5) Free cooling parameter adjustment according to real
room temperatures must be carried out.
6) Due to variable balance temperature during the year
the degree-day calculation method can not be used for
energy balance calculations. Minimally dynamic simula-
tion with validated consumption values is suggested.
7) The variation of public buildings specific energy
consumption is wide. Therefore systematic monitoring of
energy consumption and energy saving plan for each
building shall be suggested.
5. Acknowledgements
Estonian Ministry of Education and Research is greatly
acknowledged for funding and supporting this study.
European Social Foundation financing task 1.2.4 Coop-
eration of Universities and Innovation Development,
Doctoral School Project “Civil Engineering and Envi-
ronmental Engineering” code 1.2.0401.09-0080 has made
publishing of this article possible.
REFERENCES
[1] L. Pérez-Lombard, J. Ortiz and C. Pout, “A Review on
Buildings Energy Consumption Information,” Energy and
Buildings, Vol. 40, No. 3, 2008, pp. 394-398.
doi:10.1016/j.enbuild.2007.03.007
[2] B. Howard, L. Parshall, J. Thompson, S. Hammer, J.
Dickinson and V. Modi, “Spatial Distribution of Urban
Building Energy Consumption by End Use,” Energy and
Buildings, Vol. 45, 2012, pp. 141-151.
doi:10.1016/j.enbuild.2011.10.061
[3] M. Kolokotroni, X. Ren, M. Davies and A. Mavrogianni,
“London’s Urban Heat Island: Impact on Current and
Future Energy Consumption in Office Buildings,” Energy
and Buildings, Vol. 47, 2012, pp. 302-311.
doi:10.1016/j.enbuild.2011.12.019
[4] R. Choudhary, “Energy Analysis of the Non-Domestic
Building Stock of Greater London,” Building and Envi-
Copyright © 2012 SciRes. SGRE
Energy Consumption Monitoring Analysis for Residential, Educational and Public Buildings
238
ronment, Vol. 51, 2012, pp. 243-254.
doi:10.1016/j.buildenv.2011.10.006
[5] H. Xiao, Q. P. Wei and Y. Jiang, “The Reality and Statis-
tical Distribution of Energy Consumption in Office Build-
ings in China,” Energy and Buildings, Vol. 50, 2012, pp.
259-265. doi:10.1016/j.enbuild.2012.03.048
[6] J. Zhao, Y. J. Xin and D. D. Tong, “Energy Consumption
Quota of Public Buildings Based on Statistical Analysis,”
Energy Policy, Vol. 43, 2012, pp. 362-370.
doi:10.1016/j.enpol.2012.01.015
[7] R. Saidur, “Energy Consumption, Energy Savings, and
Emission Analysis in Malaysian Office Buildings,” En-
ergy Policy, Vol. 37, No. 10, 2009, pp. 4104-4113.
doi:10.1016/j.enpol.2009.04.052
[8] O. Morck, K. E. Thomsen and J. Rose, “The EU CON-
CERTO Project Class 1—Demonstrating Cost-Effective
Low-Energy Buildings—Recent Results with Special Fo-
cus on Comparison of Calculated and Measured Energy
Performance of DANISH Buildings,” Applied Energy,
Article in Press, 2012.
[9] K. E. Thomsen, J. M. Schultz and B. Poel, “Measured
Performance of 12 Demonstration Projects—IEA Task 13
‘Advanced Solar Low Energy Buildings’,” Energy and
Buildings, Vol. 37, No. 2, 2005, pp. 111-119.
doi:10.1016/j.enbuild.2004.01.036
[10] P. Raftery, M. Keane and A. Costa, “Calibrating Whole
Building Energy Models: Detailed Case Study Using
Hourly Measured Data,” Energy and Buildings, Vol. 43,
No. 12, 2011, pp. 3666-3679.
doi:10.1016/j.enbuild.2011.09.039
[11] E. Gratia and A. De Herde, “Design of Low Energy Of-
fice Buildings,” Energy and Buildings, Vol. 35, No. 5,
2003, pp. 473-491. doi:10.1016/S0378-7788(02)00160-3
[12] K. K. W. Wan, D. H. W. Li, D. L. Liu and J. C. Lam,
“Future Trends of Building Heating and Cooling Loads
and Energy Consumption in Different Climates,” Build-
ing and Environment, Vol. 46, No. 1, 2011, pp. 223-234.
doi:10.1016/j.buildenv.2010.07.016
[13] D. H. W. Li, T. N. T. Lam, S. L. Wong and E. K. W.
Tsang, “Lighting and Cooling Energy Consumption in an
Open-Plan Office Using Solar Film Coating,” Energy,
Vol. 33, No. 8, 2008, pp. 1288-1297.
doi:10.1016/j.energy.2008.03.002
[14] G. R. Newsham, S. Mancini and B. J. Birt, “Do LEED-
Certified Buildings Save Energy? Yes, But…,” Energy
and Buildings, Vol. 41, No. 8, 2009, pp. 897-905.
doi:10.1016/j.enbuild.2009.03.014
[15] W. J. Fisk, D. Black and G. Brunner, “Changing Ventila-
tion Rates in US Offices: Implications for Health, Work
Performance, Energy, and Associated Economics,” Build-
ing and Environment, Vol. 47, 2012, pp. 368-372.
doi:10.1016/j.buildenv.2011.07.001
[16] T.-A. Koiv, “Estonian Degree-Days,” Tallinn, 2007.
[17] A. Hani, T.-A. Koiv, H. Voll and M. Tali, “Energy Effi-
ciency in Residential Buildings. The Comparison between
Degree Day Calculation and Simulations,” Proceedings
of the 2nd International Scientific Energy and Climate
Change Conference, Athens, 8-9 October 2009, pp. 209-
213.
[18] T.-A. Koiv, “Estonian Government Ordinance No. 258,
2007 Minimum Requirements for Buildings Energy Per-
formance Additional Analysis,” Tallinn, 2009.
[19] A. Hani, T.-A. Koiv and A. Mikola, “Ventilating with
Room Units in Educational Institutions,” International
Journal of Energy and Environment, Vol. 5, No. 5, 2011,
pp. 629-636.
Copyright © 2012 SciRes. SGRE