Journal of Water Resource and Protection, 2012, 4, 686-693
http://dx.doi.org/10.4236/jwarp.2012.48079 Published Online August 2012 (http://www.SciRP.org/journal/jwarp)
Time Step Issue in Unit Hydrograph for
Improving Runoff Prediction
in Small Catchments
Dyah Indriana Kusumastuti, Dwi Jokowinarno
Department of Civil Engineering, University of Lampung, Bandar Lampung, Indonesia
Email: kusumast@gmail.com
Received May 20, 2012; revised June 20, 2012; accepted June 28, 2012
ABSTRACT
Unit hydrograph is a very practical tool in runoff prediction which has been used since decades ago and to date it re-
mains useful. Unit hydrograph method is applied in Way Kuala Garuntang, an ungauged catchment in Lampung Prov-
ince, Indonesia. To derive an observed unit hydrograph it requires rainfall and water level data with fine time scale
which are obtained from automatic gau ges. Observed un it hydrograph has an advantage that it is possible to derive it for
various time steps including those with time step less than an hour. In order to get a more accurate unit hydrograph, it is
necessary to derive a unit hydrograph with small time step for a small catchment such as those used in this study. The
study area includes Way Kuala Garuntang and its tributaries, i.e. Way Simpur, Way Awi with areas are 60.52 km2,
3.691 km2, and 9.846 km2 respectively. The results of this study high light the importance of time step selection on unit
hydrograph, which are shown to have a significant impact on the resulting unit hydrograph’s variables such as peak
discharge and time to peak.
Keywords: Unit Hydrograph; Time Step; Peak Discharge; Time to Peak
1. Introduction
The development of hydrology model in runoff predict-
tion is very advance, in which there are several methods
that can be used in runoff prediction in ungauged basin.
Especially with the existence of PUB (Prediction in Un-
gauged Basin) [1,2], there are several supporting tools
and methods which makes prediction possible in such
catchments. The choice of methods and tools are based
on available data in that region. The limitation of fine
data such as data from radar, leave little choice to carry
out prediction in some catchments. As many other
catchments in many parts of the world, Way Kuala Ga-
runtang is an ungauged catchment. There was no runoff
measurements recorded before. This increasingly grows
into significant matter as floods occur more frequently in
this region recently [3]. It is believed that one of the best
options to do runoff prediction is by taking runoff meas-
urements [4]. Therefore this study deals with instru-
menting this ungauged catchment to gain important in-
formation and carry out necessary analysis, as well as
predicting runoff using observed unit hydrograph (UH)
method.
Despite its conservative method, the unit hydrograph
approach to rainfall-runoff modelling remains a very
useful and practical approach to deal with operational
hydrological forecasting [5]. In this case UH model
structure is assumed to be appropriate to represent
catchment behavior by assuming two separately acting
functions, i.e. the production and the transfer functions
[5]. When a certain amount of rainfall reaches the ground,
some will loss due to infiltration or others, and there re-
mains a reduced part called the effective rainfall which
then transformed into direct runoff. This runoff is then
delayed and transferred to the outlet by various routing
mechanisms. Unit hydrograph is a linear transfer func-
tion that represents those mechanisms with an assump-
tion that the mechanisms behave similarly from event to
event.
The choice of using observed unit hydrograph, be-
cause this method is capable in pred icting time to peak of
runoff more accurately as this method can do the com-
putation for time step less than one hour. This obviously
an advantage of using observed unit hydrograph com-
pared to synthetic unit hydrographs (SUH) such as
Nakayasu, GAMA I and Snyder and other kind of SUH
which have time step of hour [6-9]. Time step becomes
an issue here as the selected catchments are small catch-
ments less than 100 km2 of area, which may need short
time concentration for the flow to propagate to the ou tlet.
Hence, this study aims to investigate the impact of time
C
opyright © 2012 SciRes. JWARP
D. I. KUSUMASTUTI, D. JOKOWINARNO 687
step selection in resulting unit hydrograph.
2. Methodology
2.1. Description of Study Area
The work took place in Way Kuala Garuntang catchment
including its two sub-catchments, Way Simpur and Way
Awi as presented in Figure 1). Way Simpur and Way
Awi are two neighbouring sub-catchments, while those
two sub-catchments are cascading to Way Kuala Garun-
tang catchment. The catchments located in Lampung
Province, Indonesia. The area of Way Simpur, Way Awi
and Way Kuala Garuntang catchments are 3.691 km2,
9.846 km2 and 60.52 km2 respectively. Three runoff
measurements were carried out, two in the tributaries i.e.
Way Simpur, Way Awi and one in the downstream of
Way Kuala Garuntang River. There is no runoff mea-
surements in these catchments before. In order to con-
struct an observed unit hydrograph, several things need
to be prepared. Three automatic water level recorder
(AWLR) needs to be installed in those locations, one for
each point. There is one tipping bucket raingauge located
in Way Kuala Garuntang catchment and the rainfall data
obtained from this raingauge is used to calculate the unit
hydrographs for each catchment.
The topography of upstream part of the catchment is
hilly and the slope is flatter toward downstream catch-
ment. Way Simpur and Way Awi, they are neighbouring
catchments but the catchment characteristic is slightly
different. Way Awi catchment is highly populated where
their house is located close to each other, therefore most
rainfall is transformed into runoff. During intense storm
event, flood comes quickly, but then releases in short
period of time. The channel width varies, where the
width at the location study is 8 meters. Way Simpur is
also a rural catchment and highly populated. The slight
difference is during intense storm event, flood comes
quickly but releases slight longer period of time com-
pared to release time in Way Awi. The channel width at
the location of study in Way Simpur is 7.5 meters and in
Way Kuala Garuntang the river has 9 meters width.
2.2. Rating Curves
Measurements of discharges and water levels at those
three points were carried out during wet season October
2009-April 2010. Velocities were measured using cur-
rent meter and water levels were observed using peil-
schaal attached on the river bank. Based on those meas-
urements, a rating curve for each point is determined and
results are presented in Figure 2. Rating curve for Way
Simpur (Figure 2(a)) shows the increase of water levels
resulted in lower increase of discharges compared to that
for Way Awi (Figure 2(b)), which is presented by
sharper slope of Way Awi’s rating curve. Please note that
the scales of rating curves for both Way Simpur and Way
Awi are the same, but differ from those of rating curve
for Way Kuala Garuntang. Rating curve for Way Kuala
Garuntang (Figure 2(c)) shows the extensive range of
discharges, which in the measurement for 1.2 m water
level causes discharge of about 25 m3/s.
2.3. Effective Rainfall
This study used a classic
index approach to determine the
effective rainfalls. Although there are quite a number of
approaches used to determine the effective rainfalls such
Way Kuala
Garuntang
Way Awi Way Simpur
Figure 1. Way Simpur, Way Awi and Kuala Garuntang catchments and the locations of the runoff gauges.
Copyright © 2012 SciRes. JWARP
D. I. KUSUMASTUTI, D. JOKOWINARNO
688
as Green Ampt infiltration and others,
index approach is
still widely used due to its simplicity. The approach pro-
duces a series of excess rainfall (PE) or effective rainfall
values from the observed gross rainfall (PG) values. The
only constraint is to fit the overall so-called “stormflow”
volume which is thought to have become runoff. Subse-
quently, the computed series of excess precipitation and
the observed discharge (Q) are used to calibrate the UH
in a ‘known input known output’ context [5].
The equation used to calculate
index is shown in Equa-
tions 1 and 2, where runoff depth (QDR) is a result of
volume of direct runoff (VDR) divided by catchment area
(A). Thus
index is the difference between gross rainfall (P)
and runoff depth (QDR) divided by time (t). Excess pre-
cipitation or effective rainfalls are obtained as gross pre-
cipitation subtracted by
index.
D
R
DR V
Q (1)
A
index
3. Results and Discussions
3.1. Flood Events, Time Steps and
index
There are several flood events recorded during wet
season 2009-2010, an d the even ts are presen ted in Tables
1 to 3 for flood events selected for Way Simpur
catchment (Table 1), Way Awi catchment (Table 2), and
Way Kuala Garuntang catchment (Table 3). For each
event, other related parameters such as rainfall depth,
rainfall duration, calculated
index are also presented.
Please note that the calculated
index are for three time
steps, i.e. 10, 30 and 60 minutes.
It can be seen that the first recorded flood event was in
December, although the start of wet season is in October.
This happened because the first few rains were mostly
infiltrated to fulfill soil moisture capacity. Furthermore,
flood events presented in Tables 1-3 are those which
can be used to develop unit hydrograph. The advantage
of using observed unit hydrograph to synthetic unit hy-
drograph su ch as Nakayasu, Snyder and GAMA 1 , is the
possibility to develop a unit hydrograph with finer time
D
R
PQ
t
(2)
0,0
0,4
0,8
1,2
0510 15 20 25 30
Water level, m
Disch arge, m
3
/s
0,0
0,2
0,4
0,6
0,8
0246810
Water level, m
Discharge, m
3
/s
0,0
0,2
0,4
0,6
0,8
0246810
Water level, m
Discharg e, m
3
/s
(a) (b) (c)
Figure 2. Rating curves for (a) Way Simpur; (b) Way Awi; and (c) Way Kuala Garuntang.
Table 1. Flood events selected for Way Simpur catchment.
No. Date Peak Discharge
(m3/sec) Rainfall Depth
(mm) Rainfall Duration
(hours)
index Time step
1 hr
index Time step
30 min
index Time step
10 min
1 16-01-2010 3.453 8 1 7.617 6.012 5.544
2 17-01-2010 6.437 6 1 5.225 2.908 -
3 17-01-2010 4.050 5.6 1 4.511 3.024 2.591
4 31-01-2010 3.769 10.8 2 9.273 4.044 2.006
5 01-02-2010 20.015 22.2 2 7.622 - -
6 04-02-2010 2.705 7.2 1 4.676 2.768 -
7 06-02-2010 1.339 2.8 1 2.554 1.854 0.757
Copyright © 2012 SciRes. JWARP
D. I. KUSUMASTUTI, D. JOKOWINARNO 689
Table 2. Flood events selected for Way Awi catchment.
No. Date Peak Discharge
(m3/sec) Rainfall Depth
(mm) Rainfall Duration
(hours)
index Time step
1 hr
index Time step
30 min
index Time step
10 min
1 08-01-2010 21.693 7.4 1 6.346 4.025 2.517
2 16-01-2010 17.354 7 1 5.640 3.038 3.147
3 17-01-2010 19.043 6.2 1 2.589 5.251 4.364
4 12-02-2010 14.426 8.6 2 6.170 4.965 2.868
Table 3. Flood events selected for Way Kuala Garuntang catchment.
No. Date Peak Discharge
(m3/sec) Rainfall Depth
(mm) Rainfall Duration
(hours)
index Time step
1 hr
index Time step
30 min
index Time step
10 min
1 25-12-2009 12.770 28.4 1 26.746 25.734 16.044
2 28-12-2009 31.426 10.2 1 5.315 3.717 1.259
3 31-12-2009 9.413 9.4 1 8.484 8.347 4.541
4 08-01-2010 14.111 7.4 1 5.826 1.790 4.506
5 10-01-2010 26.606 31.6 4 10.076 - -
6 13-01-2010 9.413 8.6 2 3.372 2.381 0.982
7 14-01-2010 19.509 5.8 1 3.184 2.44 -
8 16-01-2010 21.089 8 1 4.744 3.406 3.320
9 20-01-2010 19.234 8.2 1 5.516 5.646 2.216
10 27-01-2010 48.232 44.6 2 35.135 25.128 11.431
11 28-01-2010 15.205 19.6 1 18.054 18.053 12.834
12 01-02-2010 38.442 22.2 2 18.337 10.393 -
13 04-02-2010 23.164 7.2 1 3.935 1.832 0.700
14 05-02-2010 47.388 14 3 5.594 2.351 -
15 08-03-2010 28.895 15.8 1 13.869 6.698 -
16 10-03-2010 30.537 18.8 2 7.031 - -
17 13-03-2010 11.889 5.6 1 3.071 2.253 1.792
step, i.e. less than 1 hour. In this study time steps of 10,
30 and 60 minutes are used as presented in Tables 1-3
and Figures 4-6.
Calculated
index for each event and time step are pre-
sented in the last three columns of Tables 1-3. The first
event which is in December 25, 2009 shows large value
of
index, which can be understood as a lot of portion of
rains were infiltrated. The value of
index decreases for the
next few events, but increases considerably for these
subsequent events of 27-01-2010, 28-01-2010 and 1-02-
2010 and again on 8-03-2010. Therefore, it cannot be
concluded that the value of
index will decrease toward th e
peak of wet season (i.e. in January-March). In fact, the
value of
index is defined in such a way that the computed
series of excess precipitation suitable with the observed
discharge. In contrast to the absence of trend of
index
values in the flood events, the value of
index tends to de-
crease for smaller time step.
The results presented in Tables 1-3 and Figures 4-6
show that not all events which can be used to develop
unit hydrographs for a certain time step can be used to
develop those for smaller time steps. This may happ en as
the within storm rainfall pattern (distribution of rainfall
depth for each time step) is more detail for smaller time
step, so that for particular rainfall is not possible to get
the
index and volume of effectiv e rainfall which fit runoff
volume. This may also due to the selected method for
calculating effective rainfall which uses a linear approach
rather than non-linear approach such as Green-Apmt or
ther methods. o
Copyright © 2012 SciRes. JWARP
D. I. KUSUMASTUTI, D. JOKOWINARNO
690
0
10
20
30
40
123456
0
10
20
30
40
123456
0
5
10
15
20
basef low
direct runoff
0
5
10
15
20
Figure 3. Effective rainfall, baseflow separation and unit hydrograph.
0
1
2
3
060120 180240
time, minute s
d is cha rge , m
3
/s
16-Jan-10
17-Jan-10
31-Jan-10
6-Feb-10
0
1
2
3
060120 180 240
time, minutes
discharge, m
3
/s
16-Jan-10
17-Jan-10
17-Jan-10
31-Jan-10
4-Feb-10
6-Feb-10
0
1
2
3
060120
time, minut
discharge, m
3
/s
180 240
es
16-Jan-10
17-Jan-10
17-Jan-10
31-Jan-10
1-Feb-10
4-Feb-10
6-Feb-10
(a) (b) (c)
Figure 4. Observed unit hydr ogr a phs for Way Simpur using time steps (a) 10; (b) 30; and (c) 60 minutes.
3.2. Time Steps and Time to Peak
The unit hydrographs developed are presented in Figures
4-6, where Figures 4-6 show unit hydrographs of Way
Simpur, Way Awi and Way Kuala Garuntang respect-
tively. For each catchment, the unit hydrograph is devel-
oped for time step 10, 30 and 60 minutes. The advantage
of using small time step is to gain an understanding
about the real time to peak for the catchment. For the
case of Way Simpur (Figure 4), using time step of 10
minutes it can show that the average ti me to peak in that
catchment is 20 minutes. While using time step of 30 and
60 minutes show that the averages of time to peak are 30
and 60 minutes respectively. Among those three time
steps, it seems that time to peak resulted from time step
of 10 minutes is the most resonable as the catchment is a
Copyright © 2012 SciRes. JWARP
D. I. KUSUMASTUTI, D. JOKOWINARNO 691
0
2
4
6
060120 180240
time, minute s
discharge, m
3
/s
8-Jan-10
16-Jan-10
17-Jan-10
12-Feb-10
0
2
4
6
060120 180 240
time, minutes
d is cha r ge , m
3
/s
8-Jan-10
16-Jan-10
17-Jan-10
12-Feb-10
0
2
4
6
060 120
time, min
discharge, m
3
/s
180 240
utes
8-Jan-10
16-Jan-10
17-Jan-10
12-Feb-10
(a) (b) (c)
Figure 5. Observed unit hydr ogr a phs for Way Awi using time steps (a) 10; (b) 30; and (c) 60 minutes.
0
2
4
6
8
10
12
0120240 360 480600 720 8409601080
time, minute s
dis charge, m3 /s
25-Dec-09
28-Dec-09
31-Dec-09
0
2
4
6
8
10
12
0120240 360480 600720 8409601080
ti me , m inu tes
di sch ar ge, m3/s
8-Jan-10
13-Jan-10
16-Jan-10
20-Jan-10
27-Jan-10
28-Jan-10
0
2
4
6
8
10
12
0120 240 360480 6
time , pe r 10
disch ar g e, m3/s
00 720 840 9601080
mi nute s
4-Feb-10
13-Mar-10
diacharge, m
3
/s
diacharge, m
3
/s
diacharge, m
3
/s
Time step: 10 minutes
0
2
4
6
8
10
12
14
0120 240360480600 720 840 9601080
ti me, minutes
d is c ha rge , m
3
/s
25-Dec-09
28-Dec-09
31-Dec-09
0
2
4
6
8
10
12
14
0120 240360 4806007208409601080
time, minutes
d is c ha rge , m
3
/s
8-Jan-10
13-Jan-10
14-Jan-10
16-Jan-10
20-Jan-10
27-Jan-10
28-Jan-10
0
2
4
6
8
10
12
14
0120240360 480 60
time, mi
d is c ha rge , m
3
/s
0 720840 9601080
nutes
1-Feb-10
4-Feb-10
5-Feb-10
8-Mar-10
13-Mar-10
Time step : 30 minutes
0
2
4
6
8
10
0120 240 360480 600720 8409601080
time, min u tes
d ischarge, m
3
/s
25-Dec-09
28-Dec-09
31-Dec-09
0
2
4
6
8
10
0120 240 360480 600 7208409601080
time, minute s
dis c harge , m
3
/s
8-Jan-10
10-Jan-10
13-Jan-10
14-Jan-10
16-Jan-10
20-Jan-10
27-Jan-10
28-Jan-10
0
2
4
6
8
10
0120240 360 4806
time, min
dis c harge , m
3
/s
00 720 8409601080
utes
1-Feb-10
4-Feb-10
5-Feb-10
8-Mar-10
10-Mar-10
13-Mar-10
Time step : 1 hour
Figure 6. Observed unit hydrographs for Way Kuala Garuntang according to the months using time steps 10, 30 and 60
inutes. m
Copyright © 2012 SciRes. JWARP
D. I. KUSUMASTUTI, D. JOKOWINARNO
692
considered small.
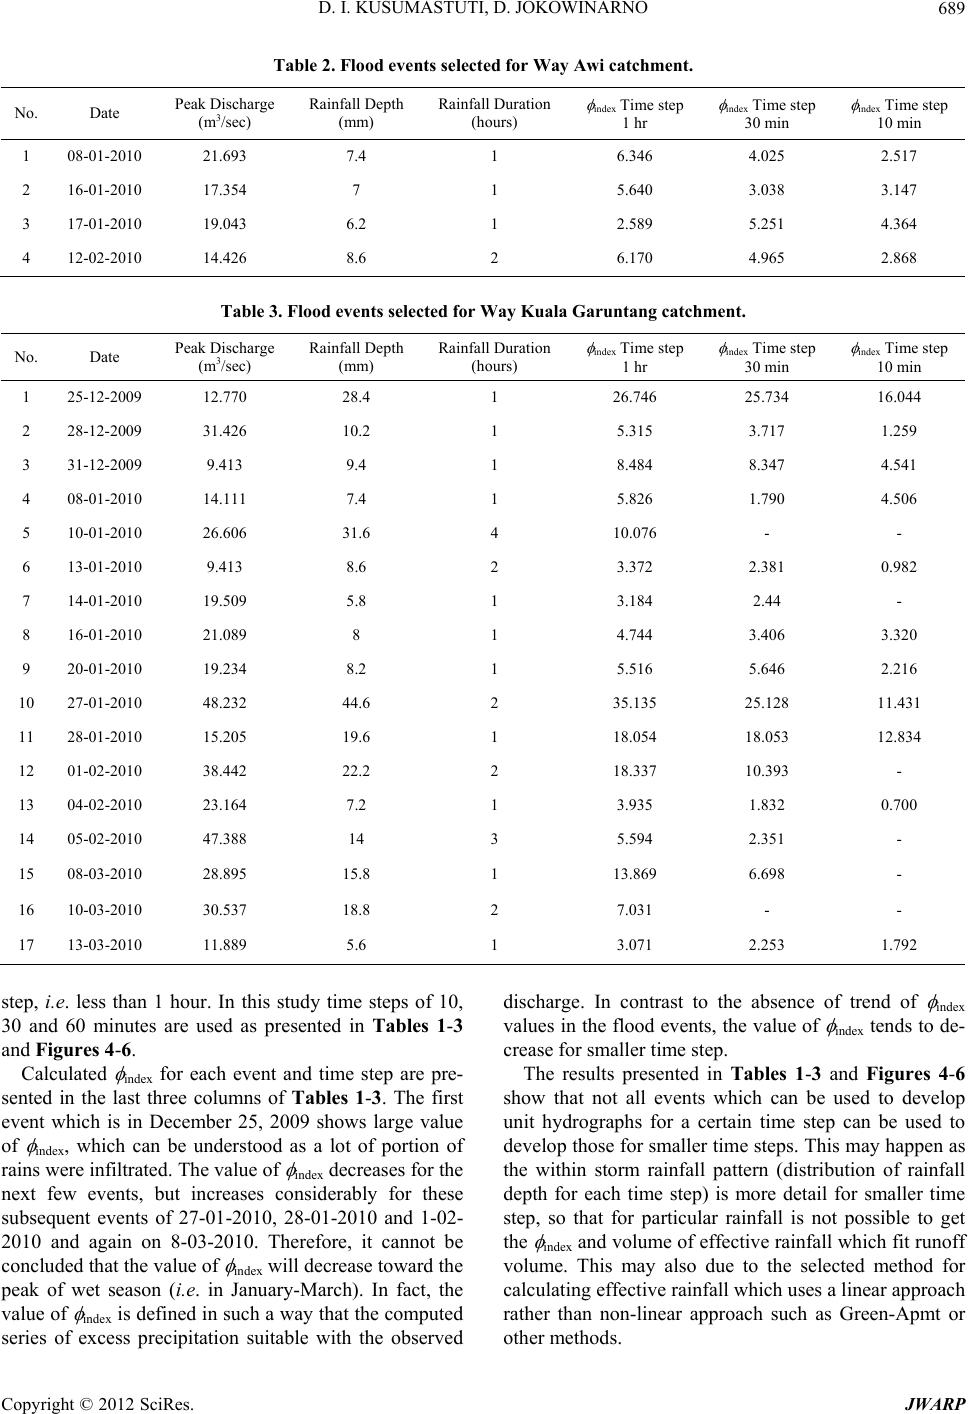
For Way Awi (Figure 5), using different time steps
also show different results for time to peak. Using time
step of 10, 30 and 60 minutes resulted in aver age time to
peak of 30, 30 and 60 minutes respectively. Again,
smaller time step gives more reasonable results in indi-
cating time to peak.
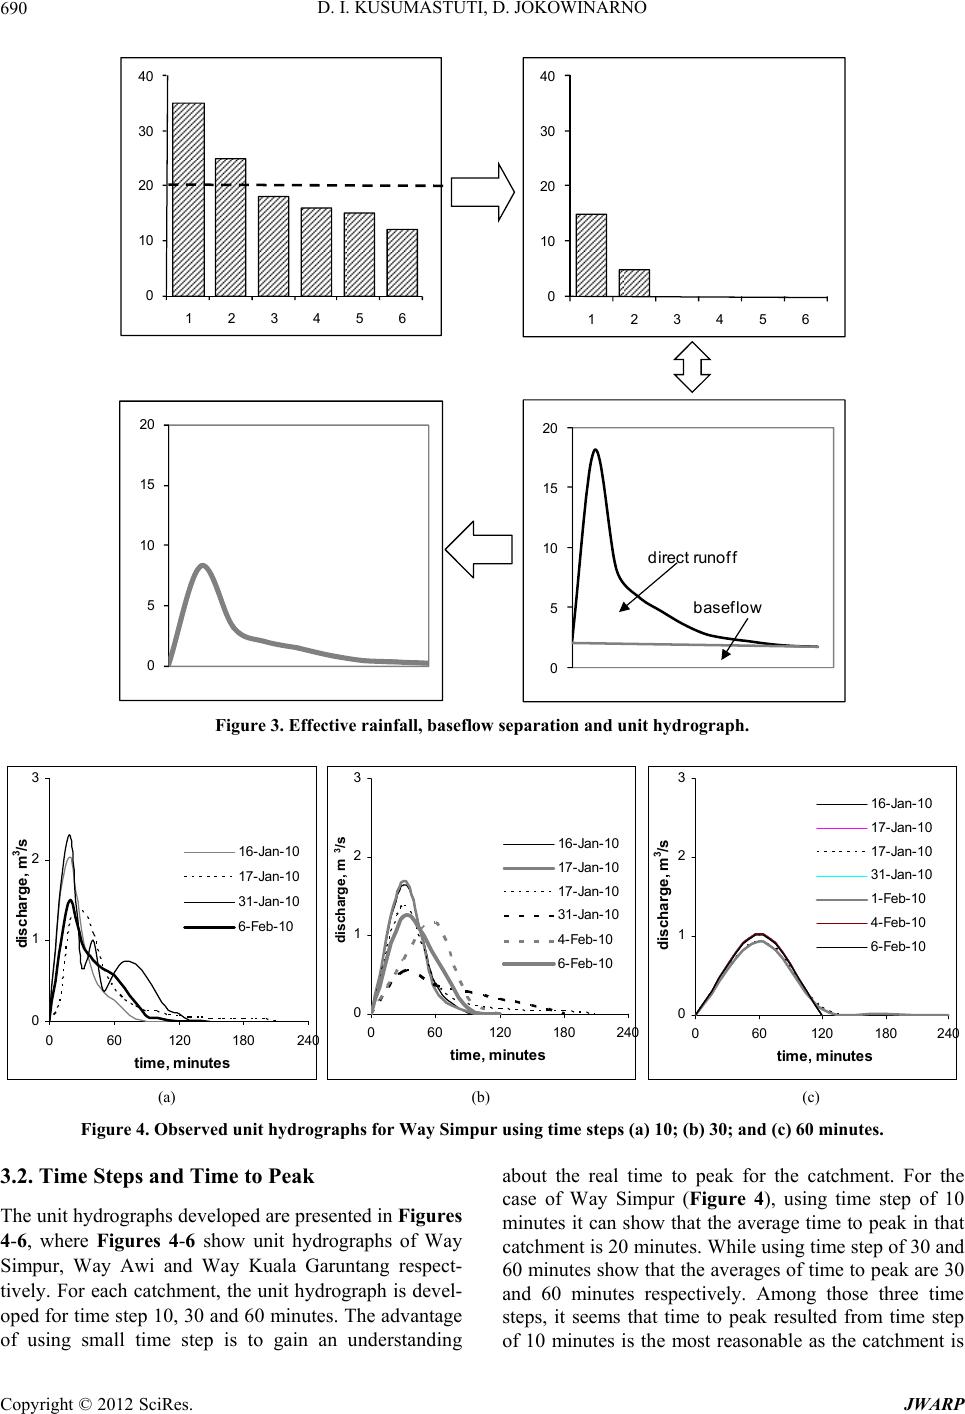
For Way Kuala Garuntang, in addition to time step, the
unit hydrographs are also made into three groups ac-
cording to the months. The groups are for December,
January, as well as February and March events (Figure
6). The average time to peak for time step of 10 minutes
is 30, 60 and 60 minutes for December, January and
February-March events respectively. While the average
time to peak for time steps of 10 minutes for overall
events is 60 minutes. For time step of 30 minutes, the
average time to peak is 30, 60, 60 and 60 minutes for
December, January, February-March and overall events
respectively. The average time to peak for time step of 60
minutes is 60 minutes for December, January, February-
March and overall events. For a larger catchment such as
Way Kuala Garuntang, smaller time steps confirm time
to peak as resulted from larger time step. In this case, it is
predicted that the appropriate time to peak for Way
Kuala Garu ntang is 60 minutes.
3.3. Time Steps and Peak Discharges
In addition to time to peak, another important issue with
regard to unit hydrog raph is the peak discharge. For Way
Simpur (Figure 4) peak discharges for all time steps are
in the range of 0.5 - 2.4 m3/s, where the average peak
discharges for time steps 10, 30 and 60 minutes are 1.8
m3/s, 1.2 m3/s and 1 m3/s respectively. Please note that in
fact there are seven peak discharges in the unit hydro-
graphs for Way Simpur using time step 60 minutes (Fig-
ure 4(c)), which seems to be sorted into two groups be-
cause five of them are in the range of 1.023 - 1.028 m3/s
and the other two are 0.931 and 0.937 m3/s. Therefore it
looks like there are only two curves as the outcome of
seven flood events (Figure 4(c)).
For Way Awi (Figure 5) the average peak discharges
for time steps 10, 30 and 60 minutes are 4.1 m3/s, 3.7
m3/s and 1.8 m3/s respectively. The results show the
smaller the time step the larger the peak discharge. This
happen because only selected flood events which have
high rainfall intensity during short time interval are able
to be utilized in con structing unit hydrograph. Therefore,
the rainfall intensity is larger at smaller time step which
impacts on larger peak discharge.
The average peak discharges for Way Kuala Garun-
tang for December, January and February-March events
(Figure 6) using time step 10 minutes are 7.7 m3/s, 4.5
m3/s and 4.2 m3/s respectively, using time step 30 min-
utes are 5.8 m3/s, 4.7 m3/s and 7.4 m3/s respectively and
using time step 60 minutes are 4 m3/s, 4.6 m3/s and 5.2
m3/s respectively. While the trend of average peak dis-
charges seem opposite for time step 10 minutes, the trend
of those for other time steps shows there is an increase of
average peak discharges toward the peak of wet season.
For February-March flood events there were only two
out of six flood events which were able to be utilized in
unit hydrograph using time step 10 minutes, and there
were only six out of eight even ts for January flood even ts
could be utilized for 10 minute time step hydrograph.
Meanwhile, all three flood events in December could be
used for 10 minute time step hydrograph. Therefore the
results from using time step 10 minutes show inconsis-
tent trend with regard to the wetter season as the lack of
data.
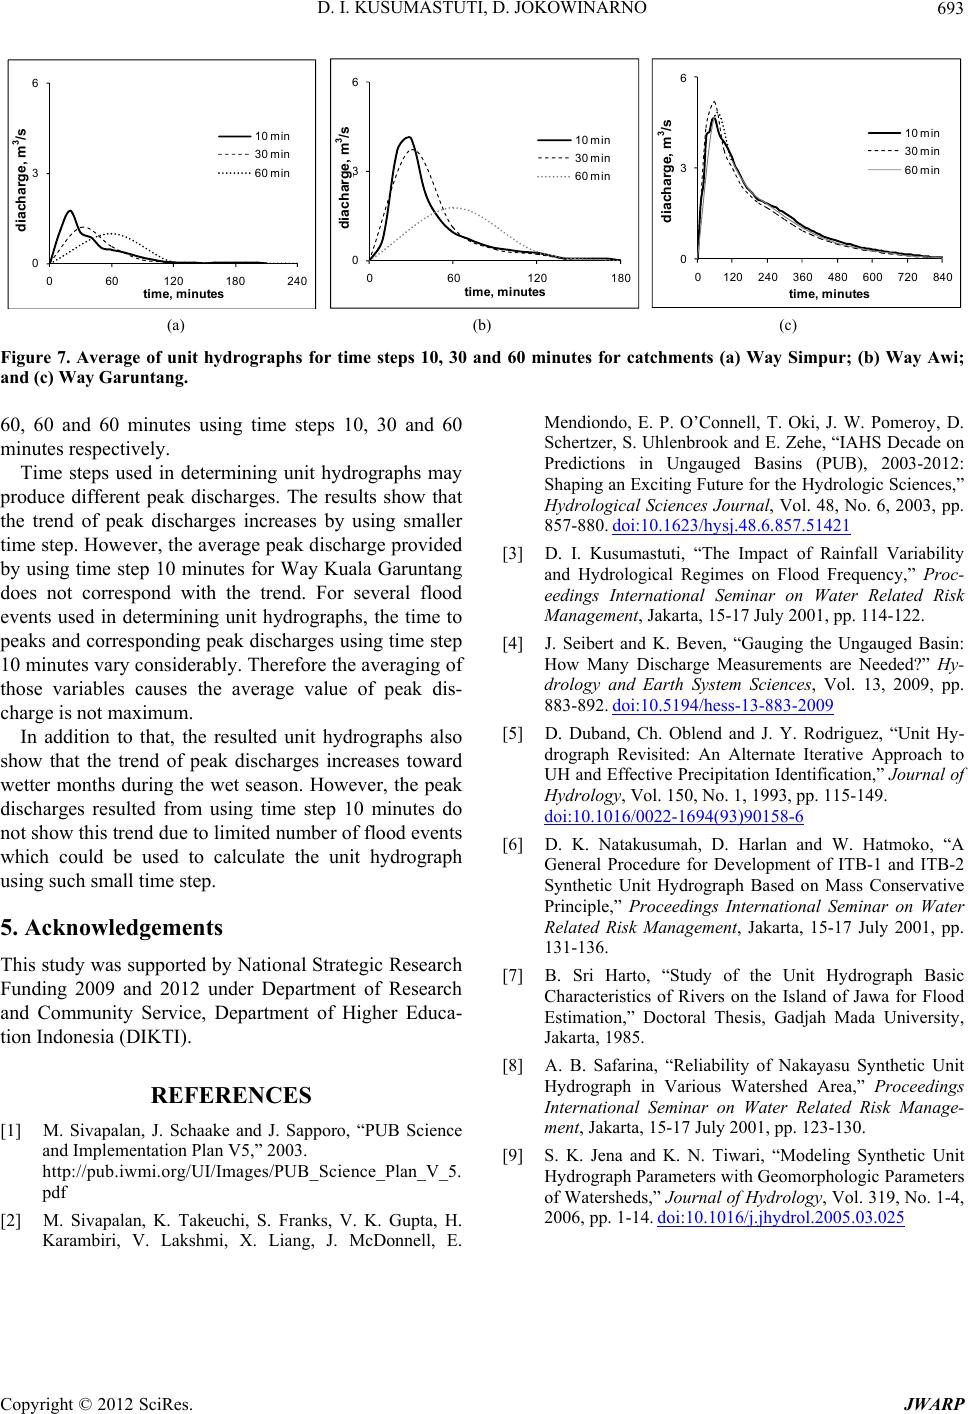
3.4. The Average of Unit Hydrographs for
Different Time Steps
Comparing the results between those three catchments
there is a general trend of average peak discharge, i.e. the
higher the time step, the lower the average peak dis-
charge (Figure 7). This trend does not fully work for
Way Garuntang as the peak discharge using time step 10
minutes is lower compare to that using time step 30 and
60 minutes. Considering overall events for Way Kuala
Garuntang, average peak discharges for time steps 10, 30
and 60 minutes are 4.64 m3/s, 5.2 m3/s and 4.7 m3/s. Al-
though in nearly all unit hydrographs, peak discharges
resulted from using time step 10 minutes are larg er com-
pared to peak discharges resulted from using larger time
step. This may happen because the method in calculating
the average peak discharge is so simple, that is simply
taking the average of the events for particular time step,
both for the discharge and time to peak. Furthermore,
peak discharge is closely related to time to peak. Using
small time step, time to peak may vary significantly be-
tween 10 to 60 minutes. Considering peak discharges
which occur at various time to peak, this may result in
low average of peak discharge as in the case of average
peak discharge of Way Kuala Garuntang using time step
10 minutes.
4. Conclusions
This study shows the impact of time steps on un it hydro-
graphs with regard to time to peaks and peak discharges.
In general, smaller time step gives more accurate resulted
unit hydrographs. It was observed that the average time
to peaks for Way Simpur are 20, 30 and 60 minutes using
time steps 10, 30 and 60 minutes respectively. The aver-
age time to peaks for Way Awi are 30, 30 and 60 minutes
using time steps 10, 30 and 60 minutes respectively. And
he average time to peaks for Way Kuala Garuntang are t
Copyright © 2012 SciRes. JWARP
D. I. KUSUMASTUTI, D. JOKOWINARNO 693
0
3
6
060 120
discharge, m3/s
t ime , min u
180 240
tes
10 min
30 min
60 min
diacharge, m
3
/s
0
3
6
0 60
disch ar ge, m3/ s
time, minut
120 180
es
10 min
30 min
60 min
diacharge, m
3
/s
0
3
6
0120 240360 480 600 720 840
discharge, m 3/s
t ime , min ut e s
10 min
30 min
60 min
3
/s diacharge, m
(a) (b) (c)
Figure 7. Average of unit hydrographs for time steps 10, 30 and 60 minutes for catchments (a) Way Simpur; (b) Way Awi;
and (c) Way Garuntang.
60, 60 and 60 minutes using time steps 10, 30 and 60
minutes respectively.
Time steps used in determining unit hydrographs may
produce different peak discharges. The results show that
the trend of peak discharges increases by using smaller
time step. However, the average peak discharge provided
by using time step 10 minutes for Way Kuala Garuntang
does not correspond with the trend. For several flood
events used in determining unit hydrographs, the time to
peaks and corresponding peak discharges using time step
10 minutes vary considerably. Therefore the averaging of
those variables causes the average value of peak dis-
charge is not maximum.
In addition to that, the resulted unit hydrographs also
show that the trend of peak discharges increases toward
wetter months during the wet season. However, the peak
discharges resulted from using time step 10 minutes do
not show this trend du e to limited nu mber of flood ev ents
which could be used to calculate the unit hydrograph
using such small time step.
5. Acknowledgements
This study was supported by Nationa l Strategic Research
Funding 2009 and 2012 under Department of Research
and Community Service, Department of Higher Educa-
tion Ind on esia (DIKTI) .
REFERENCES
[1] M. Sivapalan, J. Schaake and J. Sapporo, “PUB Science
and Implementation Plan V5,” 2003.
http://pub.iwmi.org/UI/Images/PUB_Science_Plan_V_5.
pdf
[2] M. Sivapalan, K. Takeuchi, S. Franks, V. K. Gupta, H.
Karambiri, V. Lakshmi, X. Liang, J. McDonnell, E.
Mendiondo, E. P. O’Connell, T. Oki, J. W. Pomeroy, D.
Schertzer, S. Uhlenbrook and E. Zehe, “IAHS Decade on
Predictions in Ungauged Basins (PUB), 2003-2012:
Shaping an Exciting Future for the Hydrologic Sciences,”
Hydrological Sciences Journal, Vol. 48, No. 6, 2003, pp.
857-880. doi:10.1623/hysj.48.6.857.51421
[3] D. I. Kusumastuti, “The Impact of Rainfall Variability
and Hydrological Regimes on Flood Frequency,” Proc-
eedings International Seminar on Water Related Risk
Management, Jakarta, 15-17 July 2001, pp. 114-122.
[4] J. Seibert and K. Beven, “Gauging the Ungauged Basin:
How Many Discharge Measurements are Needed?” Hy-
drology and Earth System Sciences, Vol. 13, 2009, pp.
883-892. doi:10.5194/hess-13-883-2009
[5] D. Duband, Ch. Oblend and J. Y. Rodriguez, “Unit Hy-
drograph Revisited: An Alternate Iterative Approach to
UH and Effective Precipitation Identification,” Journal of
Hydrology, Vol. 150, No. 1, 1993, pp. 115-149.
doi:10.1016/0022-1694(93)90158-6
[6] D. K. Natakusumah, D. Harlan and W. Hatmoko, “A
General Procedure for Development of ITB-1 and ITB-2
Synthetic Unit Hydrograph Based on Mass Conservative
Principle,” Proceedings International Seminar on Water
Related Risk Management, Jakarta, 15-17 July 2001, pp.
131-136.
[7] B. Sri Harto, “Study of the Unit Hydrograph Basic
Characteristics of Rivers on the Island of Jawa for Flood
Estimation,” Doctoral Thesis, Gadjah Mada University,
Jakarta, 1985.
[8] A. B. Safarina, “Reliability of Nakayasu Synthetic Unit
Hydrograph in Various Watershed Area,” Proceedings
International Seminar on Water Related Risk Manage-
ment, Jakarta, 15-17 July 2001, pp. 123-130.
[9] S. K. Jena and K. N. Tiwari, “Modeling Synthetic Unit
Hydrograph Parameters with Geomorphologic Parameters
of Watersheds,” Journal of Hydrology, Vol. 319, No. 1-4,
2006, pp. 1-14. doi:10.1016/j.jhydrol.2005.03.025
Copyright © 2012 SciRes. JWARP