Paper Menu >>
Journal Menu >>
 J. Biomedical Science and Engineering, 2010, 3, 719-726 JBiSE doi:10.4236/jbise.2010.37096 Published Online July 2010 (http://www.SciRP.org/journal/jbise/). Published Online July 2010 in SciRes. http://www.scirp.org/journal/jbise A novel voting system for the identification of eukaryotic genome promoters Lin Lei3, Kaiyan Feng4, Zhisong He5, Yudong Cai1,2* 1Institute of System Biology, Shanghai University, Shanghai, China; 2Centre for Computational Systems Biology, Fudan University, Shanghai, China; 3School of Computer Engineering, Nanyang Technological University, Singapore; 4Division of Imaging Science & Biomedical Engineering, The University of Manchester, Manchester, UK; 5Department of Bioinformatics, College of Life Sciences, Zhejiang University, Hangzhou, China. Email: cai_yud@yahoo.com.cn Received 5 April 2010; revised 6 May 2010; accepted 9 May 2010. ABSTRACT Motivation: Accurate identification and delineation of promoters/TSSs (transcription start sites) is im- portant for improving genome annotation and devis- ing experiments to study and understand transcrip- tional regulation. Many promoter identifiers are de- veloped for promoter identification. However, each promoter identifier has its own focuses and limita- tions, and we introduce an integration scheme to combine some identifiers together to gain a better prediction performance. Result: In this contribution, 8 promoter identifiers (Proscan, TSSG, TSSW, FirstEF, eponine, ProSOM, EP3, FPROM) are cho- sen for the investigation of integration. A feature se- lection method, called mRMR (Minimum Redun- dancy Maximum Relevance), is novelly transferred to promoter identifier selection by choosing a group of robust and complementing promoter identifiers. For comparison, four integration methods (SMV, WMV, SMV_IS, WMV_IS), from simple to complex, are developed to process a training dataset with 1400 se- quences and a testing dataset with 378 sequences. As a result, 5 identifiers (FPROM, FirstEF, TSSG, epo- nine, TSSW) are chosen by mRMR, and the integra- tion of them achieves 70.08% and 67.83% correct prediction rates for a training dataset and a testing dataset respectively, which is better than any single identifier in which the best single one only achieves 59.32% and 61.78% for the training dataset and testing dataset respectively. Keywords: MRMR (Minimum Redundancy Maximum Relevance); Transcription Start Sites (TSS); Promoter Identification; Promoter Identifier Integration 1. INTRODUCTION Promoter, a short DNA sequence, is the binding site of RNA polymerases. It determines the transcription start site (TSS). After RNA polymerase binding to a promoter, the promoter initiates the transcription and indicates where the transcription should start. In order to be rec- ognized by the RNA polymerases, the structure of pro- moters is rather stable, e.g. in eukaryotic genome, many promoters contain TATA box, which can help locate promoters by searching TATA sequences. Besides TATA box, functional motifs, oligonucleotide composition and compositional features are also used for promoter identi- fication [1-8]. However, each promoter identifier has its own focuses. Even when the same identification strategy is applied by some different identifiers, they differ in detail. Since some promoter identifiers maybe comple- ment with each other because their principles are differ- ent, their integration will be able to enhance the pro- moter identification performance [9,10]. This paper in- vestigates a novel way to combine some promoter iden- tifiers together to improve the identification rate. Voting has long been recognized as a useful integra- tion tool to improve the robustness of a decision system. Nearly all investigations find that if a decision gains the majority votes, that decision is more likely to be the right decision. These investigations are found in all kinds of research areas, including pattern recognitions [11-13], character and hand-writing recognitions [14-17], image analysis [18,19], credit card slip processing [20] and speaker identification [21]. Voting has also been applied to identify promoters/TSSs [9,22]. In [10], 6 promoter identifiers were investigated, and 5 of them were integrated to enhance the recognition rate by ex- cluding a non user-friendly and poor-performed on-line promoter identifier. In a recent work [22], Won et al.  L. Lei et al. / J. Biomedical Science and Engineering 3 (2010) 719-726 Copyright © 2010 SciRes. JBiSE 720 investigated 8 promoter/TSS (transcription start site) identifiers and tried to find out what combinations were best for the identification. They introduced a cut-off value to exclude any promoter identifiers whose identi- fication rate was lower than the cut-off value. However, the work in [22] did not take consideration of the order of adding the promoters into the integration, whereas, the order will also affect the identification performance, as will be explained later in the paragraph. In this study, 8 promoter identifiers (Proscan, TSSG, TSSW, FirstEF, eponine, ProSOM, EP3, FPROM) are investigated. For the eight promoter identifiers, two criteria should be considered for the integration: firstly, the better the iden- tifiers perform, the more preferable the identifiers should be chosen, and secondly, dissimilar/less-correlated iden- tifiers complement each other better and are also more preferable to be chosen. The first criterion is straight- forward. The second criterion is applied because similar identifiers may strengthen each other and dominate the decisions, e.g. if one identifier is used twice, the decision will be biased towards this identifier. Similarly, if too many identifiers are similar to each other, the decision will be biased towards that type of identifiers. Since the two criteria could be incompatible with each other, op- timization is needed to balance both criteria. In this pa- per, identifiers are selected one by another. The order of the identifiers for the selection is important, illustrated by the following example. Suppose 4 identifiers 1 i, 2 i, 3 i and 4 i are under examination and the combination of 1 i and 2 i produces best results, if identifiers are added according to the list [1 i,4 i,3 i,2 i], the optimized combination can never be found. Thus following the two criteria to make a list is important. mRMR (minimum Redundancy Maximum Relevance) method [23] is origi- nally developed for feature selection, and is transferred into the selection of promoter identifiers to satisfy the two criteria. mRMR tries to maximize the relevance be- tween variables and the targets, which is in accordance with criterion 1, and at the same time, minimize the re- dundancy between variables, which is in accordance with criterion 2. mRMR is introduced in detail in section 2.3. However, voting cannot solve the intrinsic problems of individual identifiers and the right decision of one identifier will be ignored if most of identifiers vote for the wrong decision. Therefore, future researches are still needed. For comparison, four integration methods SMV (sim- ple majority voting), WMV (weighted majority voting), SMV_IS (simple majority voting plus identifier selection) and WMV_IS (weighted majority voting plus identifier selection), from simple to complex, are developed to process a training dataset with 1400 sequences and a testing dataset with 378 sequences. As a result, WMV_ IS achieves the best TSS-based recognition rates with 70.08% and 67.83% correct recognition rates for the training dataset and testing dataset respectively. 2. MATERIAL AND METHODS 2.1. Datasets The EPD (The Eukaryotic Promoter Database Current Release 95, http://www.epd.isb-sib.ch/) [24], a promoter database of the EMBL Data Library, is an annotated non-redundant collection of experimentally determined eukaryotic polymerase II promoters. Since promoters are defined and confirmed by experimentally determined TSSs, the underlying promoter definition is given by the position of TSS in EPD database. First, 1871 human gene sequences were downloaded from the EPD website, and 1778 DNA sequences were chosen by excluding any sequence containing missing base pairs. The sequence length is 1.5 kb while the true TSS is located at a random position on the sequence. These 1778 sequences are then divided into a training dataset with 1400 sequences and a testing dataset with 378 sequences randomly. The training dataset is evalu- ated by 5-fold cross-validation to obtain the recognition rates for each promoter identifier. These recognition rates are later fed back to weight the identifiers in voting for both training and testing dataset. Since the recogni- tion rates are gained from the training dataset and then fed back to the training dataset for weighting, the recog- nition might be biased. However, since the identification accuracy is rather stable especially with a large dataset, the bias is neglectable. For scrutiny, a testing dataset is independently used for testing by taking the promoter recognition rates from the training dataset. Please refer to supplemental material 1 and supplemental material 2 for the training datasets and the testing datasets respec- tively. 2.2. Promoter Identifiers Many TSS predictors are available on the internet. Eight identifiers are chosen as they have been actively main- tained and widely used. These identifiers are Proscan, TSSG, TSSW, FirstEF, eponine, ProSOM, EP3, FPROM. Detail of these identifiers can be found in Supplemental Material 3. Their different recognition mechanisms and mathematical architectures may enable them to comple- ment each other during voting. 2.3. MRMR (Minimum Redundancy Maximum Relevance) Minimum Redundancy Maximum Relevance (mRMR) [23] is first developed by Peng. In mRMR analysis, a good feature is characterized by its relevance with the target variable and its correlation with other features – it will be more likely to be chosen if it is more relevant to 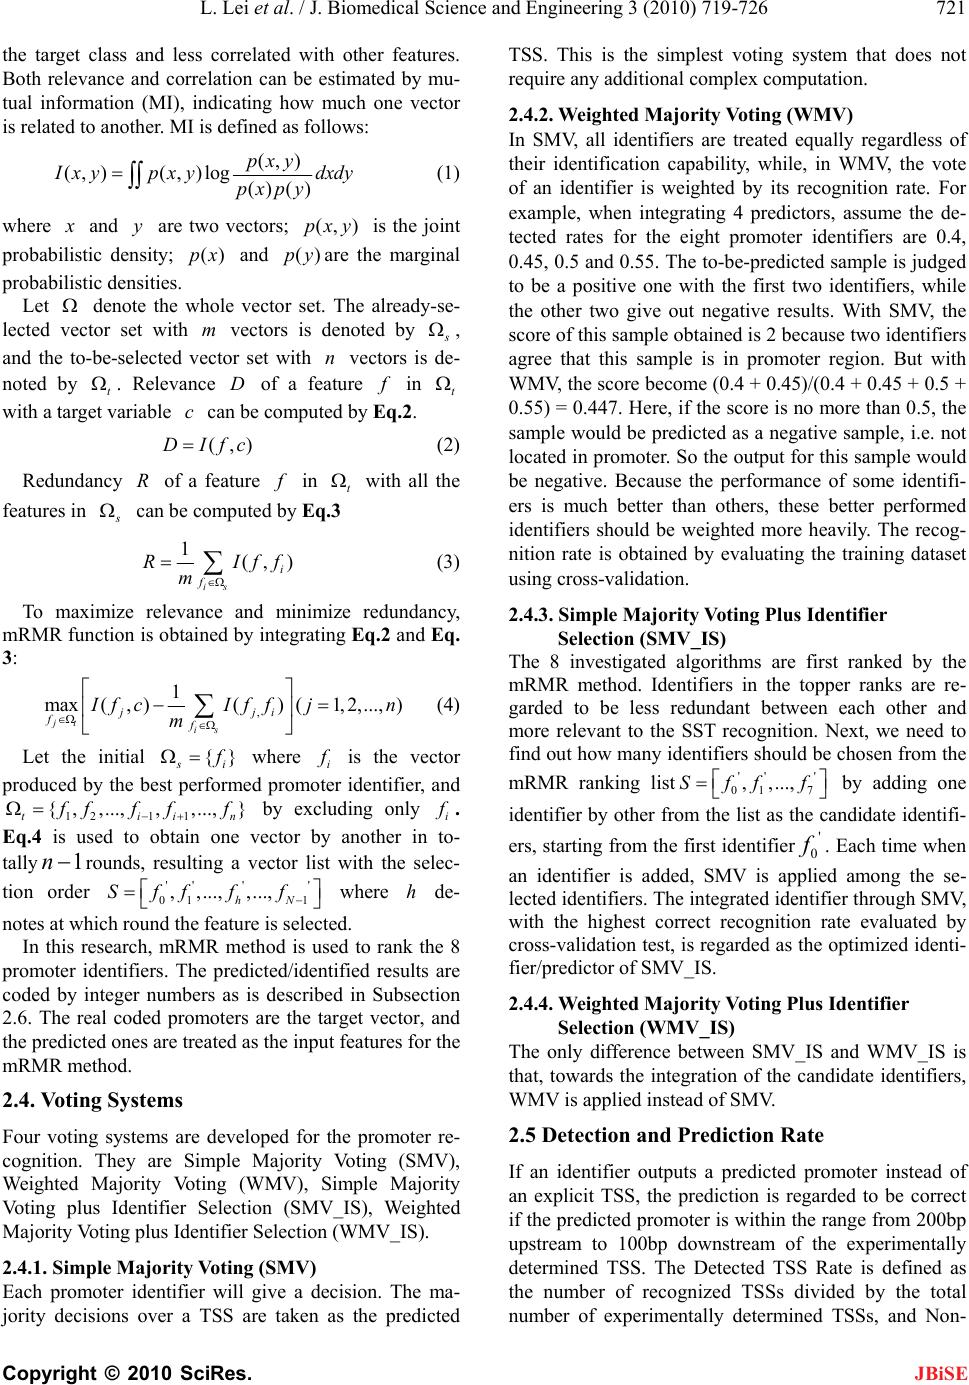 L. Lei et al. / J. Biomedical Science and Engineering 3 (2010) 719-726 Copyright © 2010 SciRes. JBiSE 721 the target class and less correlated with other features. Both relevance and correlation can be estimated by mu- tual information (MI), indicating how much one vector is related to another. MI is defined as follows: (, ) (, )(, )log()() px y I xy pxydxdy pxpy (1) where x and y are two vectors; (, )pxy is the joint probabilistic density; ()px and ()pyare the marginal probabilistic densities. Let denote the whole vector set. The already-se- lected vector set with m vectors is denoted by s , and the to-be-selected vector set with n vectors is de- noted by t . Relevance D of a feature f in t with a target variable c can be computed by Eq.2. (,)DIfc (2) Redundancy R of a feature f in t with all the features in s can be computed by Eq.3 1(, ) is i f RIff m (3) To maximize relevance and minimize redundancy, mRMR function is obtained by integrating Eq.2 and Eq. 3: , 1 max(,)()(1, 2,...,) jt is jji ff I fcIff jn m (4) Let the initial {} s i f where i f is the vector produced by the best performed promoter identifier, and 121 1 { ,,...,,,...,} tiin fff ff by excluding only i f. Eq.4 is used to obtain one vector by another in to- tally 1nrounds, resulting a vector list with the selec- tion order '' '' 01 1 , ,...,,..., hN Sff ff where h de- notes at which round the feature is selected. In this research, mRMR method is used to rank the 8 promoter identifiers. The predicted/identified results are coded by integer numbers as is described in Subsection 2.6. The real coded promoters are the target vector, and the predicted ones are treated as the input features for the mRMR method. 2.4. Voting Systems Four voting systems are developed for the promoter re- cognition. They are Simple Majority Voting (SMV), Weighted Majority Voting (WMV), Simple Majority Voting plus Identifier Selection (SMV_IS), Weighted Majority Voting plus Identifier Selection (WMV_IS). 2.4.1. Simple Majority Voting (SMV) Each promoter identifier will give a decision. The ma- jority decisions over a TSS are taken as the predicted TSS. This is the simplest voting system that does not require any additional complex computation. 2.4.2. Weighted Majority Voting (WMV) In SMV, all identifiers are treated equally regardless of their identification capability, while, in WMV, the vote of an identifier is weighted by its recognition rate. For example, when integrating 4 predictors, assume the de- tected rates for the eight promoter identifiers are 0.4, 0.45, 0.5 and 0.55. The to-be-predicted sample is judged to be a positive one with the first two identifiers, while the other two give out negative results. With SMV, the score of this sample obtained is 2 because two identifiers agree that this sample is in promoter region. But with WMV, the score become (0.4 + 0.45)/(0.4 + 0.45 + 0.5 + 0.55) = 0.447. Here, if the score is no more than 0.5, the sample would be predicted as a negative sample, i.e. not located in promoter. So the output for this sample would be negative. Because the performance of some identifi- ers is much better than others, these better performed identifiers should be weighted more heavily. The recog- nition rate is obtained by evaluating the training dataset using cross-validation. 2.4.3. Simple Majority Voting Plus Identifier Selection (SMV_IS) The 8 investigated algorithms are first ranked by the mRMR method. Identifiers in the topper ranks are re- garded to be less redundant between each other and more relevant to the SST recognition. Next, we need to find out how many identifiers should be chosen from the mRMR ranking list'' ' 01 7 , ,...,Sff f by adding one identifier by other from the list as the candidate identifi- ers, starting from the first identifier' 0 f . Each time when an identifier is added, SMV is applied among the se- lected identifiers. The integrated identifier through SMV, with the highest correct recognition rate evaluated by cross-validation test, is regarded as the optimized identi- fier/predictor of SMV_IS. 2.4.4. Weighted Majority Voting Plus Identifier Selection (WMV_IS) The only difference between SMV_IS and WMV_IS is that, towards the integration of the candidate identifiers, WMV is applied instead of SMV. 2.5 Detection and Prediction Rate If an identifier outputs a predicted promoter instead of an explicit TSS, the prediction is regarded to be correct if the predicted promoter is within the range from 200bp upstream to 100bp downstream of the experimentally determined TSS. The Detected TSS Rate is defined as the number of recognized TSSs divided by the total number of experimentally determined TSSs, and Non-  L. Lei et al. / J. Biomedical Science and Engineering 3 (2010) 719-726 Copyright © 2010 SciRes. JBiSE 722 detected TSS Rate is calculated as 1 minus the detected rate. The Correct Prediction Rate is defined as the num- ber of correctly recognized TSSs divided by the total number of the predicted TSSs, and the False Prediction Rate is calculated as 1 minus the correct prediction rate. The prediction rates we use are defined as follows: Detected TSS Rate the number of recognized TSSs = the total number of experimentally determined TSSs Non-detected TSS Rate = 1 - Detected TSS Rate Correct Prediction Rate the number of correctly recognized TSSs = the total number of the predicted TSSs False Prediction Rate = 1 - Correct Prediction Rate 2.6. Generate Input Matrix for MRMR Algorithm First the prediction results need to be organized in a way that can be input into mRMR. Each residue is predicted by N predictors (N is the number of predictors used), and its true identity is determined by experiment. Thus each residue can be coded by N + 1 digits. The experi- mentally determined TSSs are regarded as the target variable of mRMR while the N predicted TSSs are re- garded as the features of mRMR. The final matrix is a 1-0 matrix of 2100000 × (N + 1) (2100000 = 1400 × 1500), including the true TSS region and N prediction results. Each sequence consists of 1500 nucleotides, and the matrix contains all the 1400 se- quences. The input matrix is shown in Figure 1. The first column: The sites from 200bp upstream to 100bp downstream of the TSS are set to be 1, and others are set to be 2. The other N columns: The predicted TSSs are set to be 1, and others are set to be 0. Then mRMR is applied to filter the features and get the rank. All supplemental materials mentioned above are avail- able upon request. 3. RESULTS 3.1. Training Sets 3.1.1. The Prediction Results of the Eight Predictors The training dataset (1400 sequences) were input into the 8 promoter predictors (refer to Subsection 2.2) and the prediction results were produced. The prediction rates (defined in Subsection 2.5) were calculated to rate the performance of the predictors, which are shown in Table 1. Correct prediction rate is the best standard to evaluate the prediction performance. If two predictors have similar correct prediction rates, the one achieving significantly better detection rate is regarded to perform better. The predictor FPROM is considered to have best prediction performance since it achieves the best correct prediction accuracy, 59.32%, among all the 8 predictors, and at the same time has a reasonable detected rate (64.57%). Cor- rect prediction rates, obtained by the train- ing dataset, are used to weight the corresponding predictors when they are integrated by WMV and WMV_IS. 3.1.2. Voting Method (SMV and WMV) The sequence of 1500 bps is divided into 15 regions, each of which contains 100 bps. Votes are counted on each region, i.e., if a predicted TSS falls on a region, the region gets a vote. The prediction rates of Simple Major- ity Voting are shown in Table 2. For the SMV, though its correct prediction rate is a little lower (1.52%) than that of the best predictor FPROM, the detected rate is much higher (8.14%) than FPROM. For WMV, both its de- tected rate and correct prediction rate are higher than FPROM, indicating that WMV performs better than any individual predictor and also the SMV. 3.1.3. Output of MRMR Program The mRMR program used in this contribution is downloaded from website http://research.janelia.org/peng/ proj/mRMR/. As all of the input vectors are integer vec- tors, we specify the parameter 0t in the mRMR pro- gram to satisfy the integral calculation. Submit the ma- trix, resulted from the promoter identifiers to the mRMR program, (resulted from Subsection 2.6) to get the ranks of the identifiers. The list, provided by mRMR, is shown in Figure 2. Table 1. The performance of 8 promoter predictors. Software Detected Rate Correct Prediction Rate Proscan 35.79% 47.35% TSSG 59.36% 47.35% TSSW 66.21% 49.47% FirstEF 31.29% 55.17% eponine 42.86% 50.81% ProSOM 50.43% 44.17% EP3 29.50% 49.17% FPROM 64.57% 59.32% Table 2. The performance of SMV and WMV. Software-Integration Detected Correct SMV(8 identifiers together) 73.36% 63.01% WMV(8 identifiers together) 68.57% 69.03% 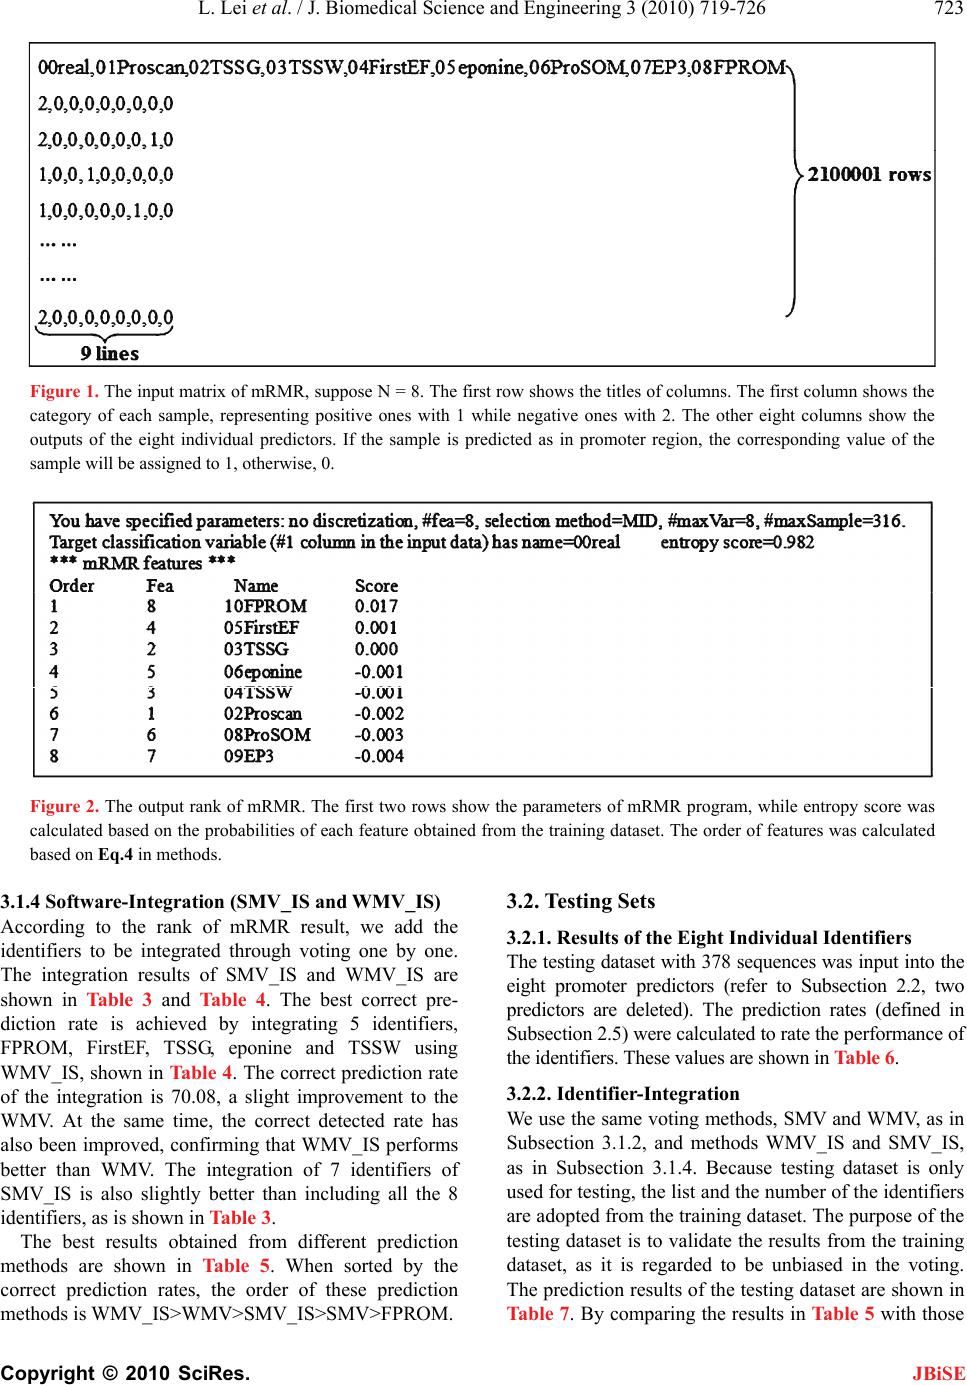 L. Lei et al. / J. Biomedical Science and Engineering 3 (2010) 719-726 Copyright © 2010 SciRes. JBiSE 723 Figure 1. The input matrix of mRMR, suppose N = 8. The first row shows the titles of columns. The first column shows the category of each sample, representing positive ones with 1 while negative ones with 2. The other eight columns show the outputs of the eight individual predictors. If the sample is predicted as in promoter region, the corresponding value of the sample will be assigned to 1, otherwise, 0. Figure 2. The output rank of mRMR. The first two rows show the parameters of mRMR program, while entropy score was calculated based on the probabilities of each feature obtained from the training dataset. The order of features was calculated based on Eq.4 in methods. 3.1.4 Software-Integration (SMV_IS and WMV_IS) According to the rank of mRMR result, we add the identifiers to be integrated through voting one by one. The integration results of SMV_IS and WMV_IS are shown in Table 3 and Table 4. The best correct pre- diction rate is achieved by integrating 5 identifiers, FPROM, FirstEF, TSSG, eponine and TSSW using WMV_IS, shown in Table 4. The correct prediction rate of the integration is 70.08, a slight improvement to the WMV. At the same time, the correct detected rate has also been improved, confirming that WMV_IS performs better than WMV. The integration of 7 identifiers of SMV_IS is also slightly better than including all the 8 identifiers, as is shown in Table 3. The best results obtained from different prediction methods are shown in Table 5. When sorted by the correct prediction rates, the order of these prediction methods is WMV_IS>WMV>SMV_IS>SMV>FPROM. 3.2. Testing Sets 3.2.1. Results of the Eight Individual Identifiers The testing dataset with 378 sequences was input into the eight promoter predictors (refer to Subsection 2.2, two predictors are deleted). The prediction rates (defined in Subsection 2.5) were calculated to rate the performance of the identifiers. These values are shown in Table 6. 3.2.2. Identifier-Integration We use the same voting methods, SMV and WMV, as in Subsection 3.1.2, and methods WMV_IS and SMV_IS, as in Subsection 3.1.4. Because testing dataset is only used for testing, the list and the number of the identifiers are adopted from the training dataset. The purpose of the testing dataset is to validate the results from the training dataset, as it is regarded to be unbiased in the voting. The prediction results of the testing dataset are shown in Table 7. By comparing the results in Table 5 with those 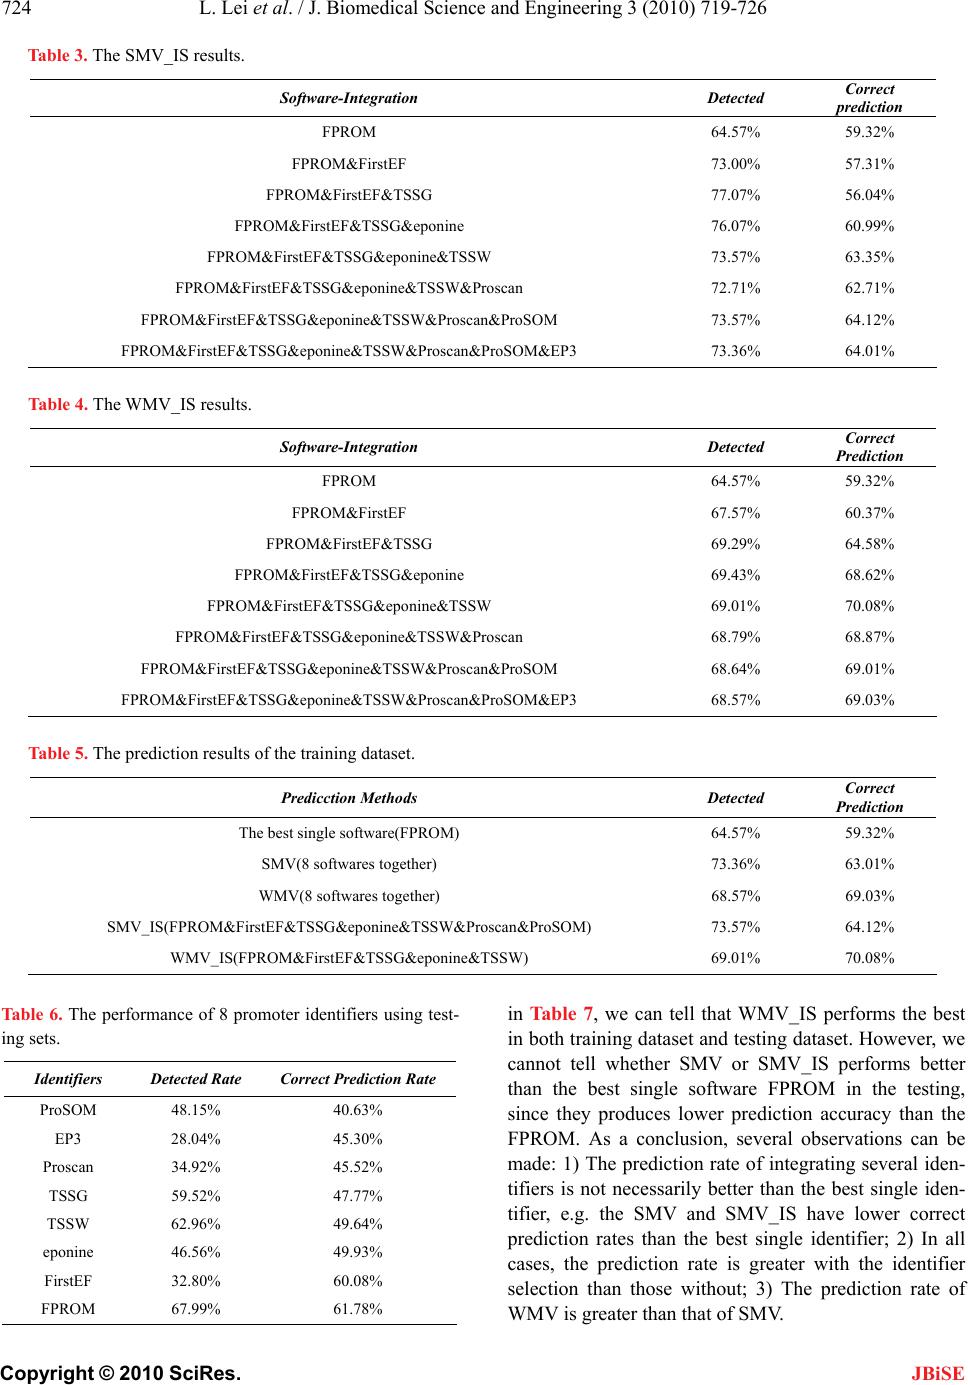 L. Lei et al. / J. Biomedical Science and Engineering 3 (2010) 719-726 Copyright © 2010 SciRes. JBiSE 724 Table 3. The SMV_IS results. Software-Integration Detected Correct prediction FPROM 64.57% 59.32% FPROM&FirstEF 73.00% 57.31% FPROM&FirstEF&TSSG 77.07% 56.04% FPROM&FirstEF&TSSG&eponine 76.07% 60.99% FPROM&FirstEF&TSSG&eponine&TSSW 73.57% 63.35% FPROM&FirstEF&TSSG&eponine&TSSW&Proscan 72.71% 62.71% FPROM&FirstEF&TSSG&eponine&TSSW&Proscan&ProSOM 73.57% 64.12% FPROM&FirstEF&TSSG&eponine&TSSW&Proscan&ProSOM&EP3 73.36% 64.01% Table 4. The WMV_IS results. Software-Integration Detected Correct Prediction FPROM 64.57% 59.32% FPROM&FirstEF 67.57% 60.37% FPROM&FirstEF&TSSG 69.29% 64.58% FPROM&FirstEF&TSSG&eponine 69.43% 68.62% FPROM&FirstEF&TSSG&eponine&TSSW 69.01% 70.08% FPROM&FirstEF&TSSG&eponine&TSSW&Proscan 68.79% 68.87% FPROM&FirstEF&TSSG&eponine&TSSW&Proscan&ProSOM 68.64% 69.01% FPROM&FirstEF&TSSG&eponine&TSSW&Proscan&ProSOM&EP3 68.57% 69.03% Table 5. The prediction results of the training dataset. Predicction Methods Detected Correct Prediction The best single software(FPROM) 64.57% 59.32% SMV(8 softwares together) 73.36% 63.01% WMV(8 softwares together) 68.57% 69.03% SMV_IS(FPROM&FirstEF&TSSG&eponine&TSSW&Proscan&ProSOM) 73.57% 64.12% WMV_IS(FPROM&FirstEF&TSSG&eponine&TSSW) 69.01% 70.08% Table 6. The performance of 8 promoter identifiers using test- ing sets. Identifiers Detected Rate Correct Prediction Rate ProSOM 48.15% 40.63% EP3 28.04% 45.30% Proscan 34.92% 45.52% TSSG 59.52% 47.77% TSSW 62.96% 49.64% eponine 46.56% 49.93% FirstEF 32.80% 60.08% FPROM 67.99% 61.78% in Table 7, we can tell that WMV_IS performs the best in both training dataset and testing dataset. However, we cannot tell whether SMV or SMV_IS performs better than the best single software FPROM in the testing, since they produces lower prediction accuracy than the FPROM. As a conclusion, several observations can be made: 1) The prediction rate of integrating several iden- tifiers is not necessarily better than the best single iden- tifier, e.g. the SMV and SMV_IS have lower correct prediction rates than the best single identifier; 2) In all cases, the prediction rate is greater with the identifier selection than those without; 3) The prediction rate of WMV is greater than that of SMV.  L. Lei et al. / J. Biomedical Science and Engineering 3 (2010) 719-726 Copyright © 2010 SciRes. JBiSE 725 Table 7. The prediction resluts of the testing dataset. Software-Integration Detected Correct The best single software(FPROM) 67.99% 61.78% SMV(8 softwares together) 71.16% 59.33% WMV(8 softwares together) 65.87% 67.30% SMV_IS(FPROM&FirstEF&TSSG&eponine&TSSW &Proscan&ProSOM) 70.10% 62.82% WMV_IS(FPROM&FirstEF&TSSG&eponine&TSSW) 66.67% 67.83% 4. CONCLUSIONS We introduce a voting system to integrate several eu- karyotic promoter identifiers to predict promoters in the human genome. We find that the integration of several identifiers through a simple voting does not necessarily improve the prediction performance. However, after the identifiers are weighted using their prediction accuracies, the prediction performance is improved. Moreover, fil- tering the identifiers is able to improve the prediction accuracy than using all identifiers without a filtering. The order of the identifiers to be added, provided by the mRMR, may not be truly optimized since mRMR makes the list without an attempt to integrate the identifiers, which could potentially be a topic for a future research. 5. ACKNOWLEDGEMENTS This work is supported by National Basic Research Program of China (2004CB518603), grant from Shanghai Commission for Science and Technology (KSCX2-YW-R-112), and the grant supported by Shang- hai Leading Academic Discipline Project (J50101). REFERENCES [1] Abeel, T., Saeys, Y., Bonnet, E., Rouze, P. and Van de Peer, Y. (2008) Generic eukaryotic core promoter predic- tion using structural features of DNA. Genome Research, 18(2), 310-323. [2] Abeel, T., Saeys, Y., Rouze, P. and Van de Peer, Y. (2008) ProSOM: Core promoter prediction based on unsuper- vised clustering of DNA physical profiles. Bioinformat ic s, 24(13), i24-31. [3] Davuluri, R.V., Grosse, I. and Zhang, M.Q. (2001) Com- putational identification of promoters and first exons in the human genome. Nature Genetics, 29(4), 412-417. [4] Down, T.A. and Hubbard, T.J. (2002) Computational detection and location of transcription start sites in ma- mmalian genomic DNA. Genome Research, 12(3), 458- 461. [5] Prestridge, D.S. (1995) Predicting Pol II promoter se- quences using transcription factor binding sites. Journal of Molecular Biology, 249(5), 923-932. [6] Solovyev, V.V. and Shahmuradov, I.A. (2003) PromH: Promoters identification using orthologous genomic se- quences. Nucleic Acid Research, 31(13), 3540-3545. [7] Solovyev, V.V. and Salamov, A. (1997) The Gene-Finder computer tools for analysis of human and model organ- ism genome sequences. The Fifth International Confer- ence on Intelligent Systems for Molecular Biology, 294- 302. [8] Werner, T. (1999) Models for prediction and recognition of eukaryotic promoters. Mamm Genome, 10(2), 168- 175. [9] Altincay, H. and Demirekler, M. (2000) An information theoretic framework for weight estimation in the com- bination of probabilistic classifiers for speaker identifica- tion. Speech Communication, 30(4), 255-272. [10] Liu, R. and States, D.J. (2002) Consensus promoter iden- tification in the human genome utilizing expressed gene markers and gene modeling. Genome Research, 12(3), 462-469. [11] Lam, L. and Suen, C.Y. (1994) A theoretical-analysis of the application of majority voting to pattern-recognition. 12th IAPR International Conference on Pattern Recogni- tion, Jerusalem, Israel, 418-420. [12] Lam, L. and Suen, C.Y. (1997) Application of majority voting to pattern recognition: An analysis of its behavior and performance. IEEE Transactions on Pattern Analysis and Machine Intelligence, 27(5), 553-568. [13] Stajniak, A., Szostakowski, J. and Skoneczny, S. (1997) Mixed neural-traditional classifier for character recogni- tion. SPIE-International Society for Optical Engineering, 2949, 102-110. [14] Huang, Y.S. and Suen, C.Y. (1995) A method of combin- ing multiple experts for the recognition of unconstrained handwritten numerals. IEEE Transactions on Pattern An- alysis and Machine Intelligence, 17(1), 90-94. [15] Lam, L., Huang, Y.S. and Suen, C.Y. (1997) Combination of multiple classifier decisions for optical character rec- ognition. In: Handbook of Character Recognition and Document Image Analysis, Edited by Bunke, H. and Wang, P.S.P., World Scientific Publishing Company, New Jersey, 79-101. [16] Rahman, A.F.R., Alam, H. and Fairhurst, M.C. (2002) Multiple Classifier Combination for Character Recogni- tion: Revisiting the Majority Voting System and Its Variation. In: Lecture Notes in Computer Science, Spri- nger Berlin/Heidelberg, 2423, 319-328. [17] Suen, C.Y., Nadal, C., Mai, T.A., Legault, R. and Lam, L. (1990) Recognition of totally unconstrained handwritten numerals based on the concept of multiple experts. In: International Workshop Frontiers in Handwriting Rec- ognition, Montreal.  L. Lei et al. / J. Biomedical Science and Engineering 3 (2010) 719-726 Copyright © 2010 SciRes. JBiSE 726 [18] Ho, T.K., Hull, J.J. and Srihari, S.N. (1992) Combination of Decisions by Multiple Classifiers. In: Structured Docu- ment Image Analysis, Edited by Baird, H.S., Bunke, H., Yamamoto, K., Springer Verlag New York, Inc., NewJersy, 188-202. [19] Rahman, A.F.R. and Fairhurst, M.C. (1997) Exploiting second order information to design a novel multiple ex- pert decision combination platform for pattern classifica- tion. Electronics Letters, 33(6), 476-477. [20] Rohlfing, T., Russakoff, D.B. and Maurer, C.R. (2004) Performance-Based Classifier Combination in Atlas- Based Image Segmentation Using Expectation-Maxi- mization Parameter Estimation. IEEE Transactions on Medical Imaging, 23(8), 983-994. [21] Paik, J., Jung, S. and Lee, Y. (1993) Multiple combined recognition system for automatic processing of credit card slip applications. In: The Second International Con- ference on Document Analysis and Recognition, IEEE Computer Society Press, Washington, 520-523. [22] Won, H.H., Kim, M.J., Kim, S. and Kim, J.W. (2008) EnsemPro: an ensemble approach to predicting transcrip- tion start sites in human genomic DNA sequences. Ge- nomics, 91(3), 259-266. [23] Peng, H., Long, F. and Ding, C. (2005) Feature selection based on mutual information: criteria of max-dependency, max-relevance, and min-redundancy. IEEE Transactions on Pattern Analysis and Machine Intelligence, 27(8), 1226-1238. [24] Bucher, P., Périer, R.C., Praz, V. and Schmid, C. (2006) The eukaryotic promoter database user manual. Nucleic Acid Research, 34, D82-85. |