Paper Menu >>
Journal Menu >>
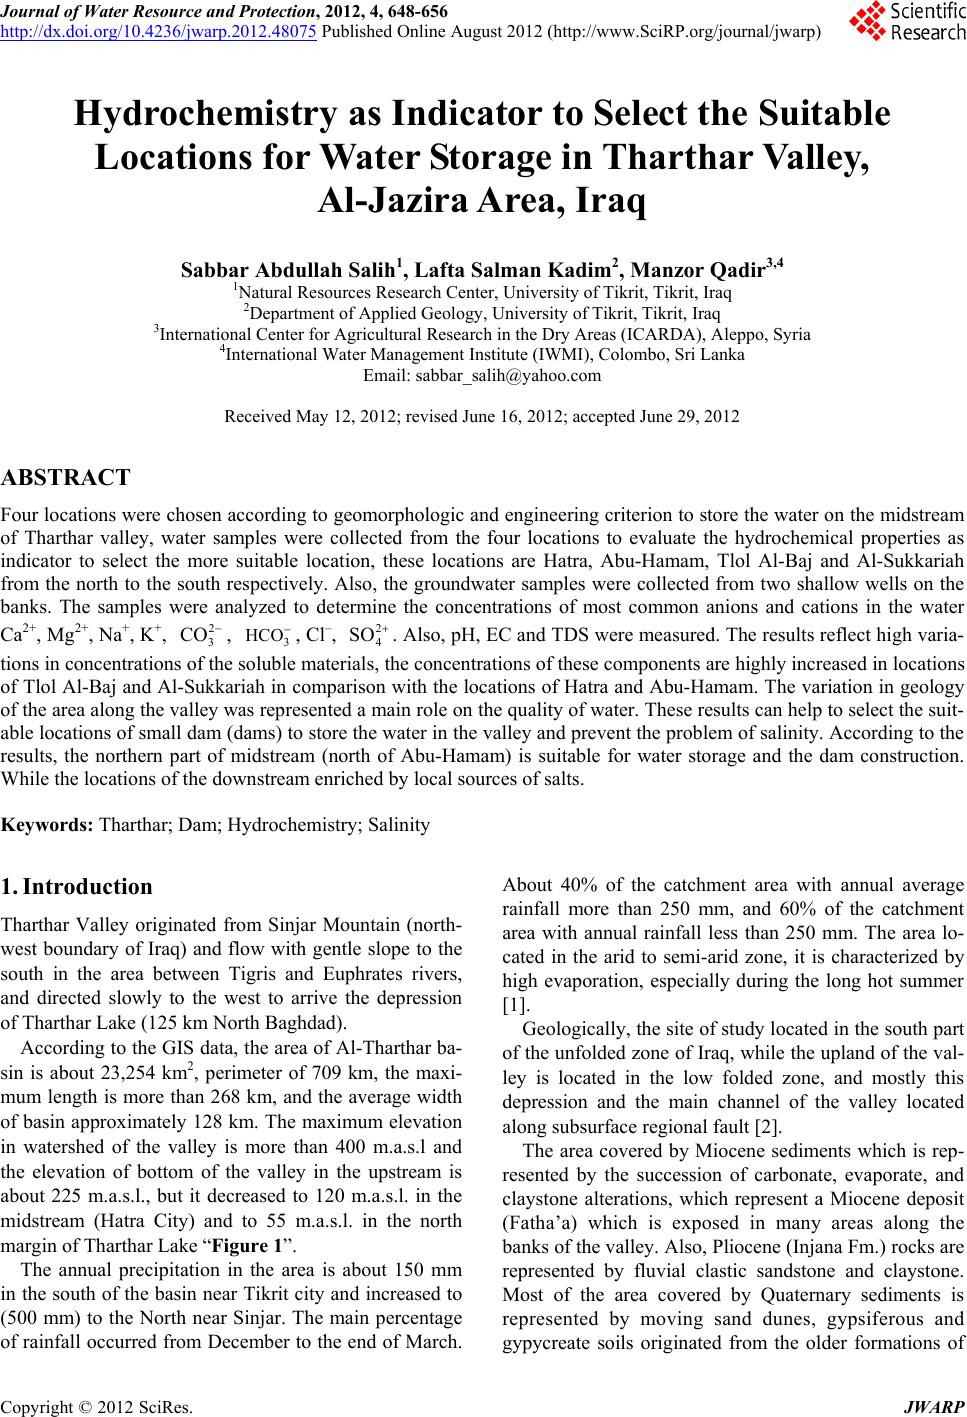 Journal of Water Resource and Protection, 2012, 4, 648-656 http://dx.doi.org/10.4236/jwarp.2012.48075 Published Online August 2012 (http://www.SciRP.org/journal/jwarp) Hydrochemistry as Indicator to Select the Suitable Locations for Water Storage in Tharthar Valley, Al-Jazira Area, Iraq Sabbar Abdullah Salih1, Lafta Salman Kadim2, Manzor Qadir3,4 1Natural Resources Research Center, University of Tikrit, Tikrit, Iraq 2Department of Applied Geology, University of Tikrit, Tikrit, Iraq 3International Center for Agricultural Research in the Dry Areas (ICARDA), Aleppo, Syria 4International Water Management Institute (IWMI), Colombo, Sri Lanka Email: sabbar_salih@yahoo.com Received May 12, 2012; revised June 16, 2012; accepted June 29, 2012 ABSTRACT Four locations were chosen according to geomorphologic and engineering criterion to store the water on the midstream of Tharthar valley, water samples were collected from the four locations to evaluate the hydrochemical properties as indicator to select the more suitable location, these locations are Hatra, Abu-Hamam, Tlol Al-Baj and Al-Sukkariah from the north to the south respectively. Also, the groundwater samples were collected from two shallow wells on the banks. The samples were analyzed to determine the concentrations of most common anions and cations in the water Ca2+, Mg2+, Na+, K+, , , Cl–, 2 3 CO 3 HCO2 4 SO . Also, pH, EC and TDS were measured. The results reflect high varia- tions in concentrations of the soluble materials, the concentrations of these components are highly increased in locations of Tlol Al-Baj and Al-Sukkariah in comparison with the locations of Hatra and Abu-Hamam. The variation in geology of the area along the valley was represented a main role on the quality of water. These results can help to select the suit- able locations of small dam (dams) to store the water in the valley and prevent the problem of salinity. According to the results, the northern part of midstream (north of Abu-Hamam) is suitable for water storage and the dam construction. While the locations of the downstream enriched by local sources of salts. Keywords: Tharthar; Dam; Hydrochemistry; Salinity 1. Introduction Tharthar Valley originated from Sinjar Mountain (north- west boundary of Iraq) and flow with gentle slope to the south in the area between Tigris and Euphrates rivers, and directed slowly to the west to arrive the depression of Tharthar Lake (125 km North Baghdad). According to the GIS data, the area of Al-Tharthar ba- sin is about 23,254 km2, perimeter of 709 km, the maxi- mum length is more than 268 km, and the average width of basin approximately 128 km. The maximum elevation in watershed of the valley is more than 400 m.a.s.l and the elevation of bottom of the valley in the upstream is about 225 m.a.s.l., but it decreased to 120 m.a.s.l. in the midstream (Hatra City) and to 55 m.a.s.l. in the north margin of Tharthar Lake “Figure 1”. The annual precipitation in the area is about 150 mm in the south of the basin near Tikrit city and increased to (500 mm) to the North near Sinjar. The main percentage of rainfall occurred from December to the end of March. About 40% of the catchment area with annual average rainfall more than 250 mm, and 60% of the catchment area with annual rainfall less than 250 mm. The area lo- cated in the arid to semi-arid zone, it is characterized by high evaporation, especially during the long hot summer [1]. Geologically, the site of study located in the south part of the unfolded zone of Iraq, while the upland of the val- ley is located in the low folded zone, and mostly this depression and the main channel of the valley located along subsurface regional fault [2]. The area covered by Miocene sediments which is rep- resented by the succession of carbonate, evaporate, and claystone alterations, which represent a Miocene deposit (Fatha’a) which is exposed in many areas along the banks of the valley. Also, Pliocene (Injana Fm.) rocks are represented by fluvial clastic sandstone and claystone. Most of the area covered by Quaternary sediments is represented by moving sand dunes, gypsiferous and gypycreate soils originated from the older formations of C opyright © 2012 SciRes. JWARP  S. A. SALIH ET AL. 649 Figure 1. Location map and sampling stations on Tharthar Valley. Miocene and Pliocene [2]. [3], studied the hydoengineering properties of the ba- sin to the north of Hatra City using the satellite images and aerial photos, the study determined five geomor- phological zones in the area, and drew the map of land use. And he suggested three locations to construct dams on the valley. [4], investigated the Climatological, hydrogeological and geomorphological properties of six sub-basins in the northern part of the Tharthar Valley, and predicted the discharge of the valleys in the area. This project aims to evaluate the surface and ground- water quality and the specific characteristics of water within Tharthar valley, and the hydromorphometric aspects. Also to interpret the groundwater relationship with surface water, and discuss the variation of salinity, ionic concentrations and determination of hypothetical salts and saturation indices of these salts within the studied area along the valley. The results are the main factors in determination of local dams and reservoirs on the studied sites. 2. Materials and Methods The studied area locates between UTM coordinates 190,000, 340,000 eas, 3,800,000, 4,050,000 north “Fig- ure 1”. Four locations have been selected for sampling of sur- face water and two shallow wells for groundwater, “Fig- ure 2”. The laboratory procedures were carried out ac- cording to the procedures of (ASTM, 1984) in [5]. The analyses of the most common cations Ca2+, Mg2+, Na+, K+, anions 3 2 CO , 3, Cl–, 4, and another parameters pH, EC and TDS were carried out in the laboratories of ICARDA. HCO2 SO 2 SO pH and EC values are determined directly by pH-EC meter for water samples. The concentrations of soluble sodium and potassium in water were determined by using the flame photometer, while the soluble calcium and magnesium were determined by titration with EDTA. The soluble chloride was determined by titration with silver nitrate AgNO3, soluble carbonate and bicarbonate were determined by titration with H2SO4 (for pH 8.3 - 4.5), soluble sulfate determined by precipitation method with barium chloride (ASTM, 1984) in [5]. 3. Results and Discussions Water system contains salts, kinds and concentrations of the salts depend on the interaction between the water chemistry and the rocks or soil of the stream channels or groundwater aquifers. The degree of dissolution and pre- cipitation of soil or rocks materials is controlled by ground or surface water movement and system condi- tions [6]. The human activities may affect the concentra- tions of materials in the water; such as irrigation, fertili- zation, contribution of wastewater and urban uses [7]. 3.1. The Results The results of water chemistry are indicated on “Table 1”. The relative errors of analyses were calculated by the formula of charge balance [8]. The samples analyses are acceptable according to this formula which assumes the relative error less than 5%. 3.2. The Discussion 3.2.1. Varia tio n of Hydrochemical Parameters From the results of the concentrations of the soluble ions “Figure 2”, reveal the similarity in the concentrations of all ions in the first and second stations, and 4 is the most abundance ion in these stations, the source of this ion mainly is the gypsum and gypcrete in the rocks and soil in the area, also these concentrations of ions are similar in the groundwater of shallow aquifer near the banks of valley in Abo-Hamam and Al-Ib areas that re- veal the similarity of host rocks and soil. In the direction of flow to the south, the concentrations of ions are in- creased suddenly in the area of Tlol-AlBaj, especially Na+ and Cl– concentrations, the sudden increasing is re- lated to a local source of these ions, the concentrations of Copyright © 2012 SciRes. JWARP 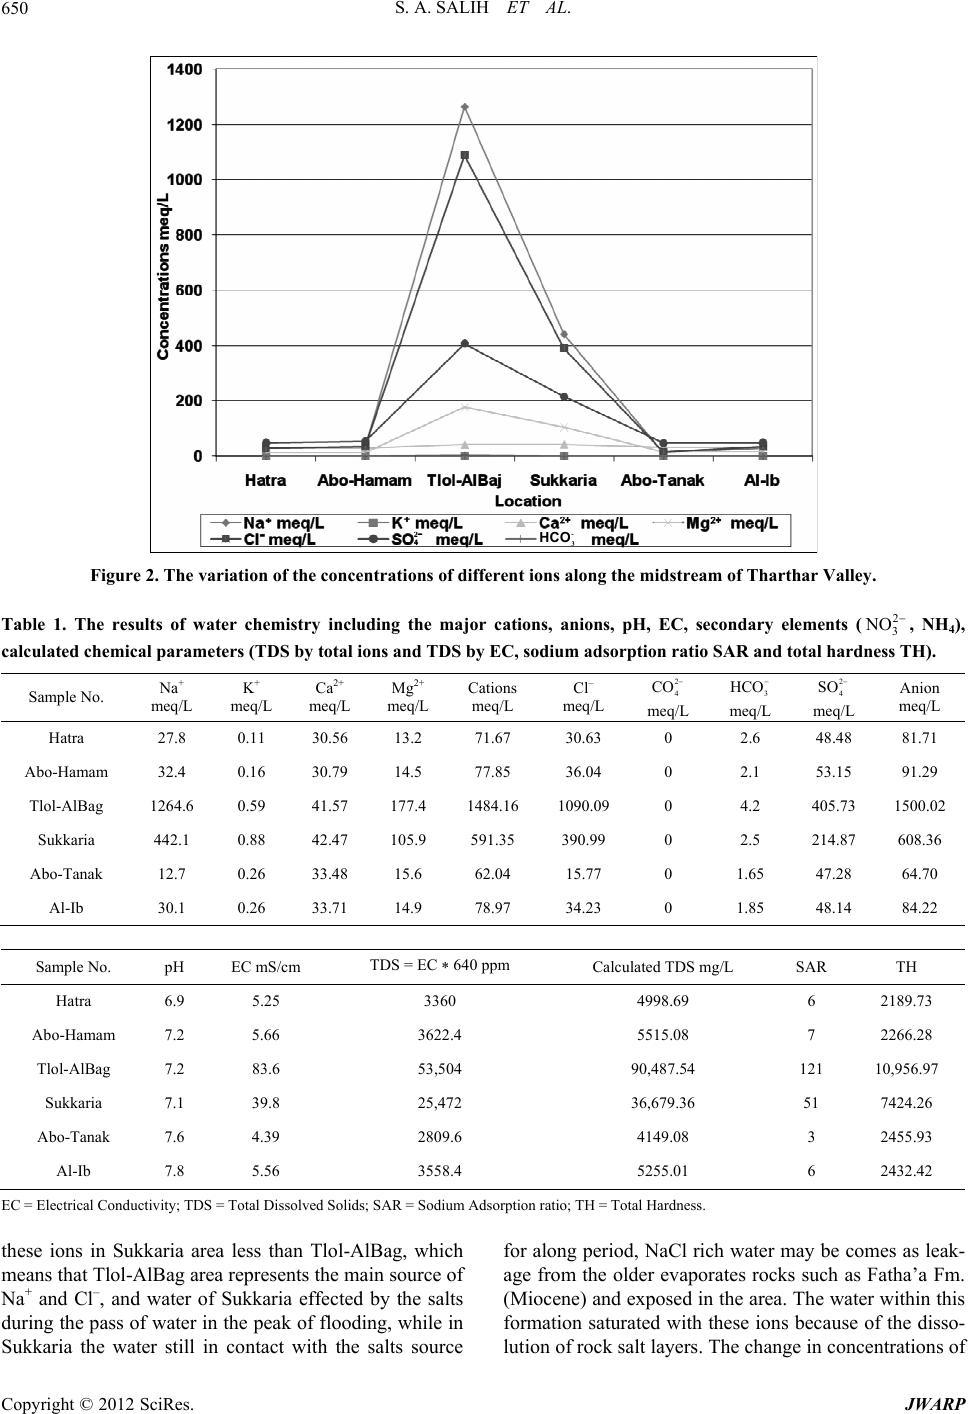 S. A. SALIH ET AL. Copyright © 2012 SciRes. JWARP 650 - 3 HCO Figure 2. The variation of the concentrations of different ions along the midstream of Tharthar Valley. 2 3 NOTable 1. The results of water chemistry including the major cations, anions, pH, EC, secondary elements ( , NH4), calculated chemical parameters (TDS by total ions and TDS by EC, sodium adsorption ratio SAR and total hardness TH). 2 4 CO meq/L Sample No. Na+ meq/L K+ meq/L Ca2+ meq/L Mg2+ meq/L Cations meq/L Cl– meq/L 3 HCO2 4 SO meq/L meq/L Anion meq/L Hatra 27.8 0.11 30.56 13.2 71.67 30.63 0 2.6 48.48 81.71 Abo-Hamam 32.4 0.16 30.79 14.5 77.85 36.04 0 2.1 53.15 91.29 Tlol-AlBag 1264.6 0.59 41.57 177.4 1484.16 1090.09 0 4.2 405.73 1500.02 Sukkaria 442.1 0.88 42.47 105.9 591.35 390.99 0 2.5 214.87 608.36 Abo-Tanak 12.7 0.26 33.48 15.6 62.04 15.77 0 1.65 47.28 64.70 Al-Ib 30.1 0.26 33.71 14.9 78.97 34.23 0 1.85 48.14 84.22 Sample No. pH EC mS/cm TDS = EC * 640 ppm Calculated TDS mg/L SAR TH Hatra 6.9 5.25 3360 4998.69 6 2189.73 Abo-Hamam 7.2 5.66 3622.4 5515.08 7 2266.28 Tlol-AlBag 7.2 83.6 53,504 90,487.54 121 10,956.97 Sukkaria 7.1 39.8 25,472 36,679.36 51 7424.26 Abo-Tanak 7.6 4.39 2809.6 4149.08 3 2455.93 Al-Ib 7.8 5.56 3558.4 5255.01 6 2432.42 EC = Electrical Conductivity; TDS = Total Dissolved Solids; SAR = Sodium Adsorption ratio; TH = Total Hardness. these ions in Sukkaria area less than Tlol-AlBag, which means that Tlol-AlBag area represents the main source of Na+ and Cl–, and water of Sukkaria effected by the salts during the pass of water in the peak of flooding, while in Sukkaria the water still in contact with the salts source for along period, NaCl rich water may be comes as leak- age from the older evaporates rocks such as Fatha’a Fm. (Miocene) and exposed in the area. The water within this formation saturated with these ions because of the disso- lution of rock salt layers. The change in concentrations of 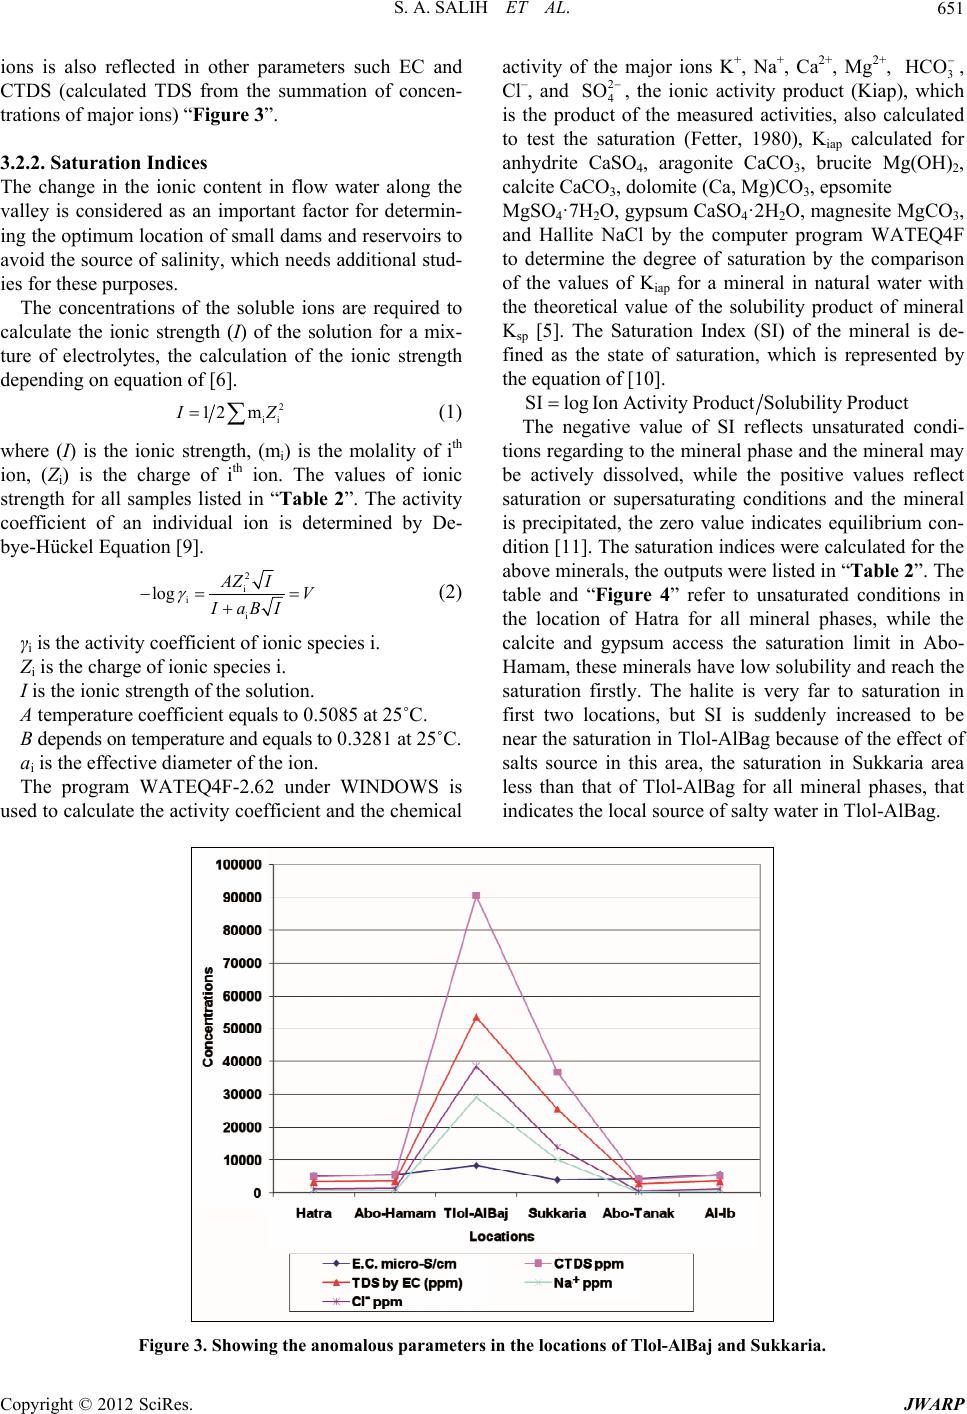 S. A. SALIH ET AL. 651 ions is also reflected in other parameters such EC and CTDS (calculated TDS from the summation of concen- trations of major ions) “Figure 3”. 3.2.2. Saturation Indices The change in the ionic content in flow water along the valley is considered as an important factor for determin- ing the optimum location of small dams and reservoirs to avoid the source of salinity, which needs additional stud- ies for these purposes. The concentrations of the soluble ions are required to calculate the ionic strength (I) of the solution for a mix- ture of electrolytes, the calculation of the ionic strength depending on equation of [6]. 2 ii 12 mIZ (1) where (I) is the ionic strength, (mi) is the molality of ith ion, (Zi) is the charge of ith ion. The values of ionic strength for all samples listed in “Table 2”. The activity coefficient of an individual ion is determined by De- bye-Hückel Equation [9]. 2 i i AZ IV IaBI HCO i log (2) γi is the activity coefficient of ionic species i. Zi is the charge of ionic species i. I is the ionic strength of the solution. A temperature coefficient equals to 0.5085 at 25˚C. B depends on temperature and equals to 0.3281 at 25˚C. ai is the effective diameter of the ion. The program WATEQ4F-2.62 under WINDOWS is used to calculate the activity coefficient and the chemical activity of the major ions K+, Na+, Ca2+, Mg2+, 3 , Cl–, and 4 2 SO , the ionic activity product (Kiap), which is the product of the measured activities, also calculated to test the saturation (Fetter, 1980), Kiap calculated for anhydrite CaSO4, aragonite CaCO3, brucite Mg(OH)2, calcite CaCO3, dolomite (Ca, Mg)CO3, epsomite MgSO4·7H2O, gypsum CaSO4·2H2O, magnesite MgCO3, and Hallite NaCl by the computer program WATEQ4F to determine the degree of saturation by the comparison of the values of Kiap for a mineral in natural water with the theoretical value of the solubility product of mineral Ksp [5]. The Saturation Index (SI) of the mineral is de- fined as the state of saturation, which is represented by the equation of [10]. SIlogIon ActivityProductSolubilityProduct The negative value of SI reflects unsaturated condi- tions regarding to the mineral phase and the mineral may be actively dissolved, while the positive values reflect saturation or supersaturating conditions and the mineral is precipitated, the zero value indicates equilibrium con- dition [11]. The saturation indices were calculated for the above minerals, the outputs were listed in “Tab l e 2 ”. The table and “Figure 4” refer to unsaturated conditions in the location of Hatra for all mineral phases, while the calcite and gypsum access the saturation limit in Abo- Hamam, these minerals have low solubility and reach the saturation firstly. The halite is very far to saturation in first two locations, but SI is suddenly increased to be near the saturation in Tlol-AlBag because of the effect of salts source in this area, the saturation in Sukkaria area less than that of Tlol-AlBag for all mineral phases, that indicates the local source of salty water in Tlol-AlBag. Figure 3. Showing the anomalous parameters in the locations of Tlol-AlBaj and Sukkaria. Copyright © 2012 SciRes. JWARP  S. A. SALIH ET AL. 652 Table 2. Ionic Index and Saturation Index of mineral phases, reflect the saturation of surface and groundwater concerning to different mineral phases. Ionic Strength Saturation Index of Mineral Phases Sample No. Total EffectiveAnhydrite AragoniteBruciteCalciteDolomiteEpsomiteGypsum Halite Magnesite Hatra 0.12351 0.09167–0.234 –0.199 –5.805–0.055–0.908 –2.838 –0.015 –4.877 –0.884 Abo-Hamam 0.13465 0.10044–0.217 –0.010 –5.1810.134–0.493 –2.784 0.001 –4.748 –0.658 Tlol-AlBag 1.98417 1.648170.091 0.121 –4.1900.2640.783 –1.605 0.268 –1.742 0.488 Sukkaria 0.81136 0.64943–0.023 –0.178 –4.672–0.035–0.078 –1.885 0.182 –2.688 –0.074 Abo-Tanak 0.11248 0.07728–0.187 0.351 –4.3160.4950.224 –2.758 0.032 –5.494 –0.302 Al-Ib 0.13113 0.09752–0.213 0.574 –3.9470.7180.650 –2.805 0.005 –4.798 –0.099 Figure 4. Saturation Index of mineral phase s, reflect the saturation conditions of surfac e and groundwater regar ding to min- eral phases. The SI for the groundwater samples in Abo-Tanak and Al-Ib near the banks of the valley similar to the behavior of the first two locations of surface water in the valley, which indicates the similar conditions of host rocks and soil. 3.2.3. Hypoth eti c al Sal ts The average of common hypothetical salts combination was calculated, NaCl and CaSO4 are the main two com- mon soluble salts “Table 3”. “Figure 5” shows the be- havior of hypothetical salts combination along the stream of valley and the groundwater, the salt combinations seem similar in the locations of Hatra, Abo-Hamam and in the ground water well of Al-Ib, and show different percentages in Tlol-AlBag and Sukkaria. The percentage of NaCl is increased suddenly in Tlol-AlBag to reach more than 70%, while CaSO4 is decreased because it became out of the solution, and the gypsum reach to satu- ration limits. The decrease of NaCl in Sukkaria in com- parison with Hatra indicates that the local source of NaCl, the CaSO4 is increased suddenly in the groundwater of Abo-Tanak because it is from the Karistified aquifer. 4. Usability of Tharthar Water for Irrigatio n The pH of the samples is ranged between 6.9 and 7.8 “Ta- ble 1”, that means all samples in the tolerable range of 6.5 - 8.4 which is suggested by [12], “Table 4”, for irri- gation. The electrical conductivity (EC) (mS/cm) of the water is a useful tool to evaluate the usability of water for irriga- tion [13]. The limits of EC shown in “Table 4”, the val- ues of EC in the present work more than 3 mS/cm in all Copyright © 2012 SciRes. JWARP  S. A. SALIH ET AL. 653 Table 3. Average of hypothetical salt combination epm%, of surface water in Tharthar Valley and groundwater of shallow aquifer on the banks. Sample No. Ca(HCO3)2 CaSO4 MgSO4 Na2SO4 MgCl2 NaCl KCl Hatra 3.18 39.46 18.42 1.45 0 37.34 0.15 Abo-Hamam 2.30 37.25 18.63 2.34 0 39.28 0.21 Tlol-AlBag 0.28 2.52 11.95 12.58 0 72.63 0.04 Sukkaria 0.41 6.77 17.91 10.64 0 64.12 0.15 Abo-Tanak 2.55 51.42 21.66 0 3.49 20.47 0.42 Al-Ib 2.20 40.49 16.67 0 2.2 38.12 0.33 Figure 5. Average of hypothetical salt combination epm%, of surface water in Tharthar Valley and groundwater of shallow aquifer on the banks. the studied locations “Table 1”, and the water of the lo- cations of Hatra and Abo-Hamam and groundwater are permissible for irrigation with modern irrigation systems such as drip and sprinkler, while the water in the loca- tions of Tlol-AlBag and Sukkaria not permissible for irrigation. The total dissolved solids (TDS) in water are repre- sented by the weight of residue left when a water sample has been evaporated to dryness. It is measured by deter- mining the actual salt content in parts per million (ppm) or (mg/L). A physiological drought condition can result from excess salts accumulating in the soil by increasing the osmotic pressure of the soil solution. Plants can wilt due to insufficient water absorption by the roots com- pared to the amount lost from transpiration, even though the soil may have plenty of moisture. (TDS = EC × 640). The ISI standard for dissolved solid is up to 500 mg/L and the maximum permissible quantity is 2000 mg/L “Table 4”, [12,14,15]. The values of TDS which calcu- lated by the summation of major soluble ions, or calcu- lated by EC in the present work more than 2000, “Table 1”, and that may due to the collection of sample during the draught seasons. The calcium (Ca2+) is generally found in all natural waters. When adequately supplied with exchangeable calcium, soils are friable and usually allow water to drain easily. This is why calcium in the form of gypsum is commonly applied to improve the physical properties of tight soils. Sodium will be leached from the root zone when the Ca2+ replaces the Na+ on the soil colloid. Irriga- tion water that contains ample calcium is most desirable, the concentrations of Ca2+ “Table 1” are more than the desired range 40 - 120 mg/l in all the studied samples. The magnesium (Mg2+) is also found in most natural Copyright © 2012 SciRes. JWARP  S. A. SALIH ET AL. 654 Table 4. Guidelines for irrigation water quality established by (FAO). Intensity of Problem1 Water Constituent No Problem Moderate Severe Salinity EC (decisiemens meter−1) <0.7 0.7 - 3.0 >3.0 Salinity TDS mg/L or ppm <450 450-2000 >2000 Permeability (rate of infiltration affected) Salinity (decisiemens meter−1) >0.5 0.5 - 0.2 <0.2 Adjusted SAR; soils are: Dominantly montmorillonite, smectites <6 6 - 9 >9 Do minantly illite-vermiculite <8 8 - 16 >16 Dominantly ka olinite-sesquioxides <16 16 - 24 >24 Specific Ion Toxicity Sodium (as adjusted SAR) (sprinkler) <3 3 - 9 >9 Chloride (mmol/L) (sprinkler) <3 >3 >10 Boron (mmol/L) as B <0.70 0.70 - 30 >3.0 HCO (mmol/L) as damage by overhead sprinkler 3 <1.5 >8.5 pH 6.5 - 8.4 1.5 - 8.5 0 - 5, 9.5+ Source: modified from R. S. Ayers and D. W. Westcott, “water quality for agriculture”, irrigation and drainage paper, 29, FAO, Rome, 1976; rev. 1986. 1Based on the assumptions that the soils are sandy loam to clay loams, have good drainage, are in arid to semiarid climates, that irrigation is sprinkler or surface, that root depths are normal for soil, and that the guidelines are only approximate; 2Assumes molecular weight = mole weight (one charge) because it is slightly ionized or nonionzed. waters. Together with calcium, Mg may be used to estab- lish the relationship to total salinity and to estimate the sodium hazard. The concentrations of Mg2+ “Table 1” are more than the desired range 6 - 24 mg/l in all the studied samples. Ca2+ and Mg2+ are caused by far the greatest portion of the hardness occurring in natural waters. All the metallic cations beside the alkali metals caused hardness. Hard- ness of the water is objectionable from viewpoint of wa- ter use. The sum of calcium and magnesium compounds re- sults in the total hardness are measured in milligram cal- cium carbonate per liter. In order to determine the total hardness, the weight percentage of the magnesium com- pound is converted into the equivalent CaCO3. Total Hardness = 2.497 * Ca2+ mg/l + 4.115 * Mg2+ mg/l [16]. The TH of all the studied samples “Table 1” are high- est than the permissible limit which is 6.0 meq/L (300 mg/L) that prescribe by (ICMR 1975) in [15]. The sodium (Na+) is often found in natural waters due to its high solubility. When it linked to chloride (Cl–) and sulfide 4, sodium is often associated with salinity problems. High concentrations in the soil can adversely affect turf grasses. Poor soil physical properties for plant growth will result as a consequence of continued use of water with high sodium levels. The concentrations of Na+ more than the permissible limit of 50 ppm (9 meq/L) in irrigation water prescribed by BIS (1983) in [13]. And that may due to collection of samples during the dry con- dition. SAR sodium adsorption ratio is an important parame- ter for determination of suitability of irrigation water. This index quantifies the proportion of sodium (Na+) to calcium (Ca2+) and magnesium (Mg2+) ions [15]. The SAR is also an index of sodium permeability haz- ard as water moves through the soil. The main problem with a high sodium concentration is its effects on the physical properties of soil. This breakdown disperses the soil clay and causes the soil to become hard and compact when dry and reduces the rate of water penetration when wet. A breakdown in the physical structure of the soil can occur with continued use of water with a high SAR value. The effects of high SAR on the infiltration of irrigation water are dependent on the EC of the water. The permis- sible limit of SAR < 6 no problem, 6 - 9 moderate and >9 severe [12], while [17] classified irrigation water with SAR values less than 10 as (excellent). The sodium ad- sorption ratio (SAR) values of water samples were cal- culated by using Richard equation [12]: 2 SO Copyright © 2012 SciRes. JWARP  S. A. SALIH ET AL. 655 SAR=(Na+ meq/l)/√ [(Ca2+ meq/l)+(Mg2+ meq/l)/2] (3) The calculated values of SAR in the study area “Table 1” are in the desired limit for irrigation purposes, except the locations of Tlol-AlBag and Sukkaria, and that may due to local source of NaCl in these areas. Water alkalinity, simply stated, is a measure of the water’s capability to neutralize added acids. Related to pH, alkalinity establishes the buffering capacity of water. The major chemicals that contribute to the alkalinity of water include dissolved carbonates, bicarbonates and hydroxides. High alkalinity can cause an increase in the pH of the soil (reducing micronutrient availability), the precipitation of nutrients in concentrated fertilizer solu- tions, and reduce the efficacy of pesticides and growth regulators. The desired range is 1 - 100 ppm. An alkalizing effect of carbonates 3 results when combined with calcium and/or magnesium. This effect is much stronger when it occurs in the presence of the sodium cation, the permissible range <50 ppm. The concentrations of 3 are nil in the samples “Table 1” and within the accepted range for Irrigation. 2 CO 2 CO HCO HCO 2 SO 2 4 SO 2 SO Bicarbonates 3 are also salts of carbonic acid and are common in natural waters. As soil moisture is reduced, calcium and magnesium bicarbonates can sepa- rate calcium from the clay colloid, leaving sodium to take its place. An increase of SAR in the soil solution will result. The overuse of high bicarbonate irrigation water can contribute to a soil dominant in sodium, with a resulting reduction in water infiltration rates and soil gas exchange. The permissible range is <120 mg/L, [13]. The concentrations of 3 “Table 1” are within the desirable limit in the surface water and groundwater. Chloride is an anion that is commonly found in irriga- tion water. Chlorides contribute to the total salt (salinity) content of soils, Chloride salts in excess of 100 mg/1 give salty taste to water, Unusual Concentration may in- dicate pollution by organic waste [15]. It is necessary for plant growth in small amounts, while high concentrations will inhibit plant growth or be toxic to some plants. Irri- gation water high in chloride reduces phosphorus avail- ability to plants, high chloride content in ground-water can be attribute to lack of under ground drainage system and bad maintenance of environment around the sources, the permissible limit is 10.0 meq/L (355 mg/L) [13]. The concentrations of Cl– “Table 1” are more than the desirable limit in the surface water, and within the per- missible limit in the groundwater in the area. Sulfate 4 is relatively common in water and has no major impact on the soil other than contributing to the total salt content. Irrigation water high in sulfate ions reduces phosphorus availability to plants. The desired range is <400 ppm, and >400 ppm will acidify the soil depending on the standard limits of BIS, 1999 in [15]. The concentrations of are more the desired limit in all the studied water samples. 5. Conclusions According the hydrochemical properties the studied samples can conclude that: 1) regarding to the concentration of major ions the surface and groundwater rich in Na+, Mg2+, Cl–, and 4 , and the percent of Na+ and Cl– increased in the locations of Tlol-AlBag and Sukkaria. 2) The SI increased suddenly in these two locations especially in Tlol-AlBag. 3) NaCl, CaSO4, and MgSO4 are the major hypo- theticcal salts combination in the water of the valley and groundwater of shallow aquifer, and the percentage of NaCl increased suddenly in Tlol-AlBag to reach more than 70%, while in Sukkaria less than Tlol-AlBag. 4) The indicators above reveal to local source of salts because the upward leakage of saline water from the deep salt rich formations, especially Fatha’a Fm. The leakage may be a result of structural reasons. 5) These two locations are not reliable for water stor- age, while the others are reliable. 6) According to EC and SAR, the surface water in the locations of Hatra and Abo-Hamam and the groundwater of shallow aquifer are usable for irrigation with modern irrigation system for the salt resistance plants, while the water of Tlol-AlBag and Sukkaria are not reliable. The evaluation of hydrochemistry is very important in the selection of water storage projects. REFERENCES [1] M. F. Fathallah, “Hydrological Study for Tharthar River Basin, and the Possibility of Use Its Water for the Con- struction of Al-Jazeera Area,” Journal of Iraqi Geological Society, Vol. 10, 1977, pp. 1-12. (in Arabic) [2] S. Z. Jassim and J. C. Goff, “Geology of Iraq,” Dolin, Prague and Moravian Museum, Brno, 2006. [3] M. F. M. Al-Moula, “Morphometric Study for Specifying Location of Dam in Wadi Al-Tharthar Basin North of Hatra Using Remote Sensing Techniques,” M.Sc. Thesis, University of Mosul, Mosul, 2002. [4] M. F. Khattab, “Hydrogeomorphological and Quantity Study for Tharthar Valley, Northwest Iraq,” Rafidain Jour- nal for Science, Vol. 16, No. 2, 2005, pp. 50-61. [5] I. J. Fairchild, L. Bradby, M. Sharp and J. L. Tison, “Hy- drochemistry of Carbonate Terrains in Alpine Glacial Settings,” Earth Surface Processes Landforms, Vol. 19, No. 1, 1994, pp. 33-54. doi:10.1002/esp.3290190104 [6] C. W. Fetter, “Applied Hydrogeology,” Charles E. Merrill Publishing Company, Amherst, 1980. [7] D. J. Tedaldi and R. C. Loechr, “Effect of Waste-Water Irrigation on Aqueous Geochemistry Near Paris, Texas,” Ground Water, Vol. 30, No. 5, 1992, pp. 709-719. [8] M. Mazor, “Applied Chemical and Isotopic Ground Wa- Copyright © 2012 SciRes. JWARP  S. A. SALIH ET AL. Copyright © 2012 SciRes. JWARP 656 ter Hydrology,” Open University Press, New York, 1990. [9] U. M. P. Amadi and N. R. Shaffer, “Low Sulfate Ground Water and Its Relationship to the Gypsum-Fluorite Re- placement in Mississippian Carbonates, Harrison County, Indiana, USA,” International Association of Hydrological Science, No. 161, 1985, pp. 449-466. [10] C. G. Groves, “Geochemical and Kinetic Evolution of a Karst Flow System: Laurel Creek, West Virginia,” Ground Water, Vol. 30, No. 2, 1992, pp. 186-191. doi:10.1111/j.1745-6584.1992.tb01790.x [11] P. Marinos, J. S. Hernman, W. Back and G. Xidakis, “Structural Control and Geomorphic Significance of Groundwater Discharge along the Coast of the Mani Peninsula, Peleponnese, Greece,” Karst Water Resources, No. 161, 1985, pp. 481-495. [12] R. S. Ayers and D. W. Westcot, “Water Quality for Ag- riculture,” Food and Agriculture Organization (FAO) of the United Nations, Rome, 1985. [13] G. D. Acharya, M. V. Hathi, A. D. Patel and K. C. Par- mar, “Chemical Properties of Groundwater in Bhiloda Taluka Region, North Gujarat, India,” E-Journal of Chemistry, Vol. 5, No. 4, 2008, pp. 792-796. doi:10.1155/2008/592827 [14] WHO, “International Standards for Drinking Water,” WHO, Geneva, 1994. [15] R. K. Tatawat and C. P. S. Chandel, “Quality of Ground Water of Jaipur City, Rajasthan (India) and Its Suitability for Domestic and Irrigation Purpose,” Journal of Applied Ecology and Environmental Research, Vol. 6, No. 2, 2008, pp. 79-88. [16] G. Faure, “Principles and Applications of Geochemistry,” 2nd Edition, Prentice Hall Inc., Upper Saddle River, 1998. [17] D. K. Todd, “Ground Water Hydrology,” 2nd Edition, John Wiley & Sons, Inc., New York, 1980. |