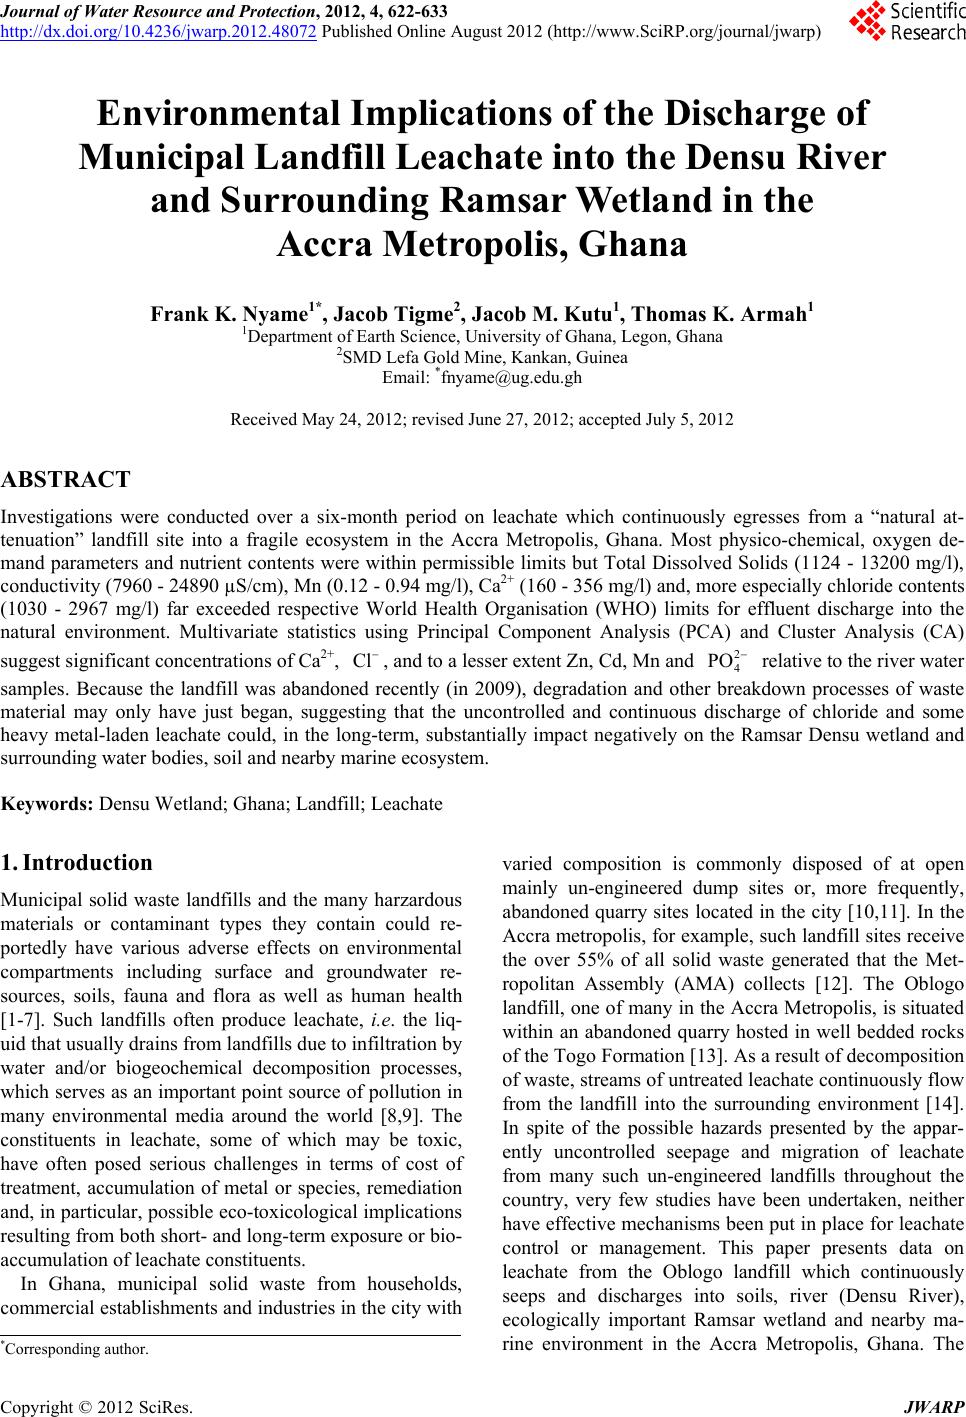
 Journal of Water Resource and Protection, 2012, 4, 622-633 http://dx.doi.org/10.4236/jwarp.2012.48072 Published Online August 2012 (http://www.SciRP.org/journal/jwarp) Environmental Implications of the Discharge of Municipal Landfill Leachate into the Densu River and Surrounding Ramsar Wetland in the Accra Metropol is, Ghana Frank K. Nyame1*, Jacob Tigme2, Jacob M. Kutu1, Thomas K. Armah1 1Department of Earth Science, University of Ghana, Legon, Ghana 2SMD Lefa Gold Mine, Kankan, Guinea Email: *fnyame@ug.edu.gh Received May 24, 2012; revised June 27, 2012; accepted July 5, 2012 ABSTRACT Investigations were conducted over a six-month period on leachate which continuously egresses from a “natural at- tenuation” landfill site into a fragile ecosystem in the Accra Metropolis, Ghana. Most physico-chemical, oxygen de- mand parameters and nutrient contents were within permissible limits but Total Dissolved Solids (1124 - 13200 mg/l), conductivity (7960 - 24890 µS/cm), Mn (0.12 - 0.94 mg/l), Ca2+ (160 - 356 mg/l) and, more especially chloride contents (1030 - 2967 mg/l) far exceeded respective World Health Organisation (WHO) limits for effluent discharge into the natural environment. Multivariate statistics using Principal Component Analysis (PCA) and Cluster Analysis (CA) suggest significant concentrations of Ca2+, , and to a lesser extent Zn, Cd, Mn and relative to the river water samples. Because the landfill was abandoned recently (in 2009), degradation and other breakdown processes of waste material may only have just began, suggesting that the uncontrolled and continuous discharge of chloride and some heavy metal-laden leachate could, in the long-term, substantially impact negatively on the Ramsar Densu wetland and surrounding water bodies, soil and nearby marine ecosystem. Cl2 4 PO Keywords: Densu Wetland; Ghana; Landfill; Leachate 1. Introduction Municipal solid waste landfills and the many harzardous materials or contaminant types they contain could re- portedly have various adverse effects on environmental compartments including surface and groundwater re- sources, soils, fauna and flora as well as human health [1-7]. Such landfills often produce leachate, i.e. the liq- uid that usually drains from landfills due to infiltration by water and/or biogeochemical decomposition processes, which serves as an important point source of pollution in many environmental media around the world [8,9]. The constituents in leachate, some of which may be toxic, have often posed serious challenges in terms of cost of treatment, accumulation of metal or species, remediation and, in particular, possible eco-toxicological implications resulting from both short- and long-term exposure or bio- accumulation of leachate constituents. In Ghana, municipal solid waste from households, commercial establishments and industries in the city with varied composition is commonly disposed of at open mainly un-engineered dump sites or, more frequently, abandoned quarry sites located in the city [10,11]. In the Accra metropolis, for example, such landfill sites receive the over 55% of all solid waste generated that the Met- ropolitan Assembly (AMA) collects [12]. The Oblogo landfill, one of many in the Accra Metropolis, is situated within an abandoned quarry hosted in well bedded rocks of the Togo Formation [13]. As a result of decomposition of waste, streams of untreated leachate continuously flow from the landfill into the surrounding environment [14]. In spite of the possible hazards presented by the appar- ently uncontrolled seepage and migration of leachate from many such un-engineered landfills throughout the country, very few studies have been undertaken, neither have effective mechanisms been put in place for leachate control or management. This paper presents data on leachate from the Oblogo landfill which continuously seeps and discharges into soils, river (Densu River), ecologically important Ramsar wetland and nearby ma- rine environment in the Accra Metropolis, Ghana. The *Corresponding author. C opyright © 2012 SciRes. JWARP 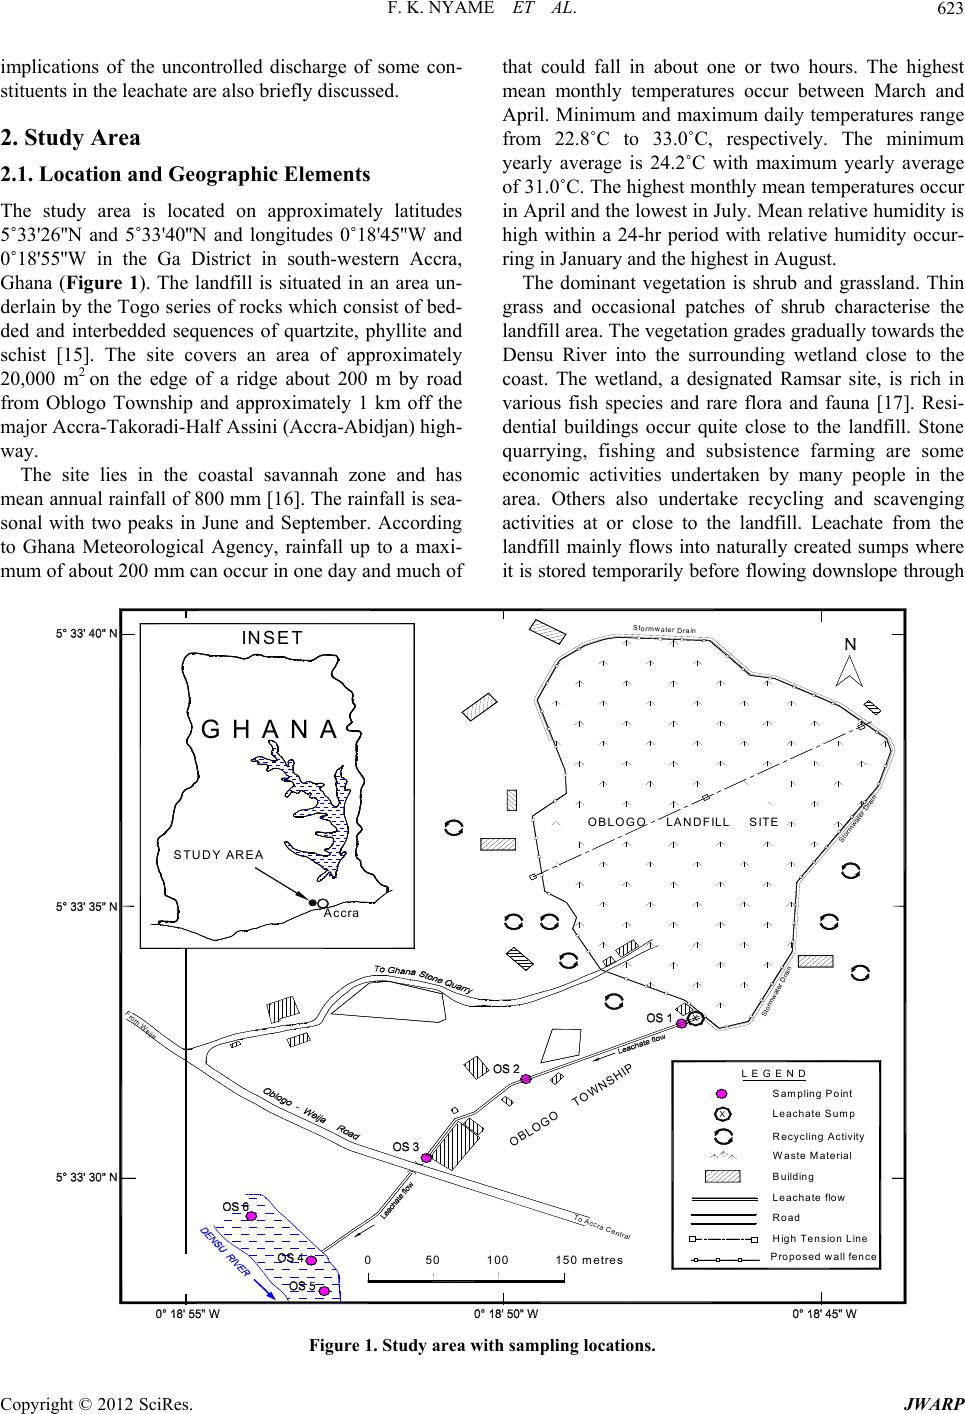 F. K. NYAME ET AL. 623 implications of the uncontrolled discharge of some con- stituents in the leachate are also briefly discussed. 2. Study Area 2.1. Location and Geographic Elements The study area is located on approximately latitudes 5˚33'26''N and 5˚33'40''N and longitudes 0˚18'45''W and 0˚18'55''W in the Ga District in south-western Accra, Ghana (Figure 1). The landfill is situated in an area un- derlain by the Togo series of rocks which consist of bed- ded and interbedded sequences of quartzite, phyllite and schist [15]. The site covers an area of approximately 20,000 m2 on the edge of a ridge about 200 m by road from Oblogo Township and approximately 1 km off the major Accra-Takoradi-Half Assini (Accra-Abidjan) high- way. The site lies in the coastal savannah zone and has mean annual rainfall of 800 mm [16]. The rainfall is sea- sonal with two peaks in June and September. According to Ghana Meteorological Agency, rainfall up to a maxi- mum of about 200 mm can occur in one day and much of that could fall in about one or two hours. The highest mean monthly temperatures occur between March and April. Minimum and maximum daily temperatures range from 22.8˚C to 33.0˚C, respectively. The minimum yearly average is 24.2˚C with maximum yearly average of 31.0˚C. The highest monthly mean temperatures occur in April and the lowest in July. Mean relative humidity is high within a 24-hr period with relative humidity occur- ring in January and the highest in August. The dominant vegetation is shrub and grassland. Thin grass and occasional patches of shrub characterise the landfill area. The vegetation grades gradually towards the Densu River into the surrounding wetland close to the coast. The wetland, a designated Ramsar site, is rich in various fish species and rare flora and fauna [17]. Resi- dential buildings occur quite close to the landfill. Stone quarrying, fishing and subsistence farming are some economic activities undertaken by many people in the area. Others also undertake recycling and scavenging activities at or close to the landfill. Leachate from the landfill mainly flows into naturally created sumps where it is stored temporarily before flowing downslope through Wast High Te Buildin e M aterial nsion Line g Leachate Sump Sampling Point L E G E N D From Weija X Road 0 50 100 150 me tres To Accra Central Stormwater Drain Stormwater Drain Stormwater Drain OBLOGO TOWNSHIP O BL O GO L A N DF IL L S IT E X Recycling Activity G H A N A INSET STUDY AREA Accra Pro Leachat posed wall fence e flow Figure 1. Study are a with sampling locations. Copyright © 2012 SciRes. JWARP  F. K. NYAME ET AL. 624 Oblogo Township and parts of the wetland to join the Densu River about 250 m from the landfill. The river then flows less than a kilometre through the wetland into the Atlantic Ocean. 3. Methodology 3.1. Field Work The study involved sampling and analysing leachate and river water along approximately 250 m from the landfill at an interval of about 100 m for six months. The loca- tion and description of sampling sites are given in Table 1. Sampling was done between January and June, 2004. A hand-held Global Positioning System (GPS) was used to locate sampling points. Samples were taken at varying but designated locations from the landfill site up to where leachate entered the Densu River through the wetland system (Figure 1). Samples were collected in the dry (January to March) and rainy (April to June) seasons once every month from six sampling points in accor- dance with protocols on sampling by APHA [18]. Most samples were collected in plastic bottles and labelled appropriately. Three samples were taken at each sample point, one in a 1.5-litre plastic bottle for physico-chemi- cal analysis, another in a 100 ml plastic bottle acidified with nitric acid for mainly heavy metal contents and the third in a standard “ox top” bottle for oxygen demand parameters. Sample bottles were first rinsed with leachate or water before carefully dipping individual bottles in flowing leachate and water at the respective sampling points. These precautions were taken to reduce contami- nation. The collected samples were then kept in an ice chest in the field and later transferred into a refrigerator until analysis was done. 3.2. Analysis of Leachate and Water Samples Analytical methods used for leachate and water samples varied depending on the parameters of interest. All field and laboratory determinations were done according to standard methods for the examination of waste and waste water [19]. For every sample, physico-chemical, nutri- ents and oxygen demand parameters were determined. Measurements of physical parameters were taken in situ by the use of a Water Quality Check U-10 instrument. Values of measured parameters were read from the digi- tal display when the Checker U-10 was immersed in the respective samples. Physico-chemical parameters were determined at the Water Research Institute (WRI) of the Council for Scien- tific and Industrial Research (CSIR, Ghana). Trace met- als Fe, Mn, Zn and Cd were determined with Unicom Atomic Absorption Spectrometer (AAS). Samples were first treated with a mixture of concentrated nitric, sul- phuric and perchloric acid in a digest and each sample solution aspirated into a flame and atomized. A light beam was then directed through the flame into a mono- chromator and onto a detector that measured the amount of light absorbed by the element in the flame. A blank sample (acidified) was also aspirated to set the automatic zero control. At least six standards were used for each element. Various samples were then aspirated individu- ally and the respective concentrations obtained from the digital display. Concentration of sulphate in the samples was determined by the sulphate-turbidimetric method. To 100 ml of the sample, 5 ml of conditioning reagent (bar- ium chloride) was added and stirred for about 60 seconds. The absorbance was read at 420 nm on a spectrometer. Concentration of sulphate was then calculated from standard calibration formula. Phosphate 4 2 PO was also determined using the stannous chloride acid method (APHA, 2005). Biochemical Oxygen Demand (BOD) was determined by diluting portions of the sample and incubating for 5 days at 20˚C. The BOD exerted over the 5 days deter- Table 1. Location and description of leachate and stream or river water samples relative to landfill site, Accra, Ghana. Sample No.* Description of Sample Point Sample Type** GPS Location~Distance (m) from landfill (Reference Pt.) OS1 Naturally-created leachate sump Landfill leachate0˚18'44.8''W 5˚33'33.8''N 5 OS2 Artificial (dug) sump Landfill leachate0˚18'49.6''W 5˚33'32.6''N 100 OS3 Natural leachate sump Landfill leachate0˚18'52.8''W 5˚33'31.1''N 200 OS4 Leachate confluence with Densu River River water 0˚18'52.3''W 5˚33'25.8''N 220 OS5 Slightly upstream of leachate confluence with Densu River River water 0˚18'54.8''W 5˚33'25.1''N 230 OS6 Downstream of leachate confluence with Densu River River water 0˚18'55.1''W 5˚33'28.1''N 250 *OS1 represents the first leachate sampling point at a sump topographically just below landfill; OS2 sample point along leachate flow path downslope or down gradient of OS1; OS3 is located along leachate flow path close to a major road linking Oblogo and Weija; OS4 is located in an area where the leachate empties into the Densu River; OS5 and OS6 are located downstream and upstream of OS4, respectively (Figure 1). **River water = sample taken from Densu River. Copyright © 2012 SciRes. JWARP  F. K. NYAME ET AL. 625 mined as follows: Calculations BOD5 = BOD × S1 × S2 where BOD5 = BOD recorded on the fifth day from the Oxi- top. S1 = Dilution factor. S2 = Factor dependent on total volume of diluted sam- ple put in Oxitop bottle. In determining the Chemical Oxygen Demand (COD), the sample was refluxed in concentrated sulphuric acid with a known excess of potassium dichromate (K2Cr2O7) for two hours. After digestion, the remaining reduced K2Cr2O7 was titrated with ferrous ammonium sulphate to determine the amount of K2Cr2O7 consumed and the oxidi- zable matter calculated in terms of the oxygen equivalent. Microsoft Excel (version 2007) was used to obtain correlation coefficients between measured physical-che- mical and nutrient parameters for leachate and river wa- ter. In addition, the data were subjected to multivariate statistical analyses [20,21] involving Principal Compo- nent Analysis (PCA) and Cluster Analysis (CA) using SPSS (version 12.0). 4. Results 4.1. Physicochemical Data for Landfill Leachate Data on parameters from leachate samples taken during the study are presented in Table 2(a). pH values of leachate range from 6.6 close to the landfill (~5 m) in January to 7.9 (mean 7.4) in Aprilat a distance of 200 m from the landfill. Throughout the sampling period as well as outwards from the landfill, the pH of leachate thus remained fairly uniform. Temperature values also range from a minimum of 27.8˚C in April at distance 5 m to a maximum of 35.3˚C in January at the same sampling site, i.e. 5 m from the landfill. Even though minor differences occur up to about 100 m from the landfill, the values in general suggest not much change in temperature of leachate with respect to sampling period or distance from the landfill site. The lowest and highest conductivity values of 7960 and 24,890 µS/cm were obtained in leachate taken respectively in March (distance 5 m) and June (distance 100 m) from the landfill. Range of values for total dissolved solids (TDS), salinity and turbidity of leachate were as follows; TDS 1124 mg/l in April at about 100 m from the landfill to 13,200 mg/l also in April at about 100 m from the landfill; salinity 0.18% in June at 200 m from landfill to 2.02% in April at 5 m from landfill; turbidity 3.1 NTU in June at 200 m to 60.1 NTU in April at 100 m (Table 2(a)). Fe concentrations in leachate ranged from 2.05 - 18.0 mg/l at 200 m and 5 m, respectively, from the landfill, the lowest value in April and the highest in January (Ta- ble 2(a)). Cadmium, Zinc and manganese also varied from 0 - 2.45 mg/l (distance 100 m and 5 m both in Janu- ary), 0.02 - 0.28 mg/l (distance 100 m in February and 5 m in January) and 0.12 - 0.94 mg/l, respectively. Both the minimum (0.12 mg/l) and maximum (0.94 mg/l) Mn values were obtained at more than one site (Table 2(a)). Calcium and chloride contents ranged from 160 - 356 mg/l (mean 276.7 mg/l) and 1030 - 2967 mg/l (mean 2291 mg/l), respectively, whilst total hardness also ranged from 104 to 1300 mg/l (mean 889.7 mg/l). The highest Ca2+ value was obtained in March in leachate sample taken about 5 m from the landfill and the lowest in January about 200 m from the landfill. Chloride in leachate (Table 2(a)), on the other hand, registered the highest and lowest values in June, the former nearer the landfill (distance 5 m) and the latter farther away (dis- tance 200 m). The nutrient contents of leachate, as given by concen- trations of 4, 4 2 PO -P 2 SO and 3 (Table 2(a)), also showed variations with respect to distance from the landfill and sampling period. 4 contents ranged from 8.23 mg/l in April at about 200m from the landfill to 30 mg/l in January about 100 m from the landfill. The highest concentrations of SO4 2− (68.3 mg/l) and 3 (41.52 mg/l) were both obtained in January at site 5 m from the landfill whilst the lowest (i.e. 4 NO -N 2 PO -P NO -N 2 SO 28.6 mg/l and 1.03 mg/l) were also obtained in June with the 4 3 NO -N 2 SO at 200 m and 3 at 100 m from the landfill. The oxygen demand parameters DO, BOD and COD also exhibited variations with respect to sampling site and period but were generally characterised by low values (Table 2(a)). NO -N 2 PO -P 2 SO 4.2. Physicochemical Data for River (Densu) Water Table 2(b) gives data from water samples taken from the Densu River into which leachate egresses (see Figure 1). Except for Cd and Zn that were generally below detec- tion, the data show perceptible variations with respect to site and period of sampling. pH ranged from 6.6 - 8.1 (mean 7.5), temperature 27.8˚C - 31.2˚C (mean 29.4), conductivity 610 - 1903 µS/cm, TDS 102 - 450 mg/l, salinity 0.01% - 0.13% and turbidity 2.0 - 45.1 NTU. Fe and Mn ranged from 0.12 - 1.23 mg/l and 0.12 - 0.92 mg/l, respectively. Calcium, chloride and total hardness also ranged from 23 - 70 mg/l (mean 36.1 mg/l), 59 - 105 mg/l (mean 81.8 mg/l) and 60 - 140 mg/l (mean 104.7 mg/l), respectively. Other variations were as follows; 4 0.15 - 10 mg/l (mean 2.23 mg/l), 4 16.1 - 33.8 mg/l (mean 25 mg/l), 3 (0.23 - 21.02 mg/l (mean 5.6 mg/l), DO 0.26 - 1.64 mg/l (mean 0.94 mg/l), BOD 0.03 - 1.04 mg/l (mean 0.20 mg/l) and COD 0.12 - .93 mg/l (mean 0.93 mg/l). NO -N 1 Copyright © 2012 SciRes. JWARP  F. K. NYAME ET AL. 626 Table 2. (a) Physico-chemical data from landfill leachate from January to June, 2004, Accra, Ghana; (b) Physico-chemical data from River water from January to June, 2004, Accra, Ghana. (a) Month Spl. Pt pH Temp (˚C) Cond. ×103 (μS/cm) TDS ×103 (mg/l) Salinity (%) Turb. (NTU) Fe (mg/l) Cd (mg/l) Zn (mg/l) Mn (mg/l) Ca2+ (mg/l) Cl (mg/l) Total Hard (mg/l) 2 4 PO -P (mg/l) SO2 4 3 NO -N (mg/l) (mg/l) DO (mg/l) BOD (mg/l) COD (mg/l) OS1 6.61 35.3 21.61 10.80 1.31 41.0 18.002.450.280.122412730100022.8068.30 41.52 0.630.811.28 OS2 7.59 28.3 24.82 7.58 0.88 36.2 14.000.000.180.15168193680030.0063.20 33.03 0.990.361.23 Jan OS3 7.68 28.3 23.13 9.01 0.95 31.2 9.780.050.120.14160198660017.0043.10 26.01 0.420.762.01 OS1 7.57 32.3 24.28 12.46 1.52 55.0 10.201.230.070.193482878120018.6063.70 15.23 0.510.231.32 OS2 7.61 29.4 15.12 8.97 1.12 48.1 10.100.010.020.35326235690017.3058.50 14.76 0.480.311.41 Feb OS3 7.54 28.7 16.83 9.66 0.98 21.1 5.870.080.090.12189178211011.3048.90 12.53 0.470.121.23 OS1 7.63 32.7 7.96 10.79 1.51 56.1 8.780.980.050.233562913110018.9065.10 5.02 0.130.211.04 OS2 7.65 29.5 8.23 8.62 1.01 43.0 5.890.210.060.323422798100014.9056.30 4.89 0.520.420.43Mar OS3 7.58 28.8 18.34 4.22 0.54 23.1 4.980.030.030.28289118990011.8044.00 2.43 0.390.811.03 OS1 7.75 27.8 24.43 13.20 2.02 54.9 6.320.780.040.342872889120016.0059.90 4.25 0.180.121.06 OS2 6.98 28.7 20.03 1.12 1.68 60.1 4.320.520.030.942912098100017.0049.40 9.03 0.380.250.96 Apr OS3 7.87 29.6 18.34 9.08 0.64 56.1 2.050.430.020.1232112348008.2342.30 8.05 0.090.210.86 OS1 7.65 29.8 24.28 11.22 1.98 48.9 5.320.460.030.723422798130016.5052.20 3.23 1.021.031.89 OS2 7.36 27.8 21.74 11.88 1.23 50.9 4.820.620.020.453292869100020.0049.00 9.23 0.480.931.07May OS3 6.79 29.4 20.04 11.24 0.56 35.7 3.480.640.030.2316226911049.4632.80 8.24 0.280.960.89 OS1 7.21 32.2 23.87 10.90 2.01 52.9 6.980.380.040.233212967110012.1040.80 3.02 0.920.781.74 OS2 7.13 30.1 24.89 12.45 1.02 56.8 6.050.640.050.943402106100010.2032.70 1.03 1.020.341.29 Jun OS3 7.77 28.8 20.65 1.26 0.18 3.1 5.890.840.070.6716910309009.3428.60 9.01 1.030.560.89 WHO limit 6.5 - 8.5 - - 1000 - 5 3 0.0033 0.50200250500- 400 10 - - (b) Month Spl. Pt pH Temp (˚C) Cond. ×103 (μS/cm) TDS (mg/l) Salinity (%) Turb. (NTU) Fe (mg/l) Cd (mg/l) Zn (mg/l) Mn (mg/l) Ca2+ (mg/l) Cl (mg/l) Total Hard (mg/l) 2 4 PO -P (mg/l) SO2 4 3 NO -N (mg/l) (mg/l) DO (mg/l) BOD (mg/l) COD (mg/l) OS4 6.56 29.7 610 402 0.02 2.6 0.860.010.010.472575 12010.0028.80 10.89 1.640.081.68 OS5 7.69 29.9 870 450 0.04 3.0 0.780.030.020.462678 1308.5830.10 20.78 1.580.051.32 Jan OS6 7.84 30.1 790 305 0.03 2.7 0.870.020.030.512873 1405.0229.30 10.41 1.610.061.93 OS4 8.13 27.9 830 308 0.13 4.3 0.45BDBD0.152887 1090.6433.80 0.35 0.750.141.49 OS5 7.89 28.8 740 360 0.09 3.7 0.41BDBD0.132579 1080.3427.00 0.41 0.690.151.85 Feb OS6 7.97 29.5 630 415 0.08 4.1 0.32BDBD0.182585 1080.1527.00 0.95 0.730.111.34 OS4 8.02 28.6 670 424 0.05 3.2 0.14BDBD0.182459 1090.1823.70 0.56 0.480.121.06 OS5 7.98 29.1 710 209 0.08 3.0 0.12BDBD0.162376 1070.1628.40 0.82 0.670.090.98Mar OS6 6.99 28.4 740 322 0.07 2.3 0.13BDBD0.122474 1080.1929.70 0.68 0.630.071.06 OS4 7.94 30.4 850 428 0.01 45.1 0.21BDBD0.3432971202.0425.50 1.08 1.030.091.23 OS5 6.89 29.8 980 354 0.03 7.0 0.19BDBD0.182487 1103.7830.60 1.05 1.120.030.84 Apr OS6 7.58 28.5 780 352 0.02 7.1 0.19BDBD0.922859 1001.7829.40 0.96 0.940.060.67 OS4 6.97 27.8 1080 122 0.08 4.0 0.12BDBD0.466289 1001.0518.90 0.23 0.260.030.21 OS5 7.02 30.4 690 328 0.02 4.7 0.17BDBD0.285997 1021.8919.10 0.34 0.961.040.12May OS6 7.12 31.2 790 425 0.04 2.7 0.23BDBD0.617076 1041.2917.90 1.23 0.850.380.14 OS4 6.69 28.4 1903 102 0.05 2.9 1.23BDBD0.2134 105 800.6916.10 21.02 1.050.340.28 OS5 7.56 29.6 1480 403 0.03 2.0 1.02BDBD0.1642 100 701.0517.20 20.03 1.010.450.31 Jun OS6 8.12 31.2 1263 324 0.04 2.7 0.23BDBD0.617076601.2918.20 8.56 0.850.380.14 WHO limit 6.5 - 8.5 - - 1000 - 5 3 0.0033 0.50200250500- 400 10 - - B D: below detection. Distances of sample sites from landfill: OS4: 220 m; OS5: 230 m; OS6: 250 m. Copyright © 2012 SciRes. JWARP 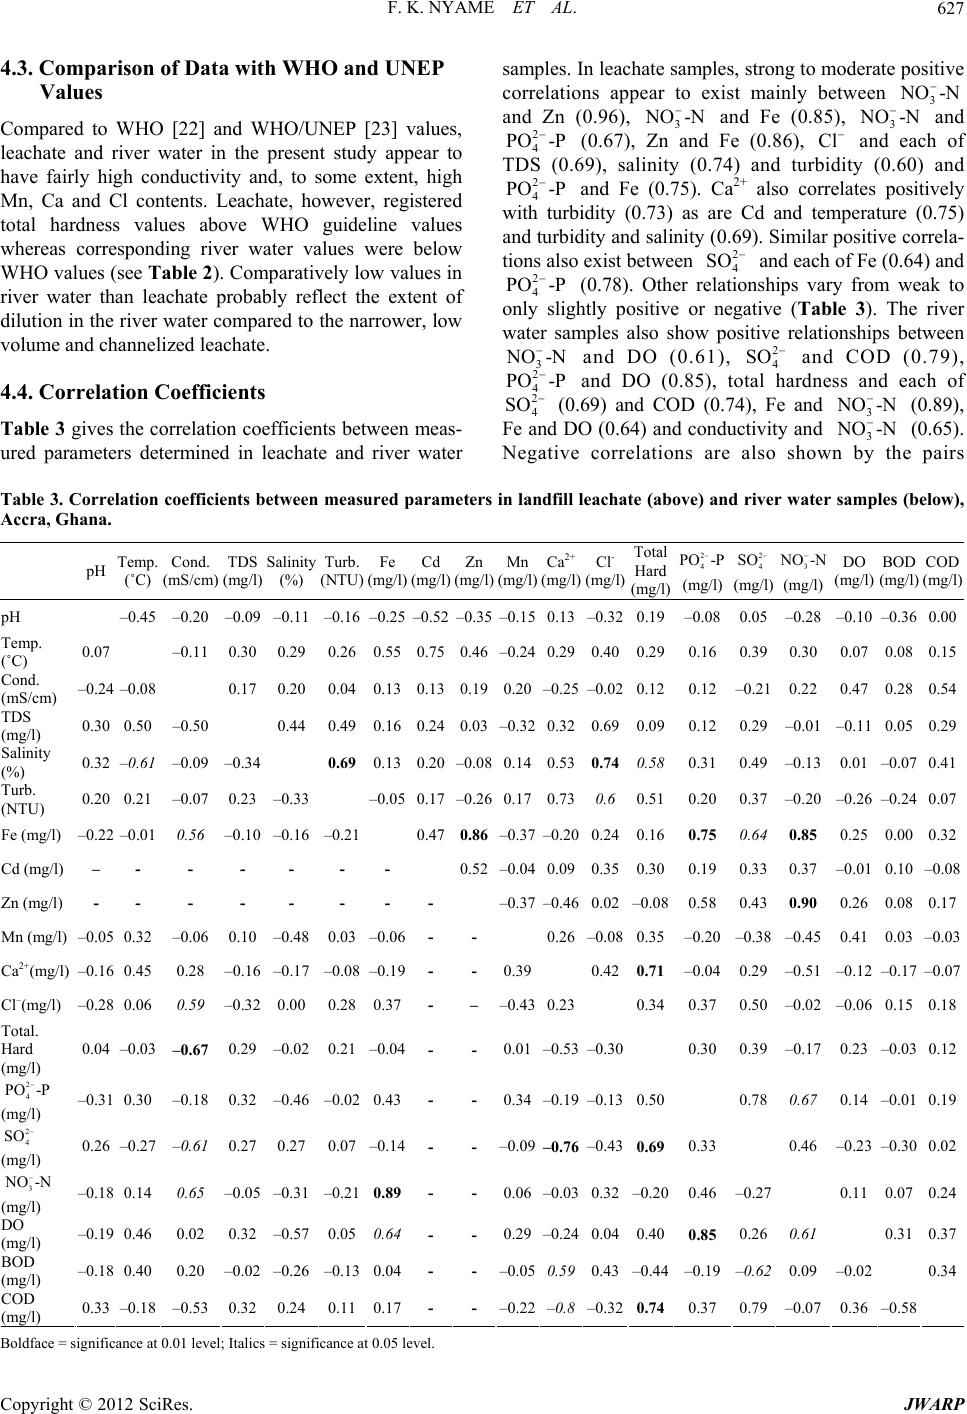 F. K. NYAME ET AL. 627 4.3. Comparison of Data with WHO and UNEP Values Compared to WHO [22] and WHO/UNEP [23] values, leachate and river water in the present study appear to have fairly high conductivity and, to some extent, high Mn, Ca and Cl contents. Leachate, however, registered total hardness values above WHO guideline values whereas corresponding river water values were below WHO values (see Table 2). Comparatively low values in river water than leachate probably reflect the extent of dilution in the river water compared to the narrower, low volume and channelized leachate. 4.4. Correlation Coefficients Table 3 gives the correlation coefficients between meas- ured parameters determined in leachate and river water samples. In leachate samples, strong to moderate positive correlations appear to exist mainly between 3 and Zn (0.96), 3 and Fe (0.85), 3 and 4 (0.67), Zn and Fe (0.86), Cl and each of TDS (0.69), salinity (0.74) and turbidity (0.60) and 4 and Fe (0.75). Ca2+ also correlates positively with turbidity (0.73) as are Cd and temperature (0.75) and turbidity and salinity (0.69). Similar positive correla- tions also exist between 4 and each of Fe (0.64) and 4 (0.78). Other relationships vary from weak to only slightly positive or negative (Table 3). The river water samples also show positive relationships between and DO (0.61), 4 SO and COD (0.79), and DO (0.85), total hardness and each of 4 NO -N NO -N NO -N 2 PO -P 2 PO -P 2 SO 2 PO -P 3 NO -N 2 2 4 PO -P 2 SO (0.69) and COD (0.74), Fe and (0.89), Fe and DO (0.64) and conductivity and 3 (0.65). Negative correlations are also shown by the pairs 3 NO -N NO -N 2 4 PO -P 2 4 SO 3-N Table 3. Correlation coefficients between measured parameters in landfill leachate (above) and river water samples (below), Accra, Ghana. pH Temp. (˚C) Cond. (mS/cm) TDS (mg/l) Salinity (%) Turb. (NTU) Fe (mg/l) Cd (mg/l) Zn (mg/l) Mn (mg/l) Ca2+ (mg/l) Cl- (mg/l) Total Hard (mg/l) (mg/l) (mg/l) NO (mg/l) DO (mg/l) BOD (mg/l) COD (mg/l) pH –0.45 –0.20 –0.09 –0.11 –0.16 –0.25–0.52–0.35–0.150.13–0.320.19–0.080.05 –0.28 –0.10–0.360.00 Temp. (˚C) 0.07 –0.11 0.30 0.29 0.26 0.550.750.46–0.240.290.400.290.160.39 0.30 0.07 0.080.15 Cond. (mS/cm) –0.24 –0.08 0.17 0.20 0.04 0.130.130.190.20–0.25–0.020.120.12–0.21 0.22 0.47 0.280.54 TDS (mg/l) 0.30 0.50 –0.50 0.44 0.49 0.160.240.03–0.320.320.690.090.120.29 –0.01 –0.110.050.29 Salinity (%) 0.32 –0.61 –0.09 –0.34 0.69 0.13 0.20–0.080.14 0.530.74 0.58 0.310.49 –0.13 0.01 –0.070.41 Turb. (NTU) 0.20 0.21 –0.07 0.23 –0.33 –0.050.17–0.260.170.730.6 0.510.200.37 –0.20 –0.26–0.240.07 Fe (mg/l) –0.22 –0.01 0.56 –0.10 –0.16 –0.21 0.470.86 –0.37 –0.200.240.160.75 0.64 0.85 0.25 0.000.32 Cd (mg/l) – - - - - - - 0.52–0.040.090.350.300.190.33 0.37 –0.010.10–0.08 Zn (mg/l) - - - - - - - - –0.37–0.460.02–0.080.580.43 0.90 0.26 0.080.17 Mn (mg/l) –0.05 0.32 –0.06 0.10 –0.48 0.03 –0.06- - 0.26–0.080.35–0.20–0.38 –0.45 0.41 0.03–0.03 Ca2+(mg/l) –0.16 0.45 0.28 –0.16 –0.17 –0.08 –0.19- - 0.39 0.420.71 –0.040.29 –0.51 –0.12–0.17–0.07 Cl–(mg/l) –0.28 0.06 0.59 –0.32 0.00 0.28 0.37- – –0.430.23 0.340.370.50 –0.02 –0.060.150.18 Total. Hard (mg/l) 0.04 –0.03 –0.67 0.29 –0.02 0.21 –0.04- - 0.01–0.53–0.30 0.300.39 –0.17 0.23 –0.030.12 2 4 PO -P 2 4 SO 3 NO -N (mg/l) –0.31 0.30 –0.18 0.32 –0.46 –0.02 0.43- - 0.34–0.19–0.130.50 0.78 0.67 0.14 –0.010.19 (mg/l) 0.26 –0.27 –0.61 0.27 0.27 0.07 –0.14- - –0.09 –0.76 –0.43 0.69 0.33 0.46 –0.23–0.300.02 (mg/l) –0.18 0.14 0.65 –0.05 –0.31 –0.21 0.89- - 0.06–0.030.32–0.200.46–0.27 0.11 0.070.24 DO (mg/l) –0.19 0.46 0.02 0.32 –0.57 0.05 0.64 - - 0.29 –0.24 0.040.400.85 0.26 0.61 0.310.37 BOD (mg/l) –0.18 0.40 0.20 –0.02 –0.26 –0.13 0.04- - –0.050.59 0.43 –0.44–0.19–0.62 0.09 –0.02 0.34 COD (mg/l) 0.33 –0.18 –0.53 0.32 0.24 0.11 0.17- - –0.22–0.8 –0.32 0.74 0.370.79 –0.07 0.36 –0.58 B oldface = significance at 0.01 level; Italics = significance at 0.05 level. Copyright © 2012 SciRes. JWARP  F. K. NYAME ET AL. 628 Ca2+ and 4 (–0.76), Ca2+ and COD (–0.76), conduc- tivity and total hardness (–0.67), conductivity and 4 2 SO 2 SO (–0.61), temperature and salinity (–0.61) and 4 2 SO and BOD (–0.62). Other pairs of parameters seem to show little or no correlations with one another (Tabl e 3). 4.5. Multivariate Principal Component (PCA) and Cluster Analyses (CA) 4.5.1. PC A and CA for Leachate The dendrogram for leachate samples (Figure 2) sug- gests three distinct clusters. Cluster 1 consists of pH, Mn, BOD, DO, COD and electrical conductivity (EC). Clus- ter 2 comprises TDS, Cl, Salinity, total hardness, Ca, turbidity and Cd whilst cluster 3 is made up of tempera- ture, , , Fe, and Zn. 2 4 POSO 3 4 3 NO Cl Varimax rotation of the landfill leachate data is pro- vided in Table 4 and the scree plot in Figure 3. Principal component 1 (PC1), which explains ~23% of the vari- ance, consists of TDS, salinity, turbidity, Ca, controlled by TDS, DO, BOD and COD whilst PC4 con- sists of pH, temperature and Cd. There is a negative loading of pH as compared to a positive loading of Cd. PC5 loading is made up of Mn, total hardness and DO. 4.5.2. PCA and CA for River (Densu) Water , total hardness & . High loading on Ca and total hard- ness suggests that calcium probably contributes mostly to the hardness of the leachate whereas 4 and 2 4 SO 2ClSO also suggest increased significance of agricultural and/or organically derived inputs. PC2 loading comprises Fe, Zn, , and . There is strong correlation between cluster 3 and PC2 suggesting that the presence of the metals Fe and Zn in leachate could have come from a common source in the landfill waste or material. , and 3 are all likely sourced from ag- ricultural or organic wastes in the landfill pile. PC3 is 3 4 PO 3 4 PO 2 4 SO 2 4 SO 3 NO NO 2 SO The interrelationships between the various parameters measured for the river water samples are given by the dendrogram (Figure 4) three different clusters. Cluster 1 consists of mainly 4 , COD, total hardness, TDS, pH, turbidity and salinity. Cluster 2 comprises 4 2 PO , DO, temperature and Mn whilst cluster 3 is made up of Fe, 3 , electrical conductivity, Cl, Ca, and BOD. NO Table 5 and scree plot (Figure 5) suggest that up to ~89% of the original mean logs of the dataset is gathered in the first six components with Eigen values > 1. Prin- cipal Component 1 (PC1) gives ~27% of the variance and the parameters that are loaded in this component include electrical conductivity, Ca, total hardness, 4 2 SO and BOD. High loading of sulphate to water chemistry suggests contribution from agricultural activities such as use of fertilizers. PC2 consists of mainly electrical con- ductivity, Fe, 3 NO and DO. High loadings of Fe may suggest dissolution of Fe-bearing bedrock in river water since the Densu River is known to drain iron-rich Biri- mianmetasedimentary and metavolcanic rocks in the eastern region of Ghana. Again, anthropogenic activities may not also be ignored as suggested by the high loading on nitrate. PC3 is loaded with temperature, TDS, salinity and DO whilst PC4, PC5 and PC6 are loaded with Cl , pH and turbidity, respectively. Rescaled Linkage Distance 0 5 10 15 20 25 Zn O 3 -N Fe PO 4 -P SO 4 Temp Cd Turb Ca Total Hard Salinity Cl TDS×10 3 Cond COD DO BOD Mn H Dendrogram of landfill leachate parameters. Figure 2. Copyright © 2012 SciRes. JWARP  F. K. NYAME ET AL. 629 able 4. Rotated component mat Component Trix for landfill leachate data. 1 2 3 4 5 pH 0. 0. – –0. T Salinity Total Hard N-NO Eigenvalues % ce 02000.22 0.83 05 emp 0.32 0.34 –0.09 0.73 –0.02 Cond 0.01 0.08 0.80 0.02 0.15 TDS 0.62 0.03 0.23 0.15 –0.55 0.87 0.12 0.21 0.02 0.06 Turb 0.86 –0.07 –0.10 0.08 0.01 Fe 0.03 0.92 0.13 0.27 –0.03 Cd 0.19 0.32 –0.09 0.81 0.09 Zn –0.27 0.82 0.14 0.39 –0.06 Mn 0.10 –0.42 0.17 0.04 0.78 Ca2+ 0.81 –0.23 –0.29 0.01 0.27 Cl– 0.78 0.11 0.12 0.31 –0.26 0.67 0.17 –0.02 –0.010.62 PO4-P 0.25 0.85 0.09 –0.07 0.05 SO42– 0.51 0.75 –0.31 –0.02 –0.11 3– –0.28 0.86 0.16 0.22 –0.18 DO –0.14 0.15 0.62 0.06 0.56 BOD –0.13 –0.16 0.60 0.35 –0.07 COD 0.23 0.21 0.79 –0.14 -0.10 4.296 4.159 2.471 2.429 1.832 of Total varian22.61 21.89 13.00 12.789.64 Cumulative % 22.61 44.50 57.51 70.29 79.93 5. Discussion and Environmental Implications e eight ionic specThies dominant in leachate, i.e. Ca, Cl, , SO4 and NO3 are the most sig- SO4 (PC1), Fe, Zn, PO4, SO4, NO3 (PC2), Cd (PC4) and Mn (PC5) (Table 4) suggest decomposition of landfill materials through a combination of physico-chemical (inorganic) and biological (organic) processes and sub- sequent release into the effluent discharge or leachate. The seasonally wet and dry climate, together with the generally heterogeneous, unsorted or mixed nature of refuse dumped at the landfill site, may have enhanced leaching of both organic and inorganic constituents of decomposing waste by percolating rain water. Tigme [14] characterized waste at the Oblogo landfill site into dominantly organic components (70%) followed succes- sively by inert material (13%), plastics (9%), metal scraps (4%), paper (3%) and textile products (1%). The Togo host rocks [15] within which the landfill is situated is dominantly composed of quartzite and sandstone and may, hence, not contain significant amounts of ionic spe- cies such as observed in leachate, suggesting that most of these species were derived from refuse at the landfill. Though the proportion metals in the waste stream is low [14], the fairly significant presence of some metals in leachate may be an indication of the extent of decompo- sition of the metallic constitutents of the waste. The rela- tively high Ca, Cl and nutrient contents are likely remi- niscent of decomposition from the high agricultural or organic inputs of waste. In river water, Fe, Mn Scree Plot 6 5 4 3 2 1 0 1 2 3 4 5 6 7 8 9 10 11 12 13 14 15 16 17 18 19 Component Number Eigenvalue Figure 3. Scree plot of eigenvalues for landfill leachate. Copyright © 2012 SciRes. JWARP  F. K. NYAME ET AL. 630 Rescaled Linkage Distance 0 5 10 15 20 25 Fe O 3 -N Cond Cl Ca BOD PO 4 -P DO Temp Mn SO 4 COD Total Hard TDS H Turb Salinity Figure 4. Dendrogram for river water data. Table 5. Rotated component matrix for river water data. Component nificant species. Because the Densu River drains a sig- nFe Mt Ban rocks [1wo elements could have been sourced from oted chloride concentrations of 10 achate collection systems in place, continuous di ificant portio 5], these t n of and n-con ainingirimi 1 2 5 6 3 4 p the dominant underlying geological formation. Again, increased human activities such as use of fertilizers in subsistence agriculture in the Densu River catchment area may have contributed significant SO4 and NO3 con- tents to the river water. Farquhar [1] who provided data on expected contami- nant types and ranges of concentrations in leachate as function of refuse age n H 0 – 0. 0. 0. 0. p y ard 4 2 4 SO 3 NO DO alue 27.43 18.76 15.41 10.31 9.167.79 e % 27.43 46.19 61.60 71.91 81.07 88.86 .17 0.14120092 06 Tem–0.29 0.07 0.85 0.14 0.01 0.15 Cond –0.58 0.66 –0.38 –0.08 0.010.17 TDS 0.29 –0.09 0.77 0.06 0.28 0.03 Salinit0.18 –0.25 –0.57 –0.39 0.34 –0.37 Turb 0.11 –0.15 0.17 –0.03 0.090.95 Fe 0.06 0.95 0.00 –0.13 –0.11–0.09 Mn –0.16 0.02 0.20 0.91 –0.10 0.04 Ca2+ –0.85 –0.16 0.19 0.18 –0.12–0.04 Cl– –0.38 0.34 –0.07 –0.65 –0.24 0.41 Tot H0.83 –0.15 0.22 0.04 –0.24 0.09 PO-P 0.45 0.45 0.43 0.32 –0.44–0.05 0.91 –0.15 –0.02 0.05 0.08–0.05 -N –0.12 0.96 0.08 0.03 –0.04–0.07 0.36 0.65 0.53 0.18 –0.29 0.05 BOD –0.69 –0.03 0.43 –0.37 –0.19–0.15 COD 0.92 0.08 0.09 –0.11 0.19–0.03 Eigenv4.664 3.188 2.619 1.753 1.558 1.324 % of Total Variance Cumulativ 00 - 3000 mg/l for landfills in age category 0 - 5 years. Because chloride contents obtained in leachate in this study agrees fairly well or falls within this range, it could reasonably be predicted that various physico-chemical and biological decomposition processes within the land- fill may result in increased pollutant levels in leachate which would, in turn, be shed into the surrounding media for well some time before decreases in concentrations could be expected as the landfill ages [1]. As observed by Mizumura [24], chloride ion is non-reactive, non-sorp- tive and has no redox or precipitation. This suggests that much of the chloride in the leachate plume will find its way into the surrounding river and groundwater as well as soils. Because the rocks in which the landfill is situated are highly bedded [15], the landfill not engineered [11] andno le scharge of leachate may pose serious threats to the surrounding soils, water bodies, the Densu Ramsar wet- land area and also possibly on the health of people who Copyright © 2012 SciRes. JWARP 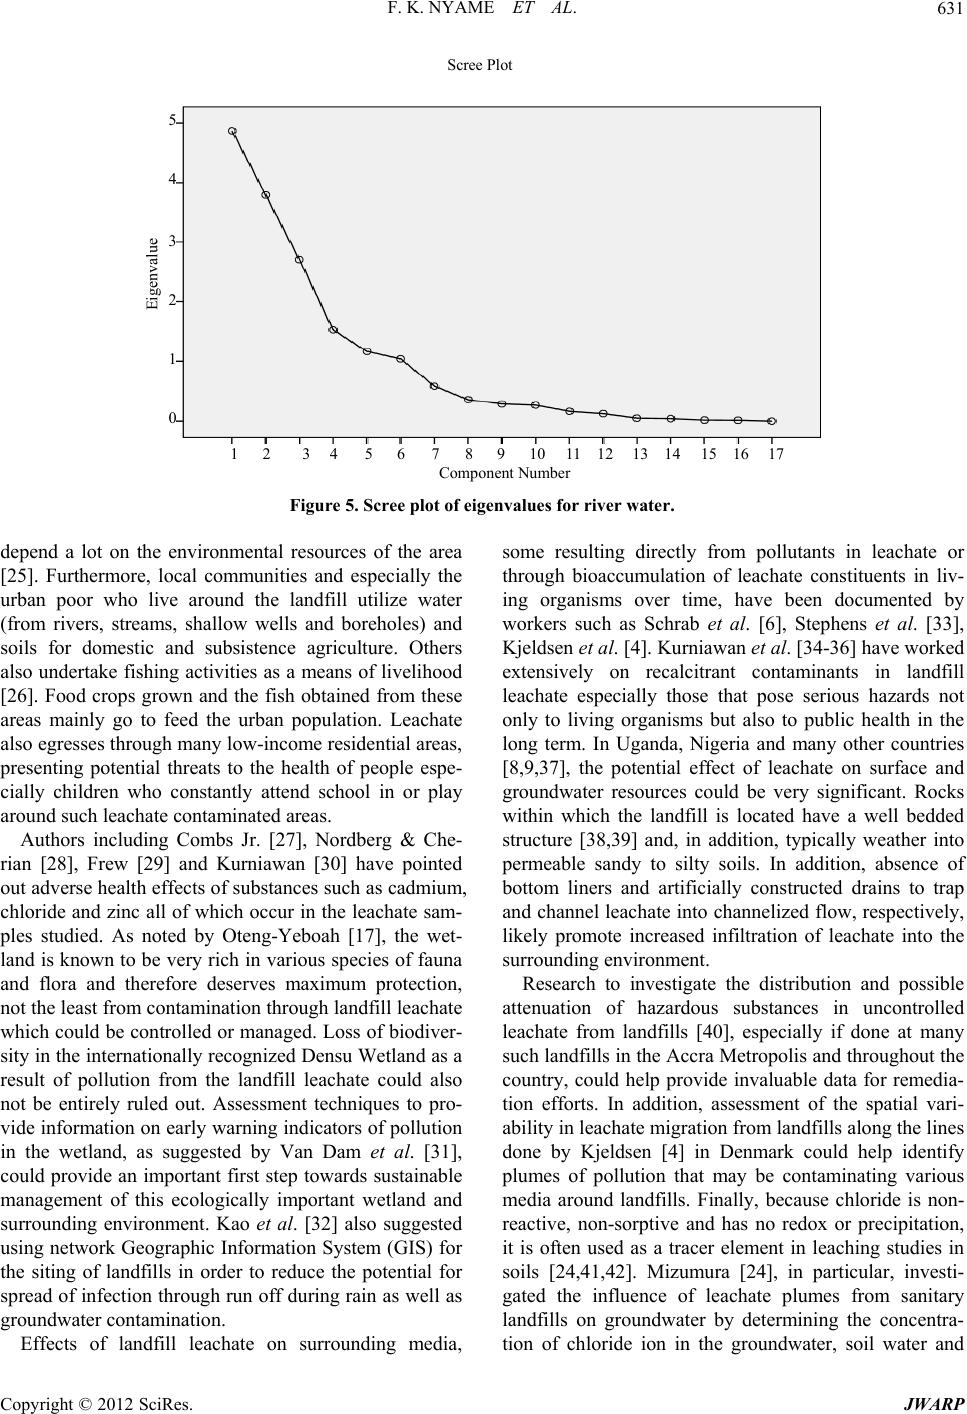 F. K. NYAME ET AL. 631 Scre e Plot 5 4 3 2 1 0 1 2 3 4 5 6 7 8 9 10 11 12 13 14 15 16 17 Component Number Eigenvalue Figure 5. Scree plot of eigenvalues for river water. depend a lot on the environmental 5]. Furthermore, local communities and especially the have pointed ou y from pollutants in leachate or through bioaccumulation of leachate constituents in liv- ave been documented by w Metropolis and throughout the co resources of the area some resulting directl [2 urban poor who live around the landfill utilize water (from rivers, streams, shallow wells and boreholes) and soils for domestic and subsistence agriculture. Others also undertake fishing activities as a means of livelihood [26]. Food crops grown and the fish obtained from these areas mainly go to feed the urban population. Leachate also egresses through many low-income residential areas, presenting potential threats to the health of people espe- cially children who constantly attend school in or play around such leachate contaminated areas. Authors including Combs Jr. [27], Nordberg & Che- rian [28], Frew [29] and Kurniawan [30] t adverse health effects of substances such as cadmium, chloride and zinc all of which occur in the leachate sam- ples studied. As noted by Oteng-Yeboah [17], the wet- land is known to be very rich in various species of fauna and flora and therefore deserves maximum protection, not the least from contamination through landfill leachate which could be controlled or managed. Loss of biodiver- sity in the internationally recognized Densu Wetland as a result of pollution from the landfill leachate could also not be entirely ruled out. Assessment techniques to pro- vide information on early warning indicators of pollution in the wetland, as suggested by Van Dam et al. [31], could provide an important first step towards sustainable management of this ecologically important wetland and surrounding environment. Kao et al. [32] also suggested using network Geographic Information System (GIS) for the siting of landfills in order to reduce the potential for spread of infection through run off during rain as well as groundwater contamination. Effects of landfill leachate on surrounding media, ing organisms over time, h orkers such as Schrab et al. [6], Stephens et al. [33], Kjeldsen et al. [4]. Kurniawan et al. [34-36] have worked extensively on recalcitrant contaminants in landfill leachate especially those that pose serious hazards not only to living organisms but also to public health in the long term. In Uganda, Nigeria and many other countries [8,9,37], the potential effect of leachate on surface and groundwater resources could be very significant. Rocks within which the landfill is located have a well bedded structure [38,39] and, in addition, typically weather into permeable sandy to silty soils. In addition, absence of bottom liners and artificially constructed drains to trap and channel leachate into channelized flow, respectively, likely promote increased infiltration of leachate into the surrounding environment. Research to investigate the distribution and possible attenuation of hazardous substances in uncontrolled leachate from landfills [40], especially if done at many such landfills in the Accra untry, could help provide invaluable data for remedia- tion efforts. In addition, assessment of the spatial vari- ability in leachate migration from landfills along the lines done by Kjeldsen [4] in Denmark could help identify plumes of pollution that may be contaminating various media around landfills. Finally, because chloride is non- reactive, non-sorptive and has no redox or precipitation, it is often used as a tracer element in leaching studies in soils [24,41,42]. Mizumura [24], in particular, investi- gated the influence of leachate plumes from sanitary landfills on groundwater by determining the concentra- tion of chloride ion in the groundwater, soil water and Copyright © 2012 SciRes. JWARP  F. K. NYAME ET AL. 632 river and observed that most of the leachate plume was discharged into a river whilst the remainder infiltrated into the ground through the weathered geological layer near the landfills. Such investigations may also be rele- vant in the present situation given that untreated leachate not only directly drains into the Densu River and adjoin- ing Ramsar wetland (at a distance less than 0.3 km from the point or landfill source) but also egresses continu- ously through households, soils and possibly into the groundwater system in the area. 6. Conclusion The current study has revealed fairly high levels of ionic constituents including Cl, SO, 4PO4, NO3 and moderate Ca, Cd and Zn in leachate discharge from the Oblogo landfill site in Accra rsity of Ghana in uirements for the award of ental Science De- za- 16, No. 3, 1989, pp. d to high contents of without treatment into the immediately surrounding environment, a situa- tion which makes the area very vulnerable to pollution. The significantly high concentrations of chloride and, to some extent, other chemical species, present formidable challenges that may need to be addressed in order to minimize possible short- and long-term stresses on the immediate environment. It is suggested that simple but cost-effective techniques such as construction of manu- ally excavated holes or ponds (“dug-outs”) in the vicinity of the landfill to impound leachate for considerable pe- riod of time could provide a necessary first step towards facilitating natural breakdown or settling of some con- stituents in leachate. The “environmental cost” of any such initiative could, under the circumstances, be a much better option than the present indiscriminate and uncon- trolled discharge of leachate into the immediate ecologi- cally important Ramsar environment. Ultimately, the risks posed by possible organic contaminants, pathogenic microorganisms and other toxic substances that may ad- ditionally be present in leachate would have to be ana- lyzed and/or monitored to also prevent or minimize their impact on the environment. In addition, it may be neces- sary to study the leachate migration patterns in tandem with leachate composition to gather information for fu- ture planning and remediation efforts. 7. Acknowledgements Data used in the study was part of the M.Phil. Thesis work submitted by J. T. to the Unive partial fulfillment of the req the Master of Philosophy in Environm gree for which we are very grateful. The Environmental Protection Agency of Ghana (EPA Ghana), Accra Met- ropolitan Assembly (AMA), the Water Research Institute (WRI) of the Council for Scientific and Industrial Re- search (CSIR), many other organizations and people who contributed in diverse ways towards data collection, analysis, and interpretation as well as during preparation of the manuscript are all gratefully acknowledged. Fi- nally, constructive criticisms by anonymous reviewers helped improve the quality of the paper considerably. REFERENCES [1] G. J. Farquhar, “Leachate: Production and Characteri tion,” Canadian Journal of Civil Engineering, Vol. 317-325. doi:10.1139/l89-057 [2] T. W. Assmutround Water Con-h and T. Strandberg, “G tamination at Finnish Landfills,” Water, Air and Soil Pol- lution, Vol. 69, No. 1-2, 1993, pp. 179-199. doi:10.1007/BF00478358 [3] L.-C. Chiang, J. E. Chang and T.-C. Wen, “Indirect Oxi- dation Effect in Electrochemical Oxidation Treatment of Landfill Leachate,” Water Resource, Vol. 29, No. 2, 1995 pp. 671-678. , [4] P. Kjeldsen, P. L. Bjerg, P. Winther, K. Rugge, J. K. Pedersen, B. Skov, A. Foverskov and T. H. Christensen, “Assessment of the Spatial Variability in Leachate Migra- tion from an Old Landfill Site. Groundwater Quality: Remediation and Protection,” Proceedings of the Prague Conference, Prague, 15-18 May 1995, pp. 365-374. [5] L. Musmeci, E. Beccaloni and M. Chiroco, “Determina- tion of Chloride in Leachates of Stabilized Waste by Ion Chromatography and by a Volumetric Method Analysis and Comparison,” Journal of Chromatography A, Vol. 706, No. 1-2, 1995, pp. 321-325. doi:10.1016/0021-9673(95)00007-A [6] G. E. Schrab, K. W. Brown and K. C. Donnelly, “Acute and Genetic Toxicity of Municipal Landfill Leachate,” Water, Air and Soil Pollution, Vol. 69, No. 1-2, 1993, pp. 99-112. doi:10.1007/BF00478351 [7] W. Stephens, S. F. Tyrell, C. Durr and O. Chopitel, “The Effect of Landfill Leachate on Biomass Production of Poplar Short Rotation Coppice,” Aspects of Applied Bi- ology, No. 49, 1997, pp. 315-319. [8] M. Loizidou and E. G. Kapentanois, “Effect of Leachate from Landfill on Underground Water Quality,” Science of the Total Environment, Vol. 128, No. 1, 1993, pp. 69-81. doi:10.1016/0048-9697(93)90180-E [9] M. Mwiganga,and F. Kansime, “The Impact of Mpererwe Landfill in Kampala-Uganda on the Surrounding Envi- ronment,” Physics and Chemistry of the Earth, Vol. 30, No. 11-16, 2005, pp. 744-750. [10] A. H. Teley, “The Impact of Waste Disposal on the Sur- face and Groundwater Environment: A case Study of the Mallam Landfill Site, Accra,” M.Phil. Thesis, University of Ghana, Accra, 2001. [11] E. D. Anomanyo, “Integration of Municipal Solid Waste Management in Accra (Ghana): Bioreactor Treatment Technology as an Integral Part of the Management Proc- ess,” M.Sc. Thesis, University of Lund, Lund, 2004. [12] Environmental Protection Agency (EPA Ghana), “Manual for the Preparation of District Waste Management Plans in Ghana, Best Practice Environmental Guidelines,” Se- ries No. 3, EPA, Accra, 2002. Copyright © 2012 SciRes. JWARP  F. K. NYAME ET AL. Copyright © 2012 SciRes. JWARP 633 diversity Studies in Three 999, pp. 147- Methods Eaton and M. A. H. Franson, “Standard Methods . W. Zwanziger and S. Geiss, “Chemom- [13] G. O. Kesse, “The Rocks and Mineral Resources of Ghana,” A. A. Balkema, Rotterdam, 1985. [14] J. Tigme, “Hydrochemistry of Leachate from Municipal Solid Waste Landfills in Accra,” M.Phil. Thesis, Univer- sity of Ghana, Accra, 2005. [15] G. O. Kesse, “The Rocks and Mineral Resources of Ghana,” A. A. Balkema, Rotterdam, 1985. [16] B. K. Dickson and G. Benneh, “A New Geography of Ghana,” Longmans Group Ltd., London, 2004. [17] A. A. Oteng-Yeboah, “Bio Coastal Wetlands in Ghana, West Africa,” Journal of the Ghana Science Association, Vol. 1, No. 3, 1 149. [18] A. D. Eaton and M. A. H. Franson, “Standard for the Examination of Water and Waste Water,” 20th Edition, American Public Health Association, Washing- ton DC, 1998. [19] A. D. for the Examination of Water and Waste Water,” 21st Edition, American Public Health Association, Washing- ton DC, 2005. [20] J. W. Eimax, H etrics in Environmental Analysis,” John Wiley & Sons, Inc., Weinheim, 1997. doi:10.1002/352760216X [21] J. W. Eimax, D. Truckenbrodt and O. Kampe, “River Pollution Data Interpreted by Means of Chemometric Methods,” Microchemical Journal, Vol. 58, No. 3, 1998, pp. 315-324. doi:10.1006/mchj.1997.1560 [22] World Health Organisation, “Guidelines for Drinking Water Quality,” 3rd Edition, World Health Organization, Geneva, 2004. [23] World Health Organisation (WHO)/United Nations En- vironment Programme (UNEP), 1997. [24] K. Mizumura, “Chloride Ion in Groundwater near Dis- posal of Solid Wastes in Landfills,” Journal of Hydro- logic Engineering, Vol. 8, No. 4, 2003, pp. 204-213. doi:10.1061/(ASCE)1084-0699(2003)8:4(204) [25] S. B. Akuffo, “Pollution Control in a Developing Econ- Vol. 107, omy: A Study of the Situation in Ghana,” 2nd Edition, Ghana University Press, Accra, 1998. [26] D. Taylor, “The Economic and Environmental Issue Landfill,” Environmental Health Perspectives, s of No. 8, 1999, pp. A404-A409. doi:10.1289/ehp.99107a404 [27] G. E. Combs Jr., “Geological Impacts on Nutrition,” In: O. Selinus, B. J. Alloway, J. A. Centeno, R. B. Finkelman , “Use of Landfill Leachate to Generate Electric- tml d C. M. Finlayson, “Re- tland Degradation,” En- . , R. Fuge, U. Lindh and P. Smedley, Eds., Essentials of Medical Geology, Elsevier Academic Press, London, 2005, p. 812. [28] M. Nordberg and M. G. Cherian, “Biological Responses of Elements,” In: O. Selinus, Ed., Essentials of Medical Geology—Impacts of the Natural Environment on Public Health, Elsevier Academic Press, Burlington, p. 812. [29] B. Frew ity in Microbial Fuel Cells,” 2006. http://hdl.handle.net/1811/6483 [30] T. A. Kurniawan, “Landfill Leachate: Persistent Threats to Aquatic Environment,” 2009. http://www.scitopics.com/Landfill_Leachate_Persistent_ Threats_to_Aquatic_Environment.h [31] R. A. Van Dam, C. Camilleri an view of the Potential of Rapid Assessment Techniques as Early Warning Indicators of We vironmental Toxicology and Water Quality, Vol. 13, No 4, 1998, pp. 297-312. doi:10.1002/(SICI)1098-2256(1998)13:4<297::AID-TOX 3>3.0.CO;2-2 [32] J. J. Kao, H. Y. Lin and W. Y. Chan, “Network Geo- graphic Information System for Landfill Siting,” Waste Management & Resear 253. [33] W. Stephens, S ch, Vol. 15, No. 3, 1997, pp. 239- . F Tyrrel and J.-E. Tiberghien, “Irrigating .1016/S0960-8524(00)00065-1 Short Rotation Coppice with Landfill Leachate: Con- straints to Productivity Due to Chloride,” Bioresource Technology, Vol. 75, No. 3, 2000, pp. 227-229. doi:10 S. Chan, “Physico- and G. Y. S. Chan, “Degra- 007, pp. 395-402. ., Ac- tion and Attenuation of Hazardous alyses of Soil 0/00103629009368332 [34] T. A. Kurniawan, W.-H. Lo and G. Y. S. Chan, “Radicals Catalyzed Oxidation of Recalcitrant Compounds from Landfill Leachate,” Chemical Engineering Journal, Vol. 125, No. 1, 2006, pp. 35-57. [35] T. A. Kurniawan, W. H. Lo and G. Y. Chemical Treatments for Removal of Recalcitrant Con- taminants from Landfill Leachate,” Journal of Hazardous Materials, Vol. 129, No. 1-3, 2006, pp. 80-100. [36] T. A. Kurniawan, W. H. Lo dation of Recalcitrant Compounds from Stabilized Land- fill Leachate Using a Combination of Ozone-GAC Ab- sorption Treatment,” Journal of Haza rdous Materials , Vol. 137, No. 1, 2006, pp. 443-455. [37] O. R. Ogri, N. N. Tabe and M. E. Eja, “Trace Metals and Hydrocarbon Levels in Soil and Biota of a Seasonal Wet- land Drained by Municipal Run-Off from Calabar, Cross River State, Nigeria,” Global Journal of Pure and Ap- plied Sciences, Vol. 13, No. 3, 2 [38] A. O. Adjei, “The Structural Geology and Petrology of the Awudome-Abutia Area,” M.Sc. Thesis, University of Ghana, Accra, 1968. [39] S. M. Ahmed, P. K. Blay, S. B. Castor and G. J. Coakley, “Geology of Field Sheets 33, 59, 61. Winneba N.W cra S.W. and N.E., Respectively,” Bulletin of the Ghana Geological Survey, No. 32, 1977, pp. 8-33. [40] T. Assmuth, “Distribu Substances in Uncontrolled Solid Waste Landfills,” Waste Management & Research, Vol. 10, No. 3, 1992, pp. 235-255. [41] D. A. Tel and C. Heseltine, “Chloride An Leachate Using the TRAACS 800 Analyzer,” Communi- cations in Soil Science and Plant Analysis, Vol. 21, No. 13-16, 1990, pp. 1689-1693. doi:10.108 7)133:6(659) [42] K. Haarstad and T. Maehlum “Electrical Conductivity and Chloride Reduction in Leachate Treatment Systems,” Journal of Environmental Engineering, Vol. 133, No. 6, 2007, pp. 659-664. doi:10.1061/(ASCE)0733-9372(200
|