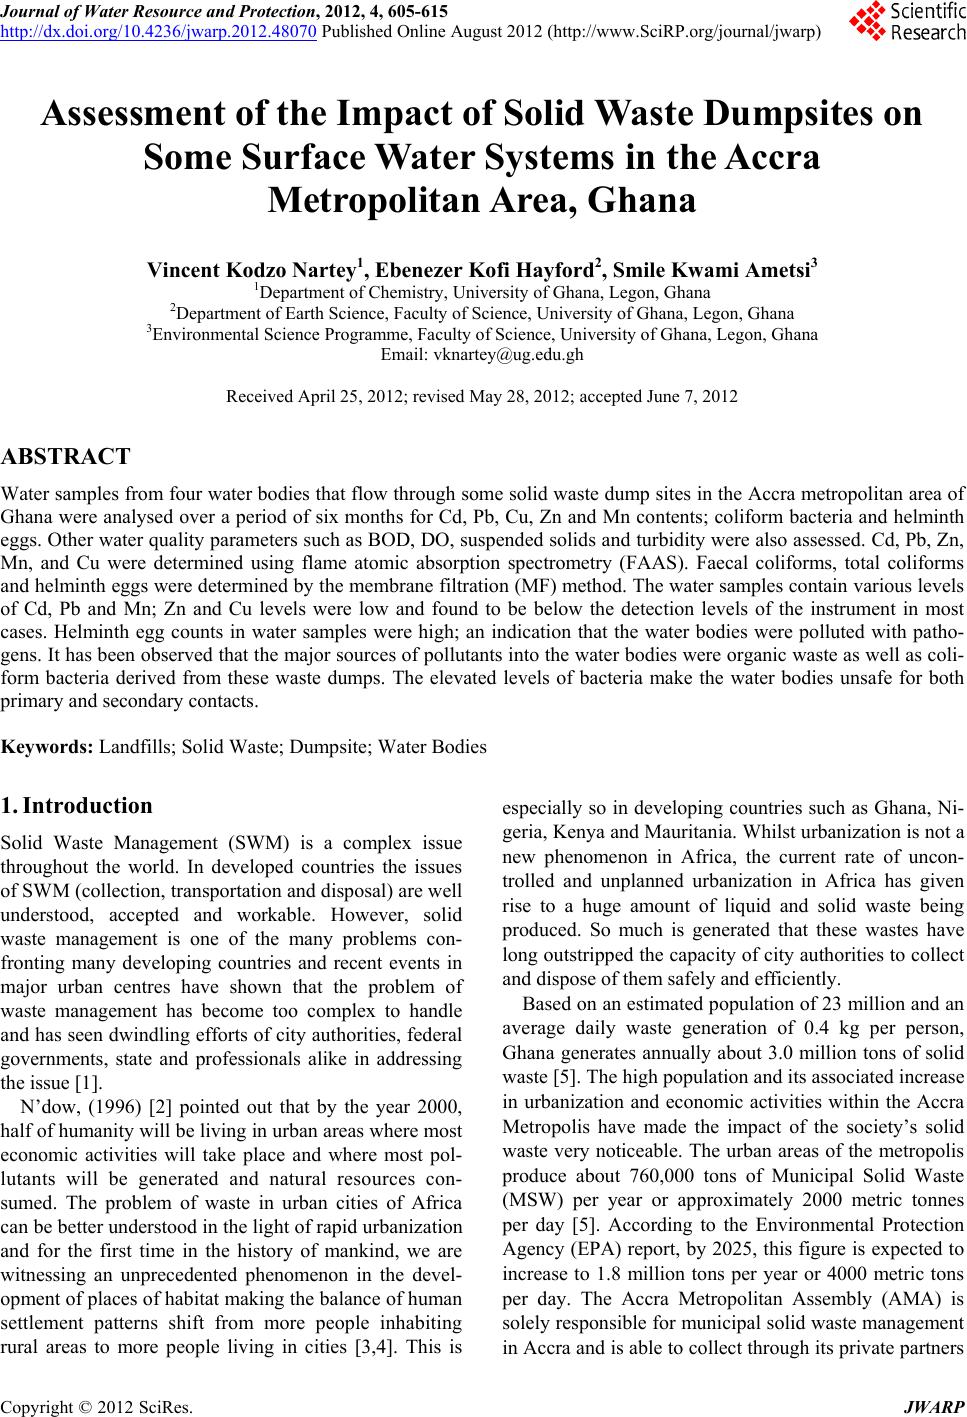
 Journal of Water Resource and Protection, 2012, 4, 605-615 http://dx.doi.org/10.4236/jwarp.2012.48070 Published Online August 2012 (http://www.SciRP.org/journal/jwarp) Assessment of the Impact of Solid Waste Dumpsites on Some Surface Water Systems in the Accra Metropolitan Area, Ghana Vincent Kodzo Nartey1, Ebenezer Kofi Hayford2, Smile Kwami Ametsi3 1Department of Chemistry, University of Ghana, Legon, Ghana 2Department of Earth Science, Faculty of Science, University of Ghana, Legon, Ghana 3Environmental Science Programme, Faculty of Science, University of Ghana, Legon, Ghana Email: vknartey@ug.edu.gh Received April 25, 2012; revised May 28, 2012; accepted June 7, 2012 ABSTRACT Water samples from four water bodies that flow through some solid waste dump sites in the Accra metropolitan area of Ghana were analysed over a period of six months for Cd, Pb, Cu, Zn and Mn contents; coliform bacteria and helminth eggs. Other water quality parameters such as BOD, DO, suspended solids and turbidity were also assessed. Cd, Pb, Zn, Mn, and Cu were determined using flame atomic absorption spectrometry (FAAS). Faecal coliforms, total coliforms and helminth eggs were determined by the membrane filtration (MF) method. The water samples contain various levels of Cd, Pb and Mn; Zn and Cu levels were low and found to be below the detection levels of the instrument in most cases. Helminth egg counts in water samples were high; an indication that the water bodies were polluted with patho- gens. It has been observed that the major sources of pollutants into the water bodies were organic waste as well as coli- form bacteria derived from these waste dumps. The elevated levels of bacteria make the water bodies unsafe for both primary and secondary contacts. Keywords: Landfills; Solid Waste; Dumpsite; Water Bodies 1. Introduction Solid Waste Management (SWM) is a complex issue throughout the world. In developed countries the issues of SWM (collection, transportation and disposal) are well understood, accepted and workable. However, solid waste management is one of the many problems con- fronting many developing countries and recent events in major urban centres have shown that the problem of waste management has become too complex to handle and has seen dwindling efforts of city authorities, federal governments, state and professionals alike in addressing the issue [1]. N’dow, (1996) [2] pointed out that by the year 2000, half of humanity will be living in urban areas where most economic activities will take place and where most pol- lutants will be generated and natural resources con- sumed. The problem of waste in urban cities of Africa can be better understood in the light of rapid urbanization and for the first time in the history of mankind, we are witnessing an unprecedented phenomenon in the devel- opment of places of habitat making the balance of human settlement patterns shift from more people inhabiting rural areas to more people living in cities [3,4]. This is especially so in developing countries such as Ghana, Ni- geria, Kenya and Mauritania. Whilst urbanization is not a new phenomenon in Africa, the current rate of uncon- trolled and unplanned urbanization in Africa has given rise to a huge amount of liquid and solid waste being produced. So much is generated that these wastes have long outstripped the capacity of city authorities to collect and dispose of them safely and efficiently. Based on an estimated population of 23 million and an average daily waste generation of 0.4 kg per person, Ghana generates annually about 3.0 million tons of solid waste [5]. The high population and its associated increase in urbanization and economic activities within the Accra Metropolis have made the impact of the society’s solid waste very noticeable. The urban areas of the metropolis produce about 760,000 tons of Municipal Solid Waste (MSW) per year or approximately 2000 metric tonnes per day [5]. According to the Environmental Protection Agency (EPA) report, by 2025, this figure is expected to increase to 1.8 million tons per year or 4000 metric tons per day. The Accra Metropolitan Assembly (AMA) is solely responsible for municipal solid waste management in Accra and is able to collect through its private partners C opyright © 2012 SciRes. JWARP 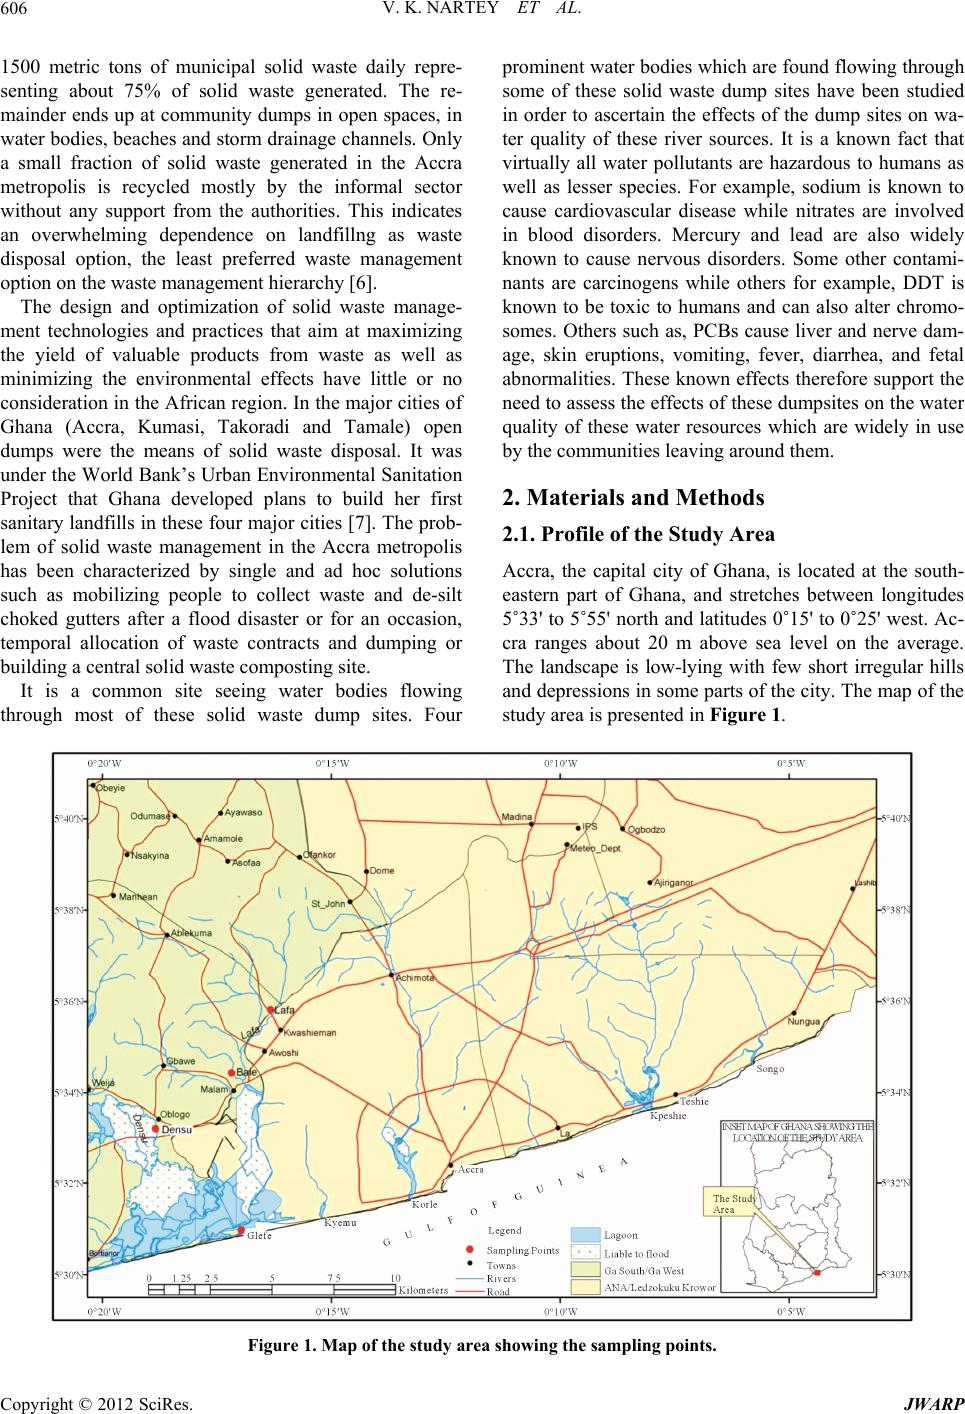 V. K. NARTEY ET AL. 606 1500 metric tons of municipal solid waste daily repre- senting about 75% of solid waste generated. The re- mainder ends up at community dumps in open spaces, in water bodies, beaches and storm drainage channels. Only a small fraction of solid waste generated in the Accra metropolis is recycled mostly by the informal sector without any support from the authorities. This indicates an overwhelming dependence on landfillng as waste disposal option, the least preferred waste management option on the waste management hierarchy [6]. The design and optimization of solid waste manage- ment technologies and practices that aim at maximizing the yield of valuable products from waste as well as minimizing the environmental effects have little or no consideration in the African region. In the major cities of Ghana (Accra, Kumasi, Takoradi and Tamale) open dumps were the means of solid waste disposal. It was under the World Bank’s Urban Environmental Sanitation Project that Ghana developed plans to build her first sanitary landfills in these four major cities [7]. The prob- lem of solid waste management in the Accra metropolis has been characterized by single and ad hoc solutions such as mobilizing people to collect waste and de-silt choked gutters after a flood disaster or for an occasion, temporal allocation of waste contracts and dumping or building a central solid waste composting site. It is a common site seeing water bodies flowing through most of these solid waste dump sites. Four prominent water bodies which are found flowing through some of these solid waste dump sites have been studied in order to ascertain the effects of the dump sites on wa- ter quality of these river sources. It is a known fact that virtually all water pollutants are hazardous to humans as well as lesser species. For example, sodium is known to cause cardiovascular disease while nitrates are involved in blood disorders. Mercury and lead are also widely known to cause nervous disorders. Some other contami- nants are carcinogens while others for example, DDT is known to be toxic to humans and can also alter chromo- somes. Others such as, PCBs cause liver and nerve dam- age, skin eruptions, vomiting, fever, diarrhea, and fetal abnormalities. These known effects therefore support the need to assess the effects of these dumpsites on the water quality of these water resources which are widely in use by the communities leaving around them. 2. Materials and Methods 2.1. Profile of the Study Area Accra, the capital city of Ghana, is located at the south- eastern part of Ghana, and stretches between longitudes 5˚33' to 5˚55' north and latitudes 0˚15' to 0˚25' west. Ac- cra ranges about 20 m above sea level on the average. The landscape is low-lying with few short irregular hills and depressions in some parts of the city. The map of the study area is presented in Figure 1. Figure 1. Map of the study area showing the sampling points. Copyright © 2012 SciRes. JWARP  V. K. NARTEY ET AL. 607 Accra has four major drainage catchment systems. The Densu River and Sakumo Lagoon catchment drains set- tlements like, Dansoman, Kwashieman, McCarthy Hill and Awoshie areas. The Korle-Chemu catchment basin covers an area of 250 km2. The Odaw River is the main stream in this system with Nima, Onyasia, Dakobi and Ado as tributaries. The Kpeshie catchment drainage ba- sin covers an area of 110 km2 and drains settlements like Cantonments, Osu, Labadi and Burma camp. The Songo- Mokwe catchment covers about 50 km2, and drains Teshie. 2.2. Vegetation and Soils The vegetation consists mainly of coastal-savanna grass- lands, shrubs and some few mangroves in isolated areas. Market gardening is practiced in few places particularly along major waterways where irrigation is possible to support all-year round farming. Vegetables like pepper, okra, cabbage, lettuce, onion and cereals like maize are the main crops cultivated [8]. The geological formations consist mainly of the Pre- cambrian Dahomeyan schist, granodiorites, granites gneiss and amphibolites and the Precambrian Togo series. The underground water table ranges between 4.80 metres to 70 metres. The main soil types include; Drift materials from wind-blown erosion, alluvial and marine mottled clays, residual clays and gravels from weathered quartz- ite, gneiss and schist rocks and lateritic sandy clay soils. 2.3. Collection of Water Samples Sampling of water from the study area was done over a period of six months (June-November, 2009). Wet sea- son samples were obtained in June, July and August while dry season samples were collected in September, October and November. The locations of the sampling sites were established using a Garmin 45 Ground Posi- tioning System (GPS). The geographical locations, site elevations and types of samples collected from each sampling site are presented on Table 1. At each sampling point, two sets of water samples were collected into separate pre-cleaned 1 L polyethylene bottles. 2.0 mL of concentrated HNO3 was added to one Table 1. Surface water bodies sampled and their locations. Surface Water Bodies Sample Site Locations Lafa 05º35.821′N; 00º16.301′W Bale 05º34.372′N; 00º17.338′W Densu (Oblogo) 05º33.493′N; 00º18.813′W Gbegbe Lagoon (Glefe) 05º40.355′N; 00º09.594′W Source: field survey, 2009. of the bottles. The acidified sample was used for ele- mental analysis [9]. The non-acidified sample was ana- lyzed for biological characteristics. Collected samples were stored in a cooler containing ice cubes, and later transported to the laboratory at the Department of Chem- istry, University of Ghana, Legon, for analysis. At the laboratory, samples were stored in refrigerators at 4˚C until analysis. 2.4. Apparatus and AAS Measurement Conditions An atomic absorption spectrometer (Analyst 400, Perkin Elmer) was used for the determination of the concentra- tions of Cd, Pb, Zn, Mn and Cu. Boosted Cd, Pb, Zn, Mn and Cu hollow cathode Superlamps (Photron, Australia) were employed as radiation sources. The operating con- ditions of the spectrometer for the determination of Cd, Pb, Zn, Mn and Cu are presented in Table 2. 2.5. Chemicals, Reagents, and Standards HNO3 (Merck, Germany); H2O2 (30%, Merck, Germany), were used for mineralization of the samples. Standard stock metal solutions were prepared from Cd stock stan- dard solution (1000 mg/L in 2.0% HNO3, TraceCERT®, Fluka, Switzerland), Pb stock standard solution (1000 mg/L in 2.0% HNO3, TraceCERT®, Fluka, Switzerland), Mn stock standard solution (1000 mg/L in 2.0% HNO3, TraceCERT®, Fluka, Switzerland), Cu stock standard solution (1000 mg/L in 2.0% HNO3, TraceCERT®, Fluka, Switzerland), and Zn stock standard solution (999 mg/L in 1.4% HNO3, Teknolab AB, Sweden) respectively. For all dilutions, demineralized redistilled water was utilized. Calibration curves were developed by using cali- brants prepared by appropriate dilution of the 1.0 g·L–1 Table 2. The AAS operating parameters for the five ele- ments determined. Element Operating conditions Wavelength slit width lamp current Flame (nm)(nm)(mA)Fuel Oxidant (Flow rate: 2 L·min–1) (Flow rate: 13.5 L·min–1) Cd228.80.54 Acetylene Air Pb 217.0 1.05 Acetylene Air Zn 213.91.0 5 Acetylene Air Mn279.50.25 Acetylene Air Cu324.80.54 Acetylene Air Detection limits for the five elements: Cd: 2.0 µg/l; Pb: 3.0 µg/l; Zn: 2.0 µg/l; Mn: 3.0 µg/l; Cu: 4.0 µg/l. Copyright © 2012 SciRes. JWARP  V. K. NARTEY ET AL. 608 stock solutions to the required concentration with 2.0% HNO3. The working standard metal solutions were pre- pared daily. 2.6. Cd, Pb, Zn, Mn, and Cu Measurements by AAS Determination of metals in the acidified filtered (0.45 µm Millipore filter) water samples were carried out in ac- cordance with standard methods [10,11]. The concentra- tions of Cd, Pb, Zn, Mn and Cu in the samples were re- spectively estimated by comparison with either the re- spective calibration curve or by the standard addition technique. 2.7. Physical and Chemical Measurements Temperature, pH and dissolved oxygen were measured in-situ and recorded at the sampling sites. Nitrates, phosphates and physical parameters such as Biochemical Oxygen Demand (BOD5), turbidity and suspended solids were also determined using standard methods [12]. 2.8. Determination of Biological Characteristics Total coliforms and Faecal coliforms were determined by membrane filtration method using M-Endo-Agar at 37˚C and on MFC Agar at 44˚C ± 0.5˚C for 48 hours, respec- tively. All species of helminth eggs in water samples were quantified using the concentration method [13]. The identities of the specific helminth eggs were established using the World Health Organization (WHO) bench aid for the diagnosis of intestinal parasites [14]. 3. Results and Discussions 3.1. Physical Parameters The physical parameters of water quality can be broken down into many topics and one needs to take into con- sideration the nature of the physical parameters of the ecosystem surrounding a water source to be able to un- derstand the physical appearance of water. Physical pa- rameters which usually determine water quality are con sidered below. 3.1.1. Te mperature of Water Temperature affects sediment and microbial growth among other characteristics of water and it is also a known fact that the rate at which chemical reactions oc- cur increase with increasing temperature and the rate of biochemical reactions usually double for every 10.0˚C rise in temperature. Physically, less oxygen can dissolve in warm water than in cold water. This is because in- creased temperature decreases the solubility of gases in water. Increased temperature increases respiration lead- ing to increased oxygen consumption and increased de- composition of organic matter [15]. It is for these reasons that the temperatures of the water samples were deter- mined for the river systems. The mean seasonal water temperature ranged from 27.4˚C at Glefe to 31.1˚C at Lafa in the wet season, Table 3 and 27.4˚C at Bale to 28.7˚C at Glefe in the dry season, Table 3. Since water temperature affects the concentration of biological, physical, and chemical constituents of water, the relatively high temperatures recorded would speed up the decomposition of organic matter in the water. Hence, population of bacteria and phytoplankton would double in warm weather in a very short time [16]. 3.1.2. p H of Water pH is important in water quality assessment as it influ- ences many biological and chemical processes within a water body [16]. The pH values recorded were slightly alkaline with little variations among the study sites. The seasonal mean values ranged from 7.64 at Lafa to 8.06 at Glefe in the wet season, Table 2 and 7.60 at Lafa to 7.74 at Bale in the dry season, Table 4. The mean values fell within the WHO acceptable lim- its of 6.5 - 8.5 except at Glefe. The high pH value at Glefe is probably due to the direct disposal of refuse into the lagoon and also to sea water intrusion. However, most of the sampled sites had pH values slightly higher than natural background level of 7 for tropical surface water. It is a known fact that variations in pH affect chemical and biological processes in water and low pH increases the availability of metals and other toxins for intake by aquatic life. On the other hand, the slightly high alkaline pH values recorded at the study sites would tend to de- crease the availability of metals and other toxins for in- Table 3. Physico-chemical characteristics of water samples for rainy season. Sampling sites/Mean levels of parameters Parameters Bale Densu LafaGlefe Temp. (˚C) 27.4 27.7 28.228.7 pH 7.7 7.8 7.67.6 Dissolved Oxygen (mg/l) 6.0 5.5 4.84.2 Biological Oxygen Demand (mg/l) 3.6 4.3 3.43.1 Suspended Solids (mg/l) 50.0 47.3 48.351.7 Turbidity (n.t.u) 33.6 39.9 32.043.4 Nitrate (mg/l) 2.1 2.2 2.22.0 Phosphate (mg/l) 0.4 0.2 0.20.3 Copyright © 2012 SciRes. JWARP 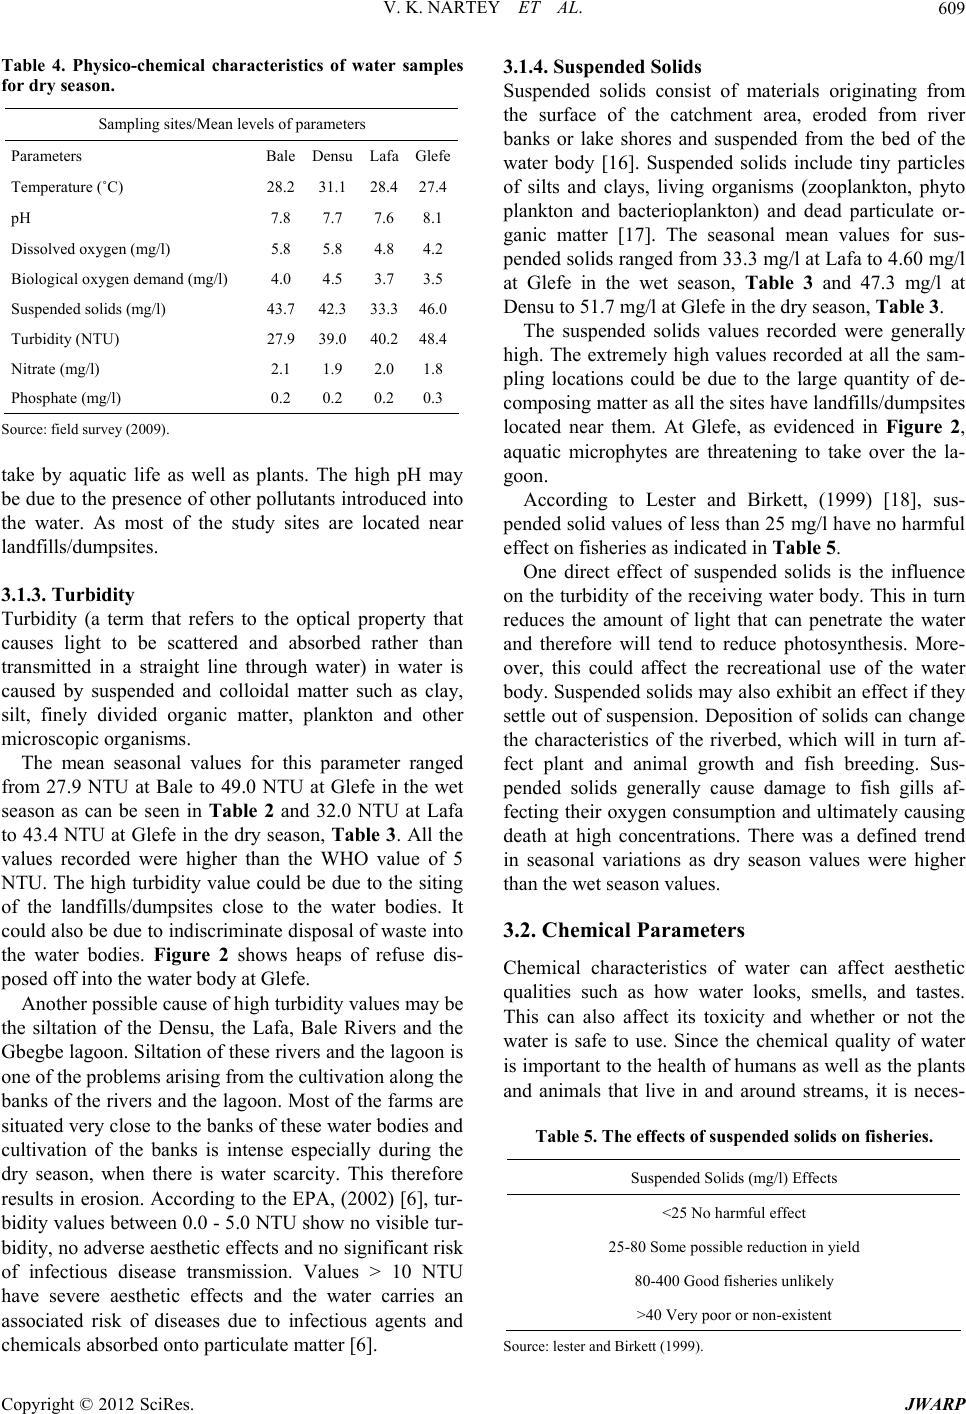 V. K. NARTEY ET AL. 609 Table 4. Physico-chemical characteristics of water samples for dry season. Sampling sites/Mean levels of parameters Parameters Bale Densu Lafa Glefe Temperature (˚C) 28.2 31.1 28.427.4 pH 7.8 7.7 7.68.1 Dissolved oxygen (mg/l) 5.8 5.8 4.84.2 Biological oxygen demand (mg/l) 4.0 4.5 3.73.5 Suspended solids (mg/l) 43.7 42.3 33.346.0 Turbidity (NTU) 27.9 39.0 40.248.4 Nitrate (mg/l) 2.1 1.9 2.01.8 Phosphate (mg/l) 0.2 0.2 0.20.3 Source: field survey (2009). take by aquatic life as well as plants. The high pH may be due to the presence of other pollutants introduced into the water. As most of the study sites are located near landfills/dumpsites. 3.1.3. Turbidity Turbidity (a term that refers to the optical property that causes light to be scattered and absorbed rather than transmitted in a straight line through water) in water is caused by suspended and colloidal matter such as clay, silt, finely divided organic matter, plankton and other microscopic organisms. The mean seasonal values for this parameter ranged from 27.9 NTU at Bale to 49.0 NTU at Glefe in the wet season as can be seen in Table 2 and 32.0 NTU at Lafa to 43.4 NTU at Glefe in the dry season, Table 3. All the values recorded were higher than the WHO value of 5 NTU. The high turbidity value could be due to the siting of the landfills/dumpsites close to the water bodies. It could also be due to indiscriminate disposal of waste into the water bodies. Figure 2 shows heaps of refuse dis- posed off into the water body at Glefe. Another possible cause of high turbidity values may be the siltation of the Densu, the Lafa, Bale Rivers and the Gbegbe lagoon. Siltation of these rivers and the lagoon is one of the problems arising from the cultivation along the banks of the rivers and the lagoon. Most of the farms are situated very close to the banks of these water bodies and cultivation of the banks is intense especially during the dry season, when there is water scarcity. This therefore results in erosion. According to the EPA, (2002) [6], tur- bidity values between 0.0 - 5.0 NTU show no visible tur- bidity, no adverse aesthetic effects and no significant risk of infectious disease transmission. Values ˃ 10 NTU have severe aesthetic effects and the water carries an associated risk of diseases due to infectious agents and chemicals absorbed onto particulate matter [6]. 3.1.4. S u s p ended Sol i d s Suspended solids consist of materials originating from the surface of the catchment area, eroded from river banks or lake shores and suspended from the bed of the water body [16]. Suspended solids include tiny particles of silts and clays, living organisms (zooplankton, phyto plankton and bacterioplankton) and dead particulate or- ganic matter [17]. The seasonal mean values for sus- pended solids ranged from 33.3 mg/l at Lafa to 4.60 mg/l at Glefe in the wet season, Table 3 and 47.3 mg/l at Densu to 51.7 mg/l at Glefe in the dry season, Table 3. The suspended solids values recorded were generally high. The extremely high values recorded at all the sam- pling locations could be due to the large quantity of de- composing matter as all the sites have landfills/dumpsites located near them. At Glefe, as evidenced in Figure 2, aquatic microphytes are threatening to take over the la- goon. According to Lester and Birkett, (1999) [18], sus- pended solid values of less than 25 mg/l have no harmful effect on fisheries as indicated in Table 5. One direct effect of suspended solids is the influence on the turbidity of the receiving water body. This in turn reduces the amount of light that can penetrate the water and therefore will tend to reduce photosynthesis. More- over, this could affect the recreational use of the water body. Suspended solids may also exhibit an effect if they settle out of suspension. Deposition of solids can change the characteristics of the riverbed, which will in turn af- fect plant and animal growth and fish breeding. Sus- pended solids generally cause damage to fish gills af- fecting their oxygen consumption and ultimately causing death at high concentrations. There was a defined trend in seasonal variations as dry season values were higher than the wet season values. 3.2. Chemical Parameters Chemical characteristics of water can affect aesthetic qualities such as how water looks, smells, and tastes. This can also affect its toxicity and whether or not the water is safe to use. Since the chemical quality of water is important to the health of humans as well as the plants and animals that live in and around streams, it is neces- Table 5. The effects of suspended solids on fisheries. Suspended Solids (mg/l) Effects ˂25 No harmful effect 25-80 Some possible reduction in yield 80-400 Good fisheries unlikely ˃40 Very poor or non-existent Source: lester and Birkett (1999). Copyright © 2012 SciRes. JWARP 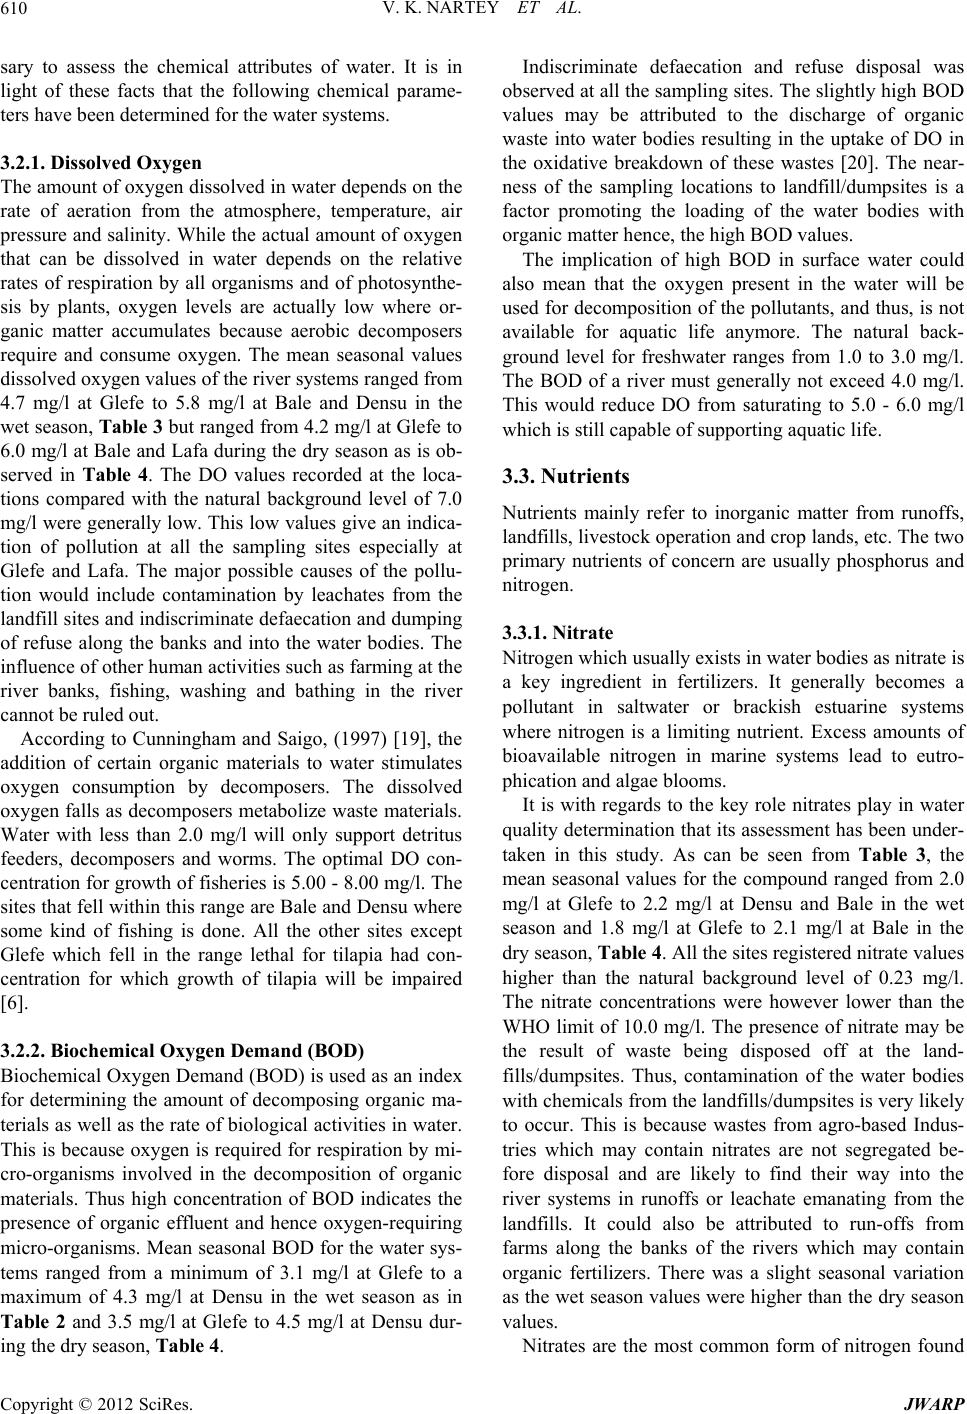 V. K. NARTEY ET AL. 610 sary to assess the chemical attributes of water. It is in light of these facts that the following chemical parame- ters have been determined for the water systems. 3.2.1. Di ssolved O xygen The amount of oxygen dissolved in water depends on the rate of aeration from the atmosphere, temperature, air pressure and salinity. While the actual amount of oxygen that can be dissolved in water depends on the relative rates of respiration by all organisms and of photosynthe- sis by plants, oxygen levels are actually low where or- ganic matter accumulates because aerobic decomposers require and consume oxygen. The mean seasonal values dissolved oxygen values of the river systems ranged from 4.7 mg/l at Glefe to 5.8 mg/l at Bale and Densu in the wet season, Table 3 but ranged from 4.2 mg/l at Glefe to 6.0 mg/l at Bale and Lafa during the dry season as is ob- served in Table 4. The DO values recorded at the loca- tions compared with the natural background level of 7.0 mg/l were generally low. This low values give an indica- tion of pollution at all the sampling sites especially at Glefe and Lafa. The major possible causes of the pollu- tion would include contamination by leachates from the landfill sites and indiscriminate defaecation and dumping of refuse along the banks and into the water bodies. The influence of other human activities such as farming at the river banks, fishing, washing and bathing in the river cannot be ruled out. According to Cunningham and Saigo, (1997) [19], the addition of certain organic materials to water stimulates oxygen consumption by decomposers. The dissolved oxygen falls as decomposers metabolize waste materials. Water with less than 2.0 mg/l will only support detritus feeders, decomposers and worms. The optimal DO con- centration for growth of fisheries is 5.00 - 8.00 mg/l. The sites that fell within this range are Bale and Densu where some kind of fishing is done. All the other sites except Glefe which fell in the range lethal for tilapia had con- centration for which growth of tilapia will be impaired [6]. 3.2.2. Biochemical Oxygen Demand (BOD) Biochemical Oxygen Demand (BOD) is used as an index for determining the amount of decomposing organic ma- terials as well as the rate of biological activities in water. This is because oxygen is required for respiration by mi- cro-organisms involved in the decomposition of organic materials. Thus high concentration of BOD indicates the presence of organic effluent and hence oxygen-requiring micro-organisms. Mean seasonal BOD for the water sys- tems ranged from a minimum of 3.1 mg/l at Glefe to a maximum of 4.3 mg/l at Densu in the wet season as in Table 2 and 3.5 mg/l at Glefe to 4.5 mg/l at Densu dur- ing the dry season, Table 4. Indiscriminate defaecation and refuse disposal was observed at all the sampling sites. The slightly high BOD values may be attributed to the discharge of organic waste into water bodies resulting in the uptake of DO in the oxidative breakdown of these wastes [20]. The near- ness of the sampling locations to landfill/dumpsites is a factor promoting the loading of the water bodies with organic matter hence, the high BOD values. The implication of high BOD in surface water could also mean that the oxygen present in the water will be used for decomposition of the pollutants, and thus, is not available for aquatic life anymore. The natural back- ground level for freshwater ranges from 1.0 to 3.0 mg/l. The BOD of a river must generally not exceed 4.0 mg/l. This would reduce DO from saturating to 5.0 - 6.0 mg/l which is still capable of supporting aquatic life. 3.3. Nutrients Nutrients mainly refer to inorganic matter from runoffs, landfills, livestock operation and crop lands, etc. The two primary nutrients of concern are usually phosphorus and nitrogen. 3.3.1. Nitrate Nitrogen which usually exists in water bodies as nitrate is a key ingredient in fertilizers. It generally becomes a pollutant in saltwater or brackish estuarine systems where nitrogen is a limiting nutrient. Excess amounts of bioavailable nitrogen in marine systems lead to eutro- phication and algae blooms. It is with regards to the key role nitrates play in water quality determination that its assessment has been under- taken in this study. As can be seen from Table 3, the mean seasonal values for the compound ranged from 2.0 mg/l at Glefe to 2.2 mg/l at Densu and Bale in the wet season and 1.8 mg/l at Glefe to 2.1 mg/l at Bale in the dry season, Table 4. All the sites registered nitrate values higher than the natural background level of 0.23 mg/l. The nitrate concentrations were however lower than the WHO limit of 10.0 mg/l. The presence of nitrate may be the result of waste being disposed off at the land- fills/dumpsites. Thus, contamination of the water bodies with chemicals from the landfills/dumpsites is very likely to occur. This is because wastes from agro-based Indus- tries which may contain nitrates are not segregated be- fore disposal and are likely to find their way into the river systems in runoffs or leachate emanating from the landfills. It could also be attributed to run-offs from farms along the banks of the rivers which may contain organic fertilizers. There was a slight seasonal variation as the wet season values were higher than the dry season values. Nitrates are the most common form of nitrogen found Copyright © 2012 SciRes. JWARP 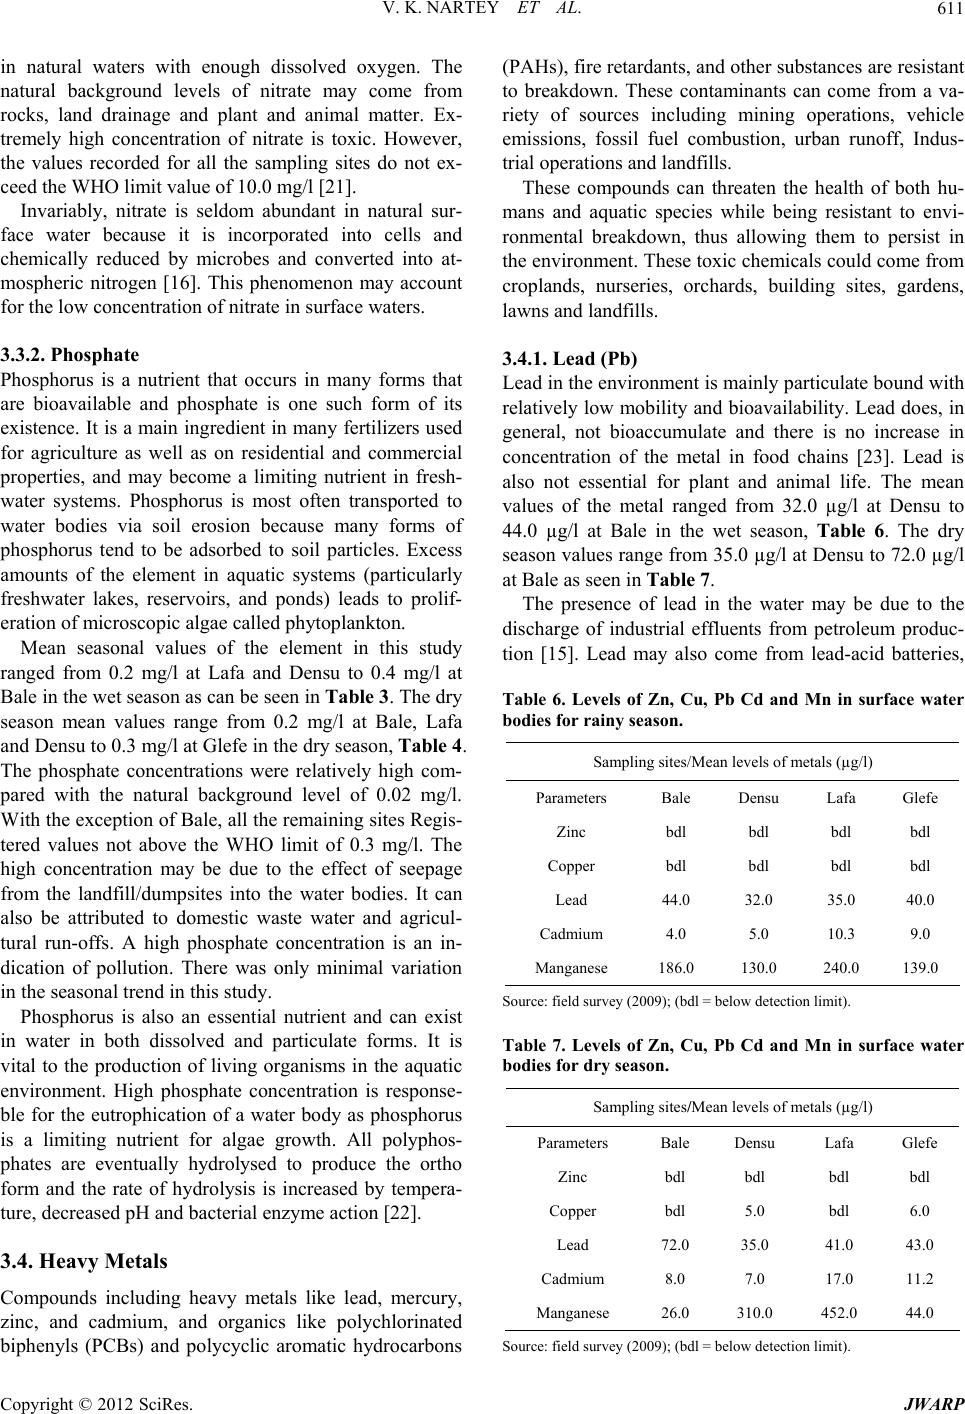 V. K. NARTEY ET AL. 611 in natural waters with enough dissolved oxygen. The natural background levels of nitrate may come from rocks, land drainage and plant and animal matter. Ex- tremely high concentration of nitrate is toxic. However, the values recorded for all the sampling sites do not ex- ceed the WHO limit value of 10.0 mg/l [21]. Invariably, nitrate is seldom abundant in natural sur- face water because it is incorporated into cells and chemically reduced by microbes and converted into at- mospheric nitrogen [16]. This phenomenon may account for the low concentration of nitrate in surface waters. 3.3.2. Phosphate Phosphorus is a nutrient that occurs in many forms that are bioavailable and phosphate is one such form of its existence. It is a main ingredient in many fertilizers used for agriculture as well as on residential and commercial properties, and may become a limiting nutrient in fresh- water systems. Phosphorus is most often transported to water bodies via soil erosion because many forms of phosphorus tend to be adsorbed to soil particles. Excess amounts of the element in aquatic systems (particularly freshwater lakes, reservoirs, and ponds) leads to prolif- eration of microscopic algae called phytoplankton. Mean seasonal values of the element in this study ranged from 0.2 mg/l at Lafa and Densu to 0.4 mg/l at Bale in the wet season as can be seen in Table 3 . The dry season mean values range from 0.2 mg/l at Bale, Lafa and Densu to 0.3 mg/l at Glefe in the dry season, Table 4. The phosphate concentrations were relatively high com- pared with the natural background level of 0.02 mg/l. With the exception of Bale, all the remaining sites Regis- tered values not above the WHO limit of 0.3 mg/l. The high concentration may be due to the effect of seepage from the landfill/dumpsites into the water bodies. It can also be attributed to domestic waste water and agricul- tural run-offs. A high phosphate concentration is an in- dication of pollution. There was only minimal variation in the seasonal trend in this study. Phosphorus is also an essential nutrient and can exist in water in both dissolved and particulate forms. It is vital to the production of living organisms in the aquatic environment. High phosphate concentration is response- ble for the eutrophication of a water body as phosphorus is a limiting nutrient for algae growth. All polyphos- phates are eventually hydrolysed to produce the ortho form and the rate of hydrolysis is increased by tempera- ture, decreased pH and bacterial enzyme action [22]. 3.4. Heavy Metals Compounds including heavy metals like lead, mer c u r y, zinc, and cadmium, and organics like polychlorinated biphenyls (PCBs) and polycyclic aromatic hydrocarbons (PAHs), fire retardants, and other substances are resistant to breakdown. These contaminants can come from a va- riety of sources including mining operations, vehicle emissions, fossil fuel combustion, urban runoff, Indus- trial operations and landfills. These compounds can threaten the health of both hu- mans and aquatic species while being resistant to envi- ronmental breakdown, thus allowing them to persist in the environment. These toxic chemicals could come from croplands, nurseries, orchards, building sites, gardens, lawns and landfills. 3.4.1. Lead (Pb) Lead in the environment is mainly particulate bound with relatively low mobility and bioavailability. Lead does, in general, not bioaccumulate and there is no increase in concentration of the metal in food chains [23]. Lead is also not essential for plant and animal life. The mean values of the metal ranged from 32.0 µg/l at Densu to 44.0 µg/l at Bale in the wet season, Table 6. The dry season values range from 35.0 µg/l at Densu to 72.0 µg/l at Bale as seen in Table 7. The presence of lead in the water may be due to the discharge of industrial effluents from petroleum produc- tion [15]. Lead may also come from lead-acid batteries, Table 6. Levels of Zn, Cu, Pb Cd and Mn in surface water bodies for rainy season. Sampling sites/Mean levels of metals (µg/l) Parameters Bale Densu Lafa Glefe Zinc bdl bdl bdl bdl Copper bdl bdl bdl bdl Lead 44.0 32.0 35.0 40.0 Cadmium 4.0 5.0 10.3 9.0 Manganese 186.0 130.0 240.0 139.0 Source: field survey (2009); (bdl = below detection limit). Table 7. Levels of Zn, Cu, Pb Cd and Mn in surface water bodies for dry season. Sampling sites/Mean levels of metals (µg/l) Parameters Bale Densu Lafa Glefe Zinc bdl bdl bdl bdl Copper bdl 5.0 bdl 6.0 Lead 72.0 35.0 41.0 43.0 Cadmium 8.0 7.0 17.0 11.2 Manganese 26.0 310.0 452.0 44.0 Source: field survey (2009); (bdl = below detection limit). Copyright © 2012 SciRes. JWARP 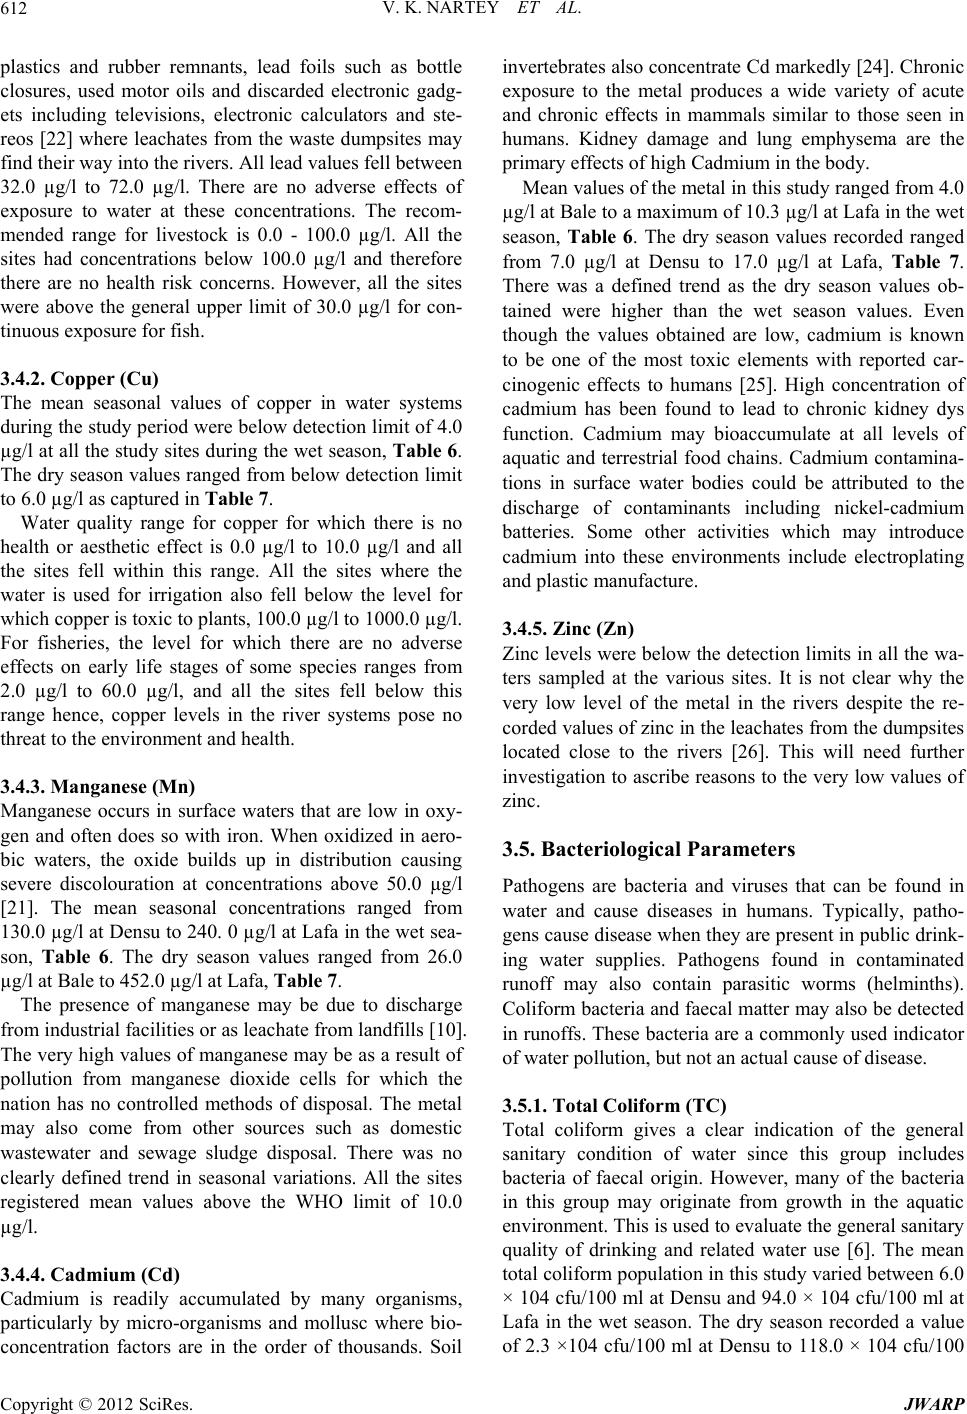 V. K. NARTEY ET AL. 612 plastics and rubber remnants, lead foils such as bottle closures, used motor oils and discarded electronic gadg- ets including televisions, electronic calculators and ste- reos [22] where leachates from the waste dumpsites may find their way into the rivers. All lead values fell between 32.0 µg/l to 72.0 µg/l. There are no adverse effects of exposure to water at these concentrations. The recom- mended range for livestock is 0.0 - 100.0 µg/l. All the sites had concentrations below 100.0 µg/l and therefore there are no health risk concerns. However, all the sites were above the general upper limit of 30.0 µg/l for con- tinuous exposure for fish. 3.4.2. C op per (Cu) The mean seasonal values of copper in water systems during the study period were below detection limit of 4.0 µg/l at all the study sites during the wet season, Table 6. The dry season values ranged from below detection limit to 6.0 µg/l as captured in Table 7. Water quality range for copper for which there is no health or aesthetic effect is 0.0 µg/l to 10.0 µg/l and all the sites fell within this range. All the sites where the water is used for irrigation also fell below the level for which copper is toxic to plants, 100.0 µg/l to 1000.0 µg/l. For fisheries, the level for which there are no adverse effects on early life stages of some species ranges from 2.0 µg/l to 60.0 µg/l, and all the sites fell below this range hence, copper levels in the river systems pose no threat to the environment and health. 3.4.3. Manga nese (Mn) Manganese occurs in surface waters that are low in oxy- gen and often does so with iron. When oxidized in aero- bic waters, the oxide builds up in distribution causing severe discolouration at concentrations above 50.0 µg/l [21]. The mean seasonal concentrations ranged from 130.0 µg/l at Densu to 240. 0 µg/l at Lafa in the wet sea- son, Table 6. The dry season values ranged from 26.0 µg/l at Bale to 452.0 µg/l at Lafa, Table 7. The presence of manganese may be due to discharge from industrial facilities or as leachate from landfills [10]. The very high values of manganese may be as a result of pollution from manganese dioxide cells for which the nation has no controlled methods of disposal. The metal may also come from other sources such as domestic wastewater and sewage sludge disposal. There was no clearly defined trend in seasonal variations. All the sites registered mean values above the WHO limit of 10.0 µg/l. 3.4.4. Cadmium (Cd) Cadmium is readily accumulated by many organisms, particularly by micro-organisms and mollusc where bio- concentration factors are in the order of thousands. Soil invertebrates also concentrate Cd markedly [24]. Chronic exposure to the metal produces a wide variety of acute and chronic effects in mammals similar to those seen in humans. Kidney damage and lung emphysema are the primary effects of high Cadmium in the body. Mean values of the metal in this study ranged from 4.0 µg/l at Bale to a maximum of 10.3 µg/l at Lafa in the wet season, Table 6. The dry season values recorded ranged from 7.0 µg/l at Densu to 17.0 µg/l at Lafa, Table 7. There was a defined trend as the dry season values ob- tained were higher than the wet season values. Even though the values obtained are low, cadmium is known to be one of the most toxic elements with reported car- cinogenic effects to humans [25]. High concentration of cadmium has been found to lead to chronic kidney dys function. Cadmium may bioaccumulate at all levels of aquatic and terrestrial food chains. Cadmium contamina- tions in surface water bodies could be attributed to the discharge of contaminants including nickel-cadmium batteries. Some other activities which may introduce cadmium into these environments include electroplating and plastic manufacture. 3.4.5. Zinc (Zn) Zinc levels were below the detection limits in all the wa- ters sampled at the various sites. It is not clear why the very low level of the metal in the rivers despite the re- corded values of zinc in the leachates from the dumpsites located close to the rivers [26]. This will need further investigation to ascribe reasons to the very low values of zinc. 3.5. Bacteriological Parameters Pathogens are bacteria and viruses that can be found in water and cause diseases in humans. Typically, patho- gens cause disease when they are present in public drink- ing water supplies. Pathogens found in contaminated runoff may also contain parasitic worms (helminths). Coliform bacteria and faecal matter may also be detected in runoffs. These bacteria are a commonly used indicator of water pollution, but not an actual cause of disease. 3.5.1. Total Coliform (TC) Total coliform gives a clear indication of the general sanitary condition of water since this group includes bacteria of faecal origin. However, many of the bacteria in this group may originate from growth in the aquatic environment. This is used to evaluate the general sanitary quality of drinking and related water use [6]. The mean total coliform population in this study varied between 6.0 × 10⁴ cfu/100 ml at Densu and 94.0 × 10⁴ cfu/100 ml at Lafa in the wet season. The dry season recorded a value of 2.3 ×10⁴ cfu/100 ml at Densu to 118.0 × 10⁴ cfu/100 Copyright © 2012 SciRes. JWARP 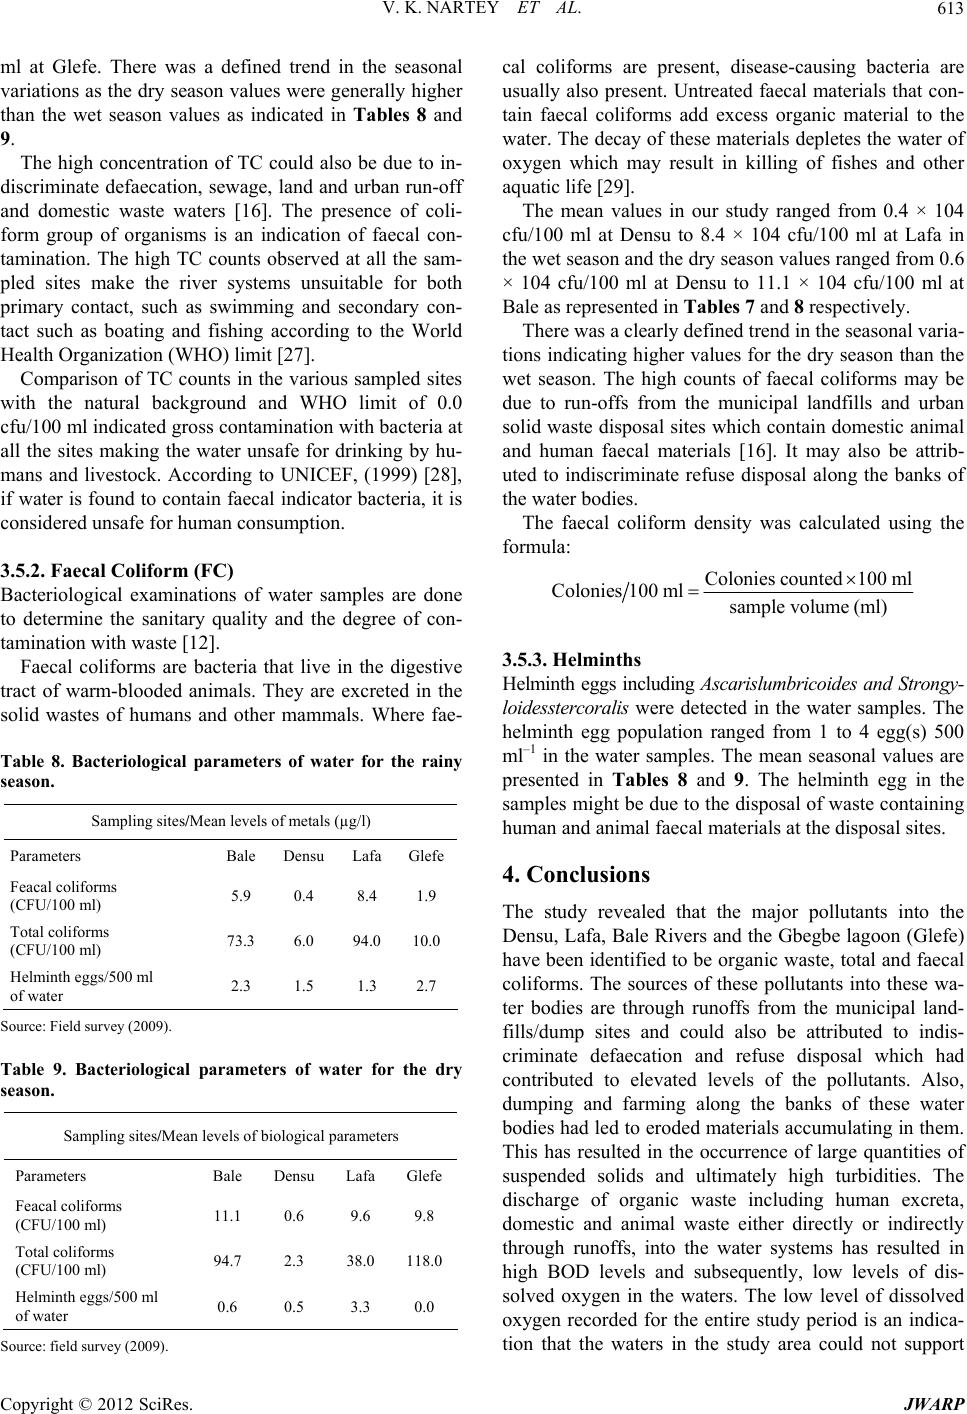 V. K. NARTEY ET AL. 613 ml at Glefe. There was a defined trend in the seasonal variations as the dry season values were generally higher than the wet season values as indicated in Tables 8 and 9. The high concentration of TC could also be due to in- discriminate defaecation, sewage, land and urban run-off and domestic waste waters [16]. The presence of coli- form group of organisms is an indication of faecal con- tamination. The high TC counts observed at all the sam- pled sites make the river systems unsuitable for both primary contact, such as swimming and secondary con- tact such as boating and fishing according to the World Health Organization (WHO) limit [27]. Comparison of TC counts in the various sampled sites with the natural background and WHO limit of 0.0 cfu/100 ml indicated gross contamination with bacteria at all the sites making the water unsafe for drinking by hu- mans and livestock. According to UNICEF, (1999) [28], if water is found to contain faecal indicator bacteria, it is considered unsafe for human consumption. 3.5.2. Faecal Coli form (FC) Bacteriological examinations of water samples are done to determine the sanitary quality and the degree of con- tamination with waste [12]. Faecal coliforms are bacteria that live in the digestive tract of warm-blooded animals. They are excreted in the solid wastes of humans and other mammals. Where fae- Table 8. Bacteriological parameters of water for the rainy season. Sampling sites/Mean levels of metals (µg/l) Parameters Bale Densu LafaGlefe Feacal coliforms (CFU/100 ml) 5.9 0.4 8.4 1.9 Total coliforms (CFU/100 ml) 73.36.0 94.010.0 Helminth eggs/500 ml of water 2.3 1.5 1.3 2.7 Source: Field survey (2009). Table 9. Bacteriological parameters of water for the dry season. Sampling sites/Mean levels of biological parameters Parameters Bale Densu Lafa Glefe Feacal coliforms (CFU/100 ml) 11.1 0.6 9.6 9.8 Total coliforms (CFU/100 ml) 94.7 2.3 38.0 118.0 Helminth eggs/500 ml of water 0.6 0.5 3.3 0.0 Source: field survey (2009). cal coliforms are present, disease-causing bacteria are usually also present. Untreated faecal materials that con- tain faecal coliforms add excess organic material to the water. The decay of these materials depletes the water of oxygen which may result in killing of fishes and other aquatic life [29]. The mean values in our study ranged from 0.4 × 10⁴ cfu/100 ml at Densu to 8.4 × 10⁴ cfu/100 ml at Lafa in the wet season and the dry season values ranged from 0.6 × 10⁴ cfu/100 ml at Densu to 11.1 × 10⁴ cfu/100 ml at Bale as represented in Tables 7 and 8 respectively. There was a clearly defined trend in the seasonal varia- tions indicating higher values for the dry season than the wet season. The high counts of faecal coliforms may be due to run-offs from the municipal landfills and urban solid waste disposal sites which contain domestic animal and human faecal materials [16]. It may also be attrib- uted to indiscriminate refuse disposal along the banks of the water bodies. The faecal coliform density was calculated using the formula: Colonies counted100 ml Colonies100 mlsample volume (ml) 3.5.3. Helminths Helminth eggs including Ascarislumbricoides and Strongy- loidesster coralis were detected in the water samples. The helminth egg population ranged from 1 to 4 egg(s) 500 ml–1 in the water samples. The mean seasonal values are presented in Tables 8 and 9. The helminth egg in the samples might be due to the disposal of waste containing human and animal faecal materials at the disposal sites. 4. Conclusions The study revealed that the major pollutants into the Densu, Lafa, Bale Rivers and the Gbegbe lagoon (Glefe) have been identified to be organic waste, total and faecal coliforms. The sources of these pollutants into these wa- ter bodies are through runoffs from the municipal land- fills/dump sites and could also be attributed to indis- criminate defaecation and refuse disposal which had contributed to elevated levels of the pollutants. Also, dumping and farming along the banks of these water bodies had led to eroded materials accumulating in them. This has resulted in the occurrence of large quantities of suspended solids and ultimately high turbidities. The discharge of organic waste including human excreta, domestic and animal waste either directly or indirectly through runoffs, into the water systems has resulted in high BOD levels and subsequently, low levels of dis- solved oxygen in the waters. The low level of dissolved oxygen recorded for the entire study period is an indica- tion that the waters in the study area could not support Copyright © 2012 SciRes. JWARP  V. K. NARTEY ET AL. 614 life sufficiently. The presence of the coliform group of organisms is an indication of faecal pollution. This is quite alarming con- sidering the assertion by Pierce et al., (1998) [15], that large numbers of coliforms in water is an indication of recent pollution by wastes from warm-blooded animals and therefore the water may contain pathogenic organ- isms. Even though the people in the study area do not depend solely on these water bodies as their sources of water supply, the spate of water shortages could turn the tide. The presence of these coliforms could be response- ble for the transmission of infectious diseases which in- clude typhoid fever, dysentery, salmonellosis, cholera and gastroenteritis [6] which have been reported in the Accra metropolis. Heavy metals such as Cd, Pb, Mn, Cu and Zn analyzed in the water samples recorded varying levels of the metals. Heavy metals of public concern like Pb and Cd fell between 4.0 µg/l to 100 µg/l and were below the WHO recommended levels. There is therefore no threat to life in relation to the levels of these metals detected in the water bodies. Helminth eggs and especially those of the genus As- caris and Strongyloides families are the most commonly found in the water samples from the study area. However, there is no evidence of significant pollution with hel- minth ova that might pose a threat to humans especially those who have direct contact with the water. REFERENCES [1] A. Onibokun, “Governance and Waste Management in Africa,” International Development Research Centre, Canada, 1999. [2] F. N’Dow, “Sustainable Development,” Our Cities, Our Planet, Vol. 8, No. 1, 1996, pp. 22-25. [3] United Nations Population Fund, “The State of World Population,” UNFPA Phoenix-Trykleriet AS, Denmark, 2001. [4] J. Rabinovitch, “Global, Regional and Local Perspectives towards Sustainable Urban and Rural Development,” Ashgate Publishing Ltd., London, 1998. [5] Fact Sheet on Solid Waste Disposal in Ghana, WELL Fact sheet, Solid Waste Disposal in Ghana, 2009. www.trend.watsan.net [6] EPA, “Ghana Landfills Guidelines”, Accra, 2002. [7] Government of Ghana (GOG), “Second Urban Environ- mental Sanitation Project (UESP),” Ministry of Local Government and Rural Development Environmental and Social Assessment, Vol. 1, 2003, pp. 48-110. [8] Accra Metropolitan Assembly (AMA), “Sanitation and Waste Management Strategy of the Accra Metropolitan Assembly,” Accra, 2006. [9] A. F. Aiyesanmi and O. B. Imoisi, “Understanding Leach- ing behavior of Landfill Leachate in Benin-City, Edo State, Nigeria through Dumpsite Monitoring,” British Journal of Environment and Climate Change, Vol. 1, No. 4, 2011, pp. 190-200. [10] US Environmental Protection Agency (USEPA), “Innova- tive Uses of Composts,” 2009. www.epa.gov [11] APHA, “Standard Methods for the Examination of Water and Waste Water,” 20th Edition, APHA, Washington DC, 1998. [12] APHA, AWWA and WEF, “Standard Methods for the Examination of Water and Waste Water. 20th Edition, American Public Health Association (APHA), American Water Works Association, (AWWA), Water Environment Federation (WEF),” Washington DC, 1995. [13] J. Schwartzbrod, “Consultancy Report Submitted to EA- WAG/ SANDEC,” 2000. [14] WHO, “Guidelines for the Safe Use of Wastewater, Ex- creta and Grey Water,” Wastewater and Excreta Use in Aquaculture, Vol. 3, World Health Organization, Geneva, 2006. [15] J. J. Pierce, R. F. Weiner, and A. P. Vesihind, “Environ- mental Pollution and Control,” 4th Edition, Butterworth- Heinemann Press, Boston, 1998. [16] D. Chapman, “Water Quality Assessment. A Guide to the Use of Biota, Sediments and Water in Environmental Monitoring,” 2nd Editon, E&FN Spon, New York, 1996. [17] B. R. Davis and J. A. Day, “Vanishing Waters,” University of Cape Town Press and Juta Press, Cape Town, 1998. [18] J. N. Lester and J. W. Birkett, “Microbiology and Chemis- try for Environmental Scientists and Engineers,” 2nd Edi- tion, E&FN Spon, New York, 1999. [19] W. P. Cunningham and B. W. Saigo, “Environmental Science: A Global Concern,” 5th Edition, McGraw-Hill Publishers, Boston, 1999. [20] S. B. Akuffo, “Pollution Control in a Developing Country: A Case Study of the Situation in Ghana,” 2nd Edition, Ghana Universities Press, Legon, 1998. [21] WHO, “Guidelines for Drinking-Water Quality, Volume 1: Recommendations. Geneva: WHO,” 2009. http://www.who.int/water_sanitation_health/dwq/GDWQ 2004web.pdf [22] WHO, “Environmental Chemistry,” 2nd Edition, WH Freeman and Co., New York, 2004. [23] WHO, “Lead-Environmental Aspects,” Environmental Health Criteria 85, World Health Organization, Interna- tional Programme on Chemical Safety (IPCS), Geneva, 1989. [24] P. B. Woodbury, “Trace Elements in Municipal Solid Waste Compost: A Review of Potential Detrimental Ef- fects on Plants, Soil Biota and Water,” Biomass and Bio- energy, Vol. 3, 1992, pp. 239-259. doi:10.1016/0961-9534(92)90029-P [25] IARC, “Cadmium and Cadmium Compound (Group),” IARC Monograph, Vol. 58, 1993, 25 p. [26] V. K. Nartey, R. K. Klake, L. K. Doamekpor and S. Sar- pong-Kumankomah, “Speciation of Mercury in Mine Waste: Case Study of Abandoned and Active Gold Mine Sites at the Bibiani-Awianso-Bekwai Gold Mining Com- munity of South Western Ghana,” Environ Monit Assess, Copyright © 2012 SciRes. JWARP  V. K. NARTEY ET AL. Copyright © 2012 SciRes. JWARP 615 2012. [27] Millipore, “Water Microbiology,” Laboratories and Field Procedures, Bedford, 1991. [28] UNICEF, “Project Report: Study on Possible Pollution Caused by Water Seal Latrine to Ground Soil and Groundwater after 10 Years of Operation CEC,” Univer- sity of Science, Hanoi National University, Vietnam, 1999. [29] F. R. Spellman, and J. Drinan, “The Drinking Water Handbook,” Technomic Publishing Co. Inc., Lancaster, 2000.
|