Paper Menu >>
Journal Menu >>
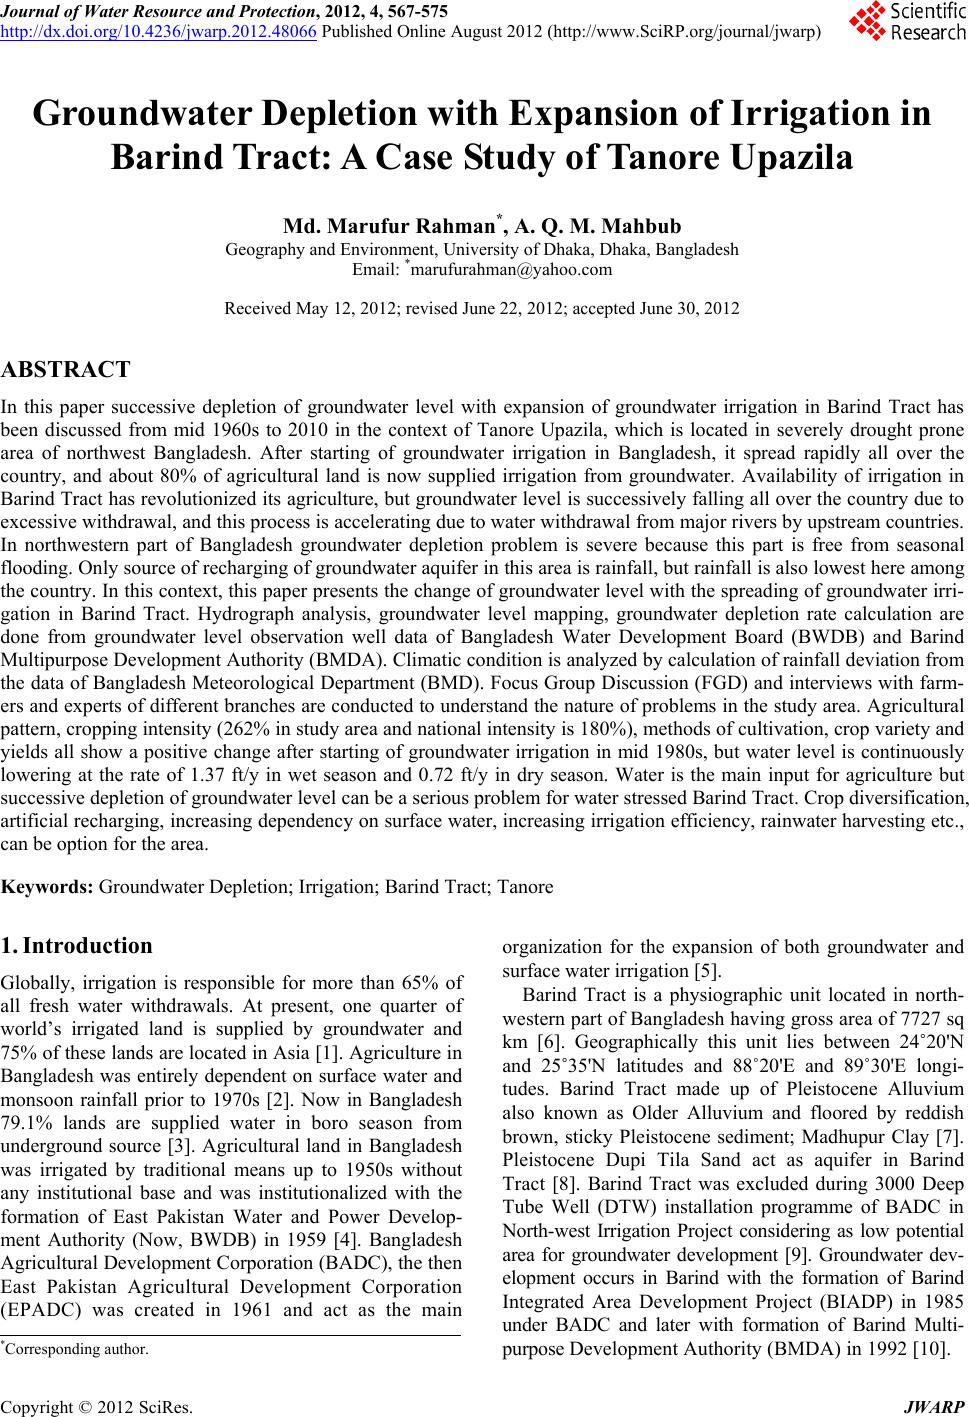 Journal of Water Resource and Protection, 2012, 4, 567-575 http://dx.doi.org/10.4236/jwarp.2012.48066 Published Online August 2012 (http://www.SciRP.org/journal/jwarp) Groundwater Depletion with Expansion of Irrigation in Barind Tract: A Case Study of Tanore Upazila Md. Marufur Rahman*, A. Q. M. Mahbub Geography and Environment, University of Dhaka, Dhaka, Bangladesh Email: *marufurahman@yahoo.com Received May 12, 2012; revised June 22, 2012; accepted June 30, 2012 ABSTRACT In this paper successive depletion of groundwater level with expansion of groundwater irrigation in Barind Tract has been discussed from mid 1960s to 2010 in the context of Tanore Upazila, which is located in severely drought prone area of northwest Bangladesh. After starting of groundwater irrigation in Bangladesh, it spread rapidly all over the country, and about 80% of agricultural land is now supplied irrigation from groundwater. Availability of irrigation in Barind Tract has revolutionized its agriculture, but groundwater level is successively falling all over the country due to excessive withdrawal, and this process is accelerating due to water withdrawal from major rivers by upstream countries. In northwestern part of Bangladesh groundwater depletion problem is severe because this part is free from seasonal flooding. Only source of recharging of groundwater aquifer in this area is rainfall, but rainfall is also lowest here among the country. In this context, this paper presents the change of groundwater level with the spreading of groundwater irri- gation in Barind Tract. Hydrograph analysis, groundwater level mapping, groundwater depletion rate calculation are done from groundwater level observation well data of Bangladesh Water Development Board (BWDB) and Barind Multipurpose Development Authority (BMDA). Climatic condition is analyzed by calculation of rainfall deviation from the data of Bangladesh Meteorological Department (BMD). Focus Group Discussion (FGD) and interviews with farm- ers and experts of different branches are conducted to understand the nature of problems in the study area. Agricultural pattern, cropping intensity (262% in study area and national intensity is 180%), methods of cultivation, crop variety and yields all show a positive change after starting of groundwater irrigation in mid 1980s, but water level is continuously lowering at the rate of 1.37 ft/y in wet season and 0.72 ft/y in dry season. Water is the main input for agriculture but successive depletion of groundwater level can be a serious problem for water stressed Barind Tract. Crop diversification, artificial recharging, increasing dependency on surface water, increasing irrigation efficiency, rainwater harvesting etc., can be option for the area. Keywords: Groundwater Depletion; Irrigation; Barind Tract; Tanore 1. Introduction Globally, irrigation is responsible for more than 65% of all fresh water withdrawals. At present, one quarter of world’s irrigated land is supplied by groundwater and 75% of these lands are located in Asia [1]. Agriculture in Bangladesh was entirely dependent on surface water and monsoon rainfall prior to 1970s [2]. Now in Bangladesh 79.1% lands are supplied water in boro season from underground source [3]. Agricultural land in Bangladesh was irrigated by traditional means up to 1950s without any institutional base and was institutionalized with the formation of East Pakistan Water and Power Develop- ment Authority (Now, BWDB) in 1959 [4]. Bangladesh Agricultural Development Corporation (BADC), the then East Pakistan Agricultural Development Corporation (EPADC) was created in 1961 and act as the main organization for the expansion of both groundwater and surface water irrigation [5]. Barind Tract is a physiographic unit located in north- western part of Bangladesh having gross area of 7727 sq km [6]. Geographically this unit lies between 24˚20'N and 25˚35'N latitudes and 88˚20'E and 89˚30'E longi- tudes. Barind Tract made up of Pleistocene Alluvium also known as Older Alluvium and floored by reddish brown, sticky Pleistocene sediment; Madhupur Clay [7]. Pleistocene Dupi Tila Sand act as aquifer in Barind Tract [8]. Barind Tract was excluded during 3000 Deep Tube Well (DTW) installation programme of BADC in North-west Irrigation Project considering as low potential area for groundwater development [9]. Groundwater dev- elopment occurs in Barind with the formation of Barind Integrated Area Development Project (BIADP) in 1985 under BADC and later with formation of Barind Multi- purpose Development Authority (BMDA) in 1992 [10]. *Corresponding author. C opyright © 2012 SciRes. JWARP 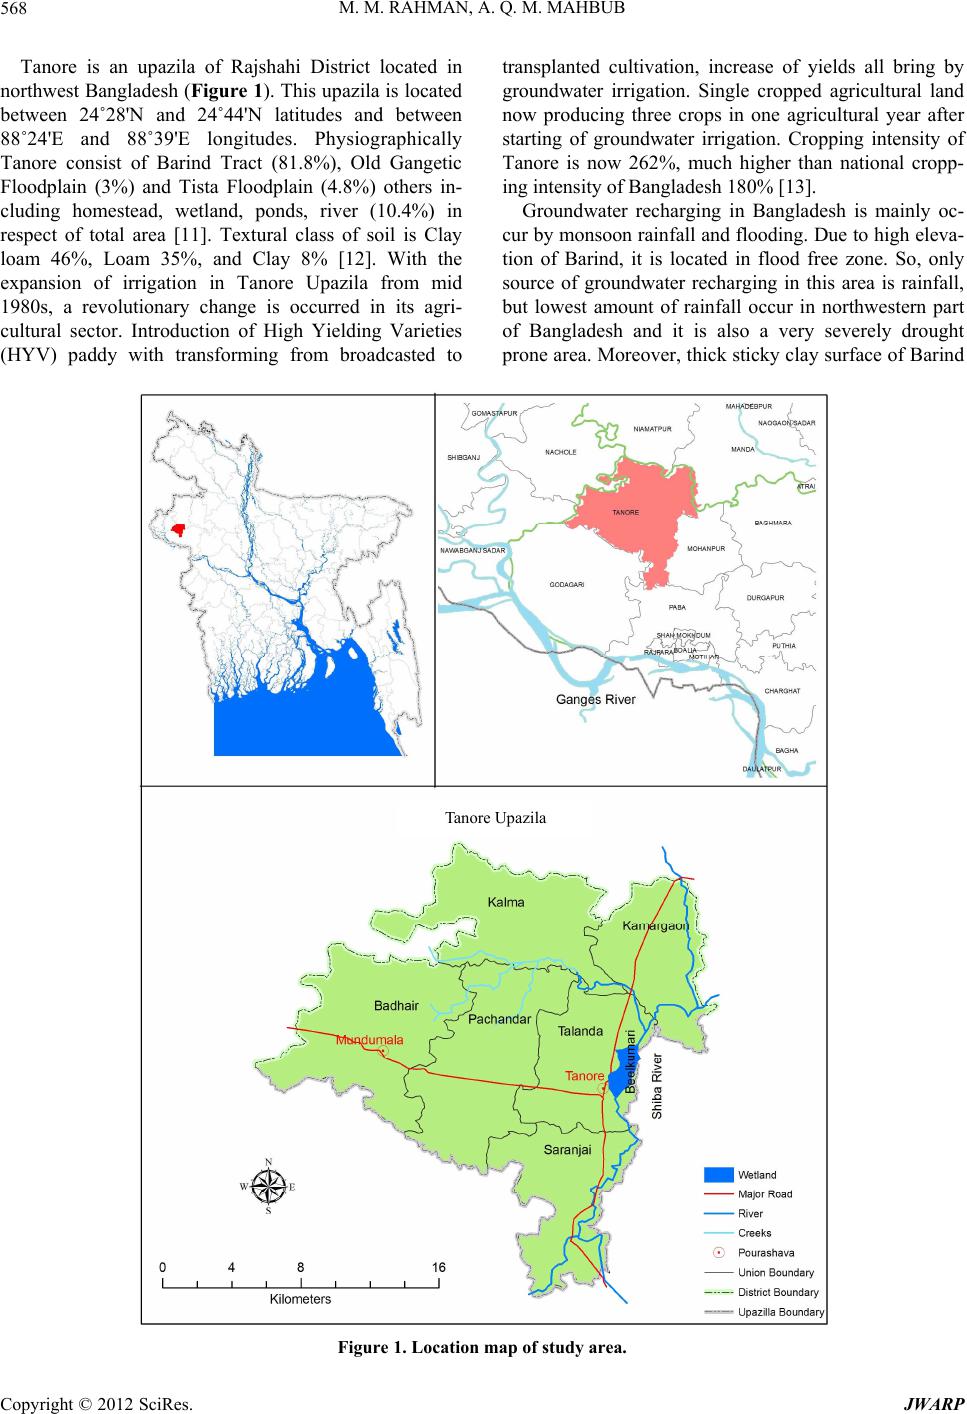 M. M. RAHMAN, A. Q. M. MAHBUB 568 Tanore is an upazila of Rajshahi District located in northwest Bangladesh (Figure 1). This upazila is located between 24˚28'N and 24˚44'N latitudes and between 88˚24'E and 88˚39'E longitudes. Physiographically Tanore consist of Barind Tract (81.8%), Old Gangetic Floodplain (3%) and Tista Floodplain (4.8%) others in- cluding homestead, wetland, ponds, river (10.4%) in respect of total area [11]. Textural class of soil is Clay loam 46%, Loam 35%, and Clay 8% [12]. With the expansion of irrigation in Tanore Upazila from mid 1980s, a revolutionary change is occurred in its agri- cultural sector. Introduction of High Yielding Varieties (HYV) paddy with transforming from broadcasted to transplanted cultivation, increase of yields all bring by groundwater irrigation. Single cropped agricultural land now producing three crops in one agricultural year after starting of groundwater irrigation. Cropping intensity of Tanore is now 262%, much higher than national cropp- ing intensity of Bangladesh 180% [13]. Groundwater recharging in Bangladesh is mainly oc- cur by monsoon rainfall and flooding. Due to high eleva- tion of Barind, it is located in flood free zone. So, only source of groundwater recharging in this area is rainfall, but lowest amount of rainfall occur in northwestern part of Bangladesh and it is also a very severely drought prone area. Moreover, thick sticky clay surface of Barind Tanore Upazila Figure 1. Location map of study area. Copyright © 2012 SciRes. JWARP 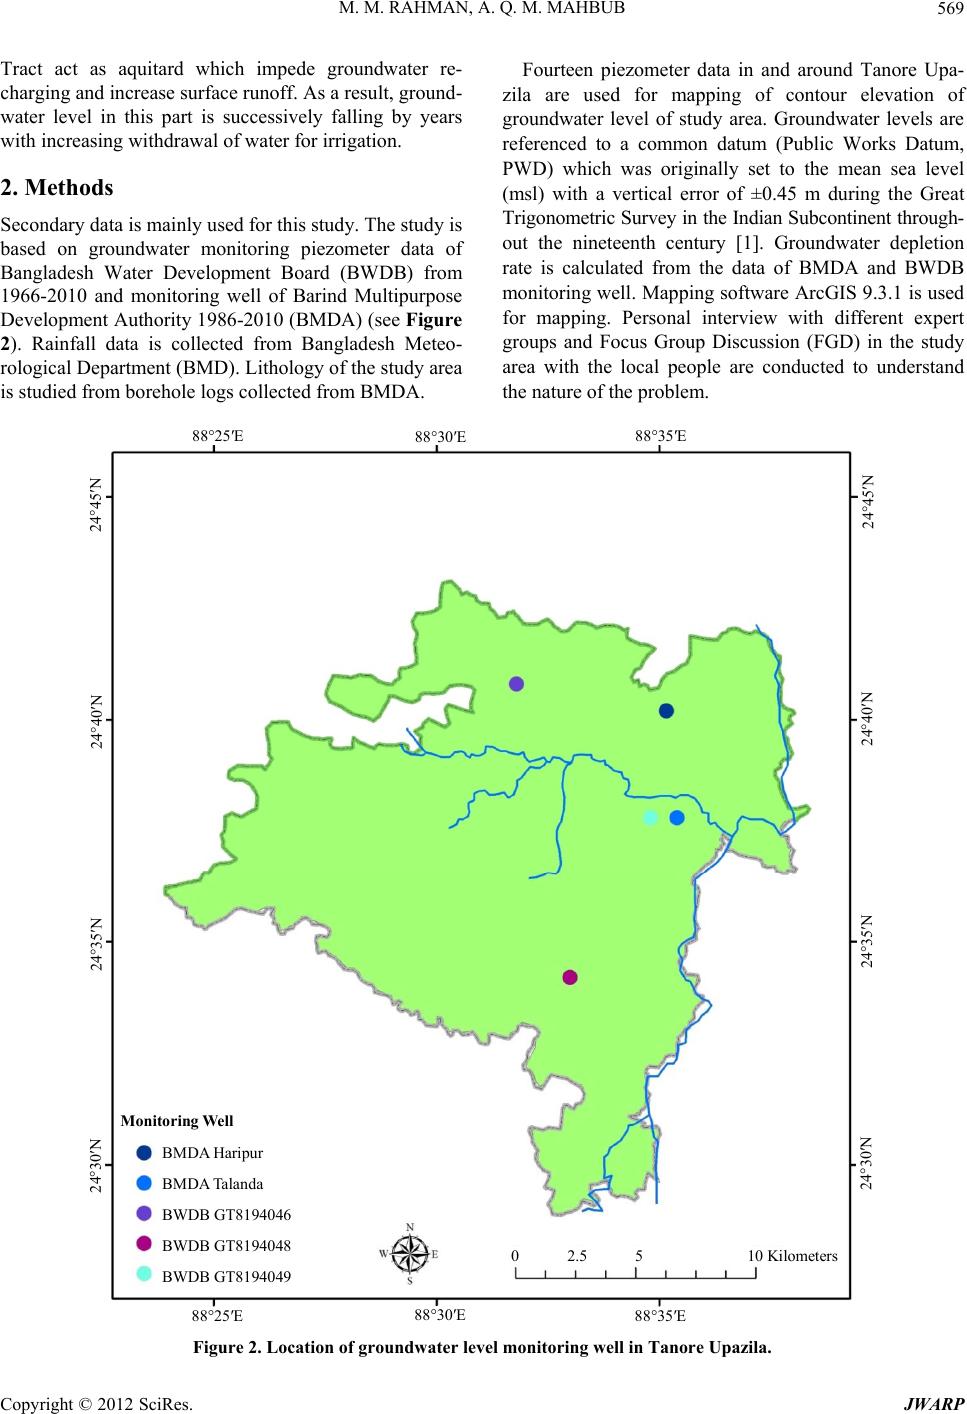 M. M. RAHMAN, A. Q. M. MAHBUB 569 Tract act as aquitard which impede groundwater re- charging and increase surface runoff. As a result, ground- water level in this part is successively falling by years with increasing withdrawal of water for irrigation. 2. Methods Secondary data is mainly used for this study. The study is based on groundwater monitoring piezometer data of Bangladesh Water Development Board (BWDB) from 1966-2010 and monitoring well of Barind Multipurpose Development Authority 1986-2010 (BMDA) (see Figure 2). Rainfall data is collected from Bangladesh Meteo- rological Department (BMD). Lithology of the study area is studied from borehole logs collected from BMDA. Fourteen piezometer data in and around Tanore Upa- zila are used for mapping of contour elevation of groundwater level of study area. Groundwater levels are referenced to a common datum (Public Works Datum, PWD) which was originally set to the mean sea level (msl) with a vertical error of ±0.45 m during the Great Trigonometric Survey in the Indian Subcontinent through- out the nineteenth century [1]. Groundwater depletion rate is calculated from the data of BMDA and BWDB monitoring well. Mapping software ArcGIS 9.3.1 is used for mapping. Personal interview with different expert groups and Focus Group Discussion (FGD) in the study area with the local people are conducted to understand the nature of the problem. Monit oring Well BMDA Haripur BMDA Talanda BWDB GT8194046 BWDB GT8194048 BWDB GT8194049 0 2.5 5 10 Kilometers 88°25′E88°30′E88°35′E 88°25′E88°30′E88°35′E 24°45′N 24°45′N 24°40′N 24°40′N 24°35′N 24°30′N 24°35′N 24°30′N Figure 2. Location of groundw ate r level monitoring well in Tanore Upazila. Copyright © 2012 SciRes. JWARP 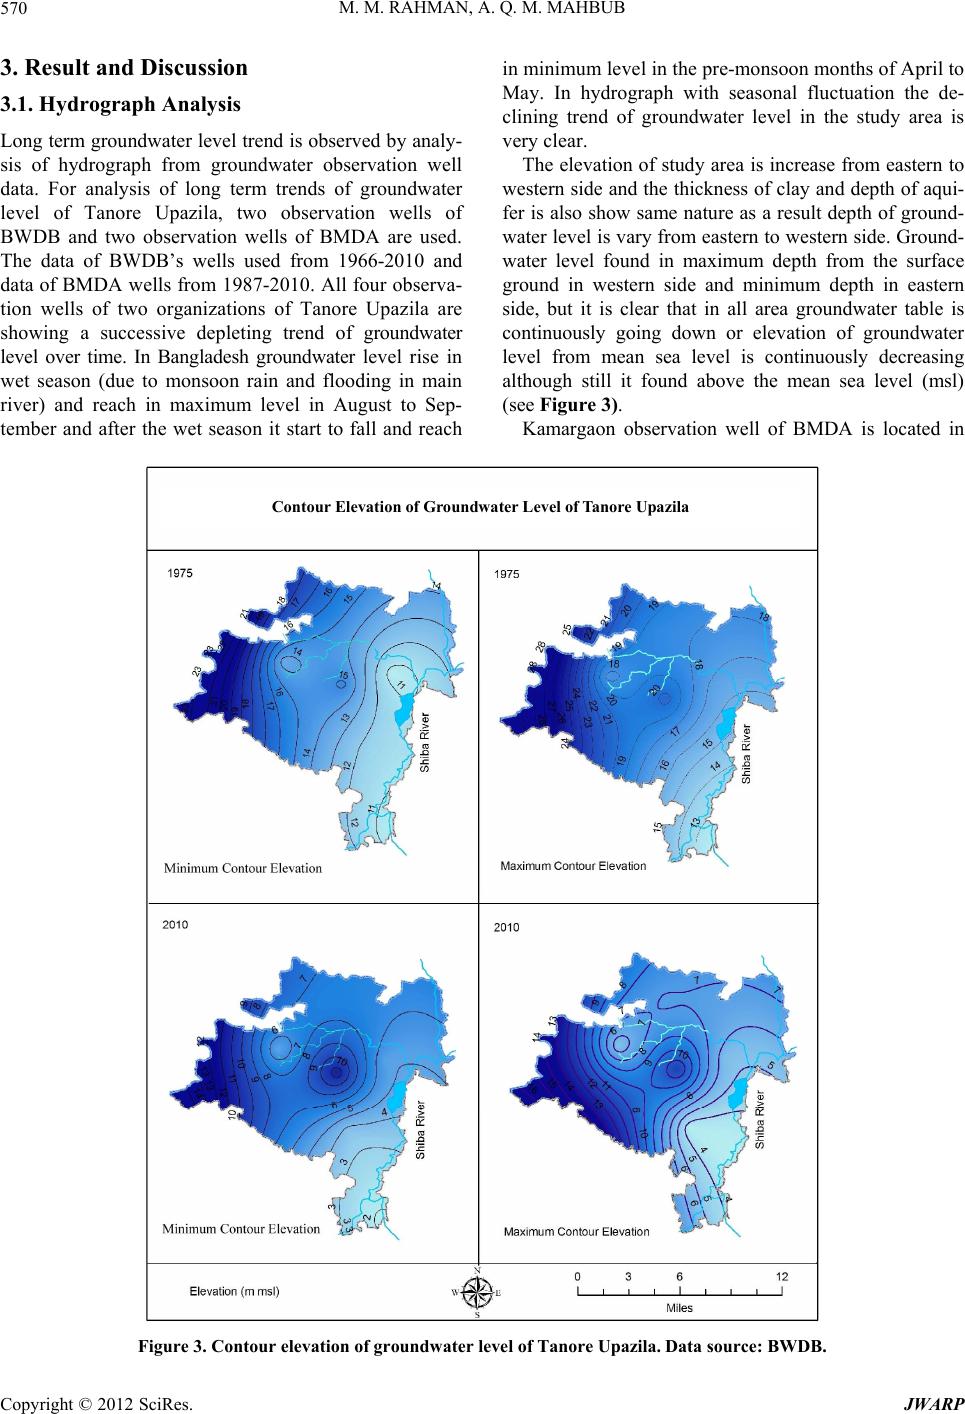 M. M. RAHMAN, A. Q. M. MAHBUB 570 3. Result and Discussion 3.1. Hydrograph Analysis Long term groundwater level trend is observed by analy- sis of hydrograph from groundwater observation well data. For analysis of long term trends of groundwater level of Tanore Upazila, two observation wells of BWDB and two observation wells of BMDA are used. The data of BWDB’s wells used from 1966-2010 and data of BMDA wells from 1987-2010. All four observa- tion wells of two organizations of Tanore Upazila are showing a successive depleting trend of groundwater level over time. In Bangladesh groundwater level rise in wet season (due to monsoon rain and flooding in main river) and reach in maximum level in August to Sep- tember and after the wet season it start to fall and reach in minimum level in the pre-monsoon months of April to May. In hydrograph with seasonal fluctuation the de- clining trend of groundwater level in the study area is very clear. The elevation of study area is increase from eastern to western side and the thickness of clay and depth of aqui- fer is also show same nature as a result depth of ground- water level is vary from eastern to western side. Ground- water level found in maximum depth from the surface ground in western side and minimum depth in eastern side, but it is clear that in all area groundwater table is continuously going down or elevation of groundwater level from mean sea level is continuously decreasing although still it found above the mean sea level (msl) (see Figure 3). Kamargaon observation well of BMDA is located in Contour Elevation of Groundwater Level of Tanore Upazila Figure 3. Contour elevation of groundw ater level of Tanore Upazila. Data source: BWDB. Copyright © 2012 SciRes. JWARP  M. M. RAHMAN, A. Q. M. MAHBUB 571 Haripur of Kamargaon Union where clay thickness is about 25 - 30 ft and sand aquifer located below 20 -30 ft from surface. Hydrograph of Kamargaon Union showing groundwater level fluctuation from 1986-2010. Data is collected in fifteen days interval in 15th and last day of month. Hydrograph in Figure 4 depict both seasonal fluctuation and long term trends of water level in the area. In 1986 seasonal fluctuation occur in between 5 - 23 ft which stands in 29 - 54 ft in the year of 2009. The differ- ence between maximum and minimum water level in one season was 2.67 ft (2010). Hydrograph show a declining trend of groundwater level which starts to decline in a rapid rate after 2002. Talanda observation well of BMDA is in Talanda Mouza and located very close to River Shiba and Beelkumari. Hydrograph in Figure 5 depict the ground- water level of Talanda from fifteen July 1986 to thirty June 2011. Interval of data collection is similar to Hari- pur observation well of BMDA and it is fifteen days and in fifteenth and last day of month, twenty four observa- tion in a year. Clay thickness and aquifer depth are var- ied in Talanda Union. Thickness of clay layer of obser- vation well is about 20 ft and below 20 ft from surface sand aquifer is located. Hydrograph in Figure 5 present both long term trend of groundwater level and seasonal fluctuation. In 1987 seasonal fluctuation of groundwater Figure 4. Water level hydrograph of Kamargaon Union, Tanore. Data source: BMDA (Mouza: Haripur, J.L. No-236, Plot No-211). Figure 5. Water level hydro graph of Talanda Uni on, Tanore. Data source: BMDA (Mouza: Talanda, J.L. No-224, Plot No-1138). occur 8.50 - 31.54 ft and it standed 41.67 - 42.83 ft in 2010. Fluctuation of water level in 2010 was very small because low rainfall in wet season. Recorded rainfall from BMD’s Rajshahi station was only 792 mm. Two observation well of BWDB is used in hydrograph analysis of groundwater level of Tanore Upazila. New well ID of BWDB well is GT8194046 and GT8194048 and old ID was RJ039 and RJ086 respectively. Reading interval and observation well type of BWDB both is dif- ferent from BMDA observation well. Reading interval is seven days in BWDB well. In collected data reading is taken every week but not in a fixed date like BMDA and data missing is a common problem. BWDB wells are used only for groundwater level monitoring purpose, whereas BMDA wells are used both for irrigation and water level monitoring. Static water level is collected from BMDA wells for monitoring of groundwater level. Unit of BWDB’s collected data is meter, whereas BMDA collect data in feet. From 14th February 1966 to 18th October of 2010 data of well GT8194046 is used for hydrograph analysis. From 14th June 1971 to 1972 data of this well was not available, and the reason is easily understandable. The War of Liberation occurs in 1971, as a result data collec- tion was interrupted and it was again started from first January 1973. Prior reading was collected from dug well and later it was replaced by piezometer. Hydrograph in Figure 6 show that groundwater level fluctuation was almost stable till 1978 and after 1978 fluctuation level is increased but after 1983 the groundwater level decline rapidly and the sharp negative trend is observed till pre- sent. Data from 12th December 1966 to 11th October 2010 of BWDB’s well GT8194048 is used in hydrograph of Figure 7. Data was unavailable from 5th April 1971 to October of 1972 due to Liberation War and from No- vember 1972 data collection was again started. After 1980 depletion trend is observed and after 1994 ground- water level deplete rapidly. Spread of irrigation in Tanore Upazila occurs in 1980s which is the main factor of groundwater level depletion. Figure 6. Water level hydrograph of Tanore Upazila. Data source: BWDB. Copyright © 2012 SciRes. JWARP  M. M. RAHMAN, A. Q. M. MAHBUB 572 Deep Tube Well Distribution in Tanore Upazila (one Dot = 1 Deep Tube Well) Figure 7. Water level hydrograph of Tanore Upazila. Data source: BWDB. 3.2. Groundwater Development and Water Level Groundwater irrigation was started in Tanore Upazila in 1970s and spread after formation of Barind Integrated Area Development Project (BIADP) in 1985 [10]. First time, irrigation started in eastern part (see Figure 8) and western part was avoided due to high depth of aquifer (70 - 90 ft below the surface), later irrigation spread all parts of upazila with the formation of Barind Multipur- pose Development Authority (BMDA) in 1992. Groundwater level is continuously going down every year. Figure 9 shows the relationship between deep tube well development and water level in dry season from 1966 to 2010. Graph show a clear relationship between water level and development of DTW over time. With increasing number of deep tube wells, every year the rate of depletion of groundwater level is accelerating in dry season. From 1966-1975 hydrograph show almost no change in groundwater level. In 1975 number of deep tube wells was only 5 and from 1986 number is increas- ing in an accelerating rate and groundwater level also starts to deplete rapidly from 1986. According to ground- water observation well GT8194046 of BWDB minimum water level was fluctuate in between 6.08 m to 6.86 m from 1966 to 1984, and total number of deep tube wells was 77 in 1984. In 1986 minimum water level reached in 9.03 m and number of deep tube wells was 122. In 2010 water level reaches in 14.09 m from 1966’s 6.08 m and number of DTWs cross 500 and huge number of shallow tube wells are also come in operation (which known as mini-deep in the study area) by private sector in the meantime. River Upazila Boundary District Boundary 0 3.75 7.5 15 Kilometers Figure 10 shows relationships between maximum wa- ter level and annual rainfall. Annual rainfall data is used from Rajshahi station of BMD from 1979 to 2010. From the graph it is clear that although rainfalls show a regular pattern, but maximum water level elevation is continu- ously going down or depth of water level increasing from surface. In 1981 annual rainfall was 2241 mm and water level was in 1.12 m depth from surface and in 2007 an- nual rainfall was 2018 mm but groundwater level reached in 11.22 m below surface ground. Water level of Figure 8. Deep tube well distribution for irrigation in Tanore Upazila over time. Data source: BMDA. Figure 9. Water level hydrograph and deep tube well de- velopment over time in Tanore Upazila. Data source: BMDA, BWDB (Well ID-GT8194046). well GT8194046 was stayed 1.35 to 1.95 m till 1984 (1.35 m in 1966 and 1.95 m in 1984) in wet season. In 1986 water level reached in 2.03 m and in 2010 it was in 13.77 m below surface. In 1992 and 2010 annual rainfall was lowest 843 mm and 792 mm and water level was 5.3 m and 13.77 m respectively. So, recharging in wet season is overruled by withdrawal of water all year round in study area. Figure 8 shows the spreading of deep tube well in study area over time and Figure 3 shows the change in groundwater level elevation in the meantime. Copyright © 2012 SciRes. JWARP  M. M. RAHMAN, A. Q. M. MAHBUB 573 Figure 11 shows rainfall deviations from normal an- nual rainfall from 1979-2010. It also depicts a regular positive and negative anomaly over time, but maximum groundwater level show continuous negative trend (Fig- ure 10). Due to continuous depletion of water level many hand tube wells suffer layer failure problems and abandoned or replaced by tap (Figure 12). Some hand tube wells are also abandoned for availability of tap line not for layer failure. Tap is much convenient than hand tube well which need muscle power during water withdrawal, and when groundwater layer stay at minimum level elevation (msl) in dry season water withdrawal become very tedi- ous job by hand tube well for drinking and other domes- tic purposes. Water supplied to tap from irrigation deep tube well through overhead tank for drinking purpose. But people now use tap water for drinking and for all other domestic and household uses. Ponds and other sources of surface water are now used only for cultiva- tion of fish and animal birds rearing. 3.3. Groundwater Depletion Rate of Tanore According to five piezometers of BWDB, the groundwa- Figure 10. Water level hydrograph and yearly rainfall dis- tribution in Tanore Upazila. Data source: BMD, BWDB (Well ID-GT8194046). Figure 11. Rainfall deviations from annual normal rainfall in study area. Figure 12. Abandonment of hand tube well due to water layer failure in study area. ter level of Tanore Upazila yet found above the mean sea level but depleting in an accelerating rate. The ground- water depletion rate in Tanore is calculated from three piezometers data of BWDB and two monitoring wells data of BMDA (see Figure 2). 3.3.1. Depletion Rate in Wet Season From three BWDB monitoring wells data groundwater depletion rate in wet season when water table stayed at minimum depth from surface and maximum elevation from mean sea level (msl) is higher than one ft per year. The piezometer GT8194046 show depletion rate 1.54 ft/y, GT8194048 and GT8194049 show rate of depletion 1.15 ft/y and 1.26 ft/y respectively (see Table 1). In all three monitoring wells calculation are done from the maximum water level elevation (msl) of 1983 and 2010. Rate calculation from BMDA monitoring well is done from 1987 and 2010 data. One monitoring well of BMDA is located in Talanda Union and other is in Haripur of Kamargaon Union (Figure 2). Calculated depletion rate of both monitoring wells are higher than one ft per year in wet season and the rate is same, 1.44 ft/y. Average rate from five monitoring wells of two organizations in wet season (depletion rate of maximum water level elevation) is 1.37 ft/y. It is clear that the recovery rate is lower than the withdrawal rate as a result the groundwater table is depleting in wet season in an alarming rate. 3.3.2. Depl etion Rate in Dry Sea son Depletion rate of minimum water level elevation (msl) of Tanore Upazila is also calculated from the same five monitoring wells of two organizations used in depletion rate calculation of maximum water level elevation (see Table 2). In dry season water table fall and reach in maximum depth from surface and the elevation stayed minimum from mean sea level. Copyright © 2012 SciRes. JWARP  M. M. RAHMAN, A. Q. M. MAHBUB Copyright © 2012 SciRes. JWARP 574 Table 1. Calculation of depletion rate of maximum water level elevation (wet season) in study area. Name of the Well Water Level (ft) Water Level (ft) Difference (ft) Rate of Depletion (ft/y) BWDB Well ID 1983 2010 GT8194046 3.54 45.17 41.63 1.54 GT8194048 22 53.04 31.04 1.15 GT8194049 8.98 42.96 33.98 1.26 BMDA Well 1987 2010 Talanda 8.50 41.67 33.17 1.44 Kamargaon 4.67 37.83 33.16 1.44 Average Rate of Depletion of Water Level in Wet Season 1.37 Data source: BWDB, BMDA. Table 2. Calculation of depletion rate of minimum water level elevation (dry season) in study area. Name of the Well Water Level (ft) Water Level (ft) Difference (ft) Rate of Depletion (ft/y) BWDB Well ID 1983 2010 GT8194046 22 46.22 24.22 0.89 GT8194048 31 53.04 22.04 0.82 GT8194049 26.33 43.95 17.62 0.65 BMDA Well 1987 2010 Talanda 31.58 42.83 11.25 0.49 Kamargaon 23.17 40.50 17.33 0.75 Average Rate of Depletion of Water Level in Dry Season 0.72 Data source: BWDB, BMDA. Depletion rate of minimum water level elevation cal- culated from 1983-2010 using three piezometers of BWDB is below one ft/y. From the well GT8194046 calculated depletion rate is 0.89 ft/y and according to well GT8194048 and GT8194049 the rate is 0.82 ft/y and 0.65 ft/y respectively in dry season. Two BMDA wells also show depletion of groundwater level in dry season and the rate of depletion is 0.49 ft/y in Talanda well and 0.75 ft/y in Haripur well of Kamargaon Union. The well of Talanda is showing lowest depletion rate in dry season may be due to very close location from the River Shiba and wetland Beelkumari which give this area a higher recharging rate than all other parts of the study area lo- cated in a distant location from wetland and river (see Figure 2). From five wells of two organizations, average value of rate of depletion in dry season is 0.72 ft/y in Tanore Upazila. From the groundwater monitoring well data, average depletion rate of maximum water level elevation is 1.37 ft/y and average depletion rate of minimum water level elevation in Tanore is 0.72 ft/y. Depletion rate in dry and wet season is different. Rate of depletion in wet season is higher than the rate in dry season. From this nature of depletion it can be stated that groundwater level in the study area is depleting in an accelerating rate from year to year. Recharging of groundwater occur mainly in between four monsoon months June-September (about 80% of rainfall occur in monsoon period in Bangladesh) and replenishment of water level by annual rainfall is over- ruled by annual increasing amount of withdrawal. As a result, all five wells of two organizations located in dif- ferent parts of the upazila are showing depleting nature of groundwater level. The average value of yearly maximum rate of deple- tion and minimum rate of depletion in Tanore Upazila from five monitoring wells of two different organizations spread over different parts of the study area is 1.04 ft/y. 4. Conclusions Result shows that both maximum and minimum ground- water levels of the study area are depleting. Average de-  M. M. RAHMAN, A. Q. M. MAHBUB 575 pletion rate of maximum water level 1.37 ft/y is much higher than average depletion rate of minimum water level, which is 0.72 ft/y. Agriculture is very important in the context of Bangladesh because to feed a huge number of population. Agricultural sector also provide employ- ment to a huge number of unskilled and semi-skilled la- bors so in this context it is also important. Due to expan- sion of groundwater irrigation cropping intensity of the study area have crossed even national level, but it is also the prime reason for groundwater depletion of the study area. Intrusion of saline water is not an issue for the area which located in a distant location from the sea and for high thickness of clay layer, land subsidence risk is also comparatively low due to groundwater depletion. Exces- sive withdrawal is lowering water level in the area suc- cessively and surface water bodies can be severely af- fected by this process. Crop diversification from water consuming crop (paddy) to less water consuming crops (vegetables, fruits etc.), artificial recharging, increasing dependency on surface water, increasing irrigation efficiency including applica- tion of Alternate Wetting and Drying (AWD) method, rainwater harvesting etc, can be option for the study area. 5. Acknowledgements The authors are thankful to Professor Dr. Kazi Matin U. Ahmed, Department of Geology of University of Dhaka; Barind Multipurpose Development Authority (BMDA) and Bangladesh Meteorological Department (BMD) for financial and other supports. REFERENCES [1] M. Shamsudduha, R. G. Taylor, K. M. Ahmed and A. Zahid, “The Impact of Intensive Groundwater Abstraction on Recharge to a Shallow Regional Aquifer System: Evi- dence from Bangladesh,” Hydrogeology Journal, Vol. 19, No. 4, 2011, pp. 901-916. doi:10.1007/s10040-011-0723-4 [2] UNDP (United Nation Development Programme), “Ground- water Survey: The Hydro-Geological Conditions of Bang- ladesh,” Technical Report, UNDP, New York, 1982, DP/UN/BGD-74-009/1. [3] BADC (Bangladesh Agricultural Development Corpora- tion), “Minor Irrigation Survey Report 2009-10,” BADC, Dhaka, 2010, p. 3. [4] A. M. Ali, “Fundamentals of Irrigation and On-farm Water Management,” Springer-Verlag New York Inc., New York, Vol. 1, 2011, p. 18. [5] IBRD (International Bank for Reconstruction and Devel- opment) IBRD-IDA Tube Well Project, EPADC, East Pakistan, 1970, Vol. PA-49a, Annex 11, p. 1. [6] K. B. S. Rasheed, “Bangladesh: Resource and Environ- mental Profile,” A.H. Development Publishing House, Dhaka, 2008. [7] K. M. Ahmed, “Barind Tract,” 2006. http://www.banglapedia.org/httpdocs/HT/B_0309.HTM [8] K. M. Ahmed, M. A. Hossain, “Groundwater,” 2006. http://www.banglapedia.org/httpdocs/HT/G_0209.HTM [9] BMDA (Barind Multipurpose Development Authority), “Borandro Authority Past-Present,” BMDA Rajshahi, 2006, p. 35. [10] BMDA (Barind Multipurpose Development Authority), 2011. http://www.bmda.gov.bd/ [11] SRDI (Soil Resource Development Institute), “Upazila Land and Soil Resource Utilization Guide: Tanore, Ra- jshahi,” SRDI, 2000, p. 10. [12] SRDI (Soil Resource Development Institute), “Land and Soil Statistical Appraisal Book of Bangladesh,” SRDI, Dhaka, 2010, p. 155. [13] BBS (Bangladesh Bureau of Statistics), “Cropping Inten- sity of Bangladesh,” 2010. http://www.brri.gov.bd/info_services/rice_database/Crop ping%20Intensity.pdf Copyright © 2012 SciRes. JWARP |