International Journal of Geosciences
Vol. 4 No. 2 (2013) , Article ID: 29486 , 18 pages DOI:10.4236/ijg.2013.42047
The Effect of Climate on the Chemical Composition of the Coral Reefs around Kubbar Island—Kuwait
Science Department, The Public Authority for Applied Education and Training (PAEET), Adailiyah, Kuwait
Email: ajharock2011@hotmail.com
Received October 15, 2012; revised December 4, 2012; accepted January 7, 2013
Keywords: Kubbar Island; Back Reef; Coral Debris; Seasonal Chemical Variations
ABSTRACT
Thick recent carbonate sediments cover all the intertidal and subtidal zones consist of mainly different shell and coral reef debris. The chemical investigations of the coral fragments were done on controlled bases, which depend on the coral size and seasons, in order to elucidate the effect of weather parameters on the coral reefs. Geochemical investigation indicated that corals gathered from high-tide mark are mainly contaminated by copper, cobalt, and chromium and the corals gathered from low-tide mark are contaminated by lead and zinc. All the analyzed coral samples are contaminated by copper. The major contamination sights by heavy metals are related to the weather pattern around the islands. Calcium concentration in all the corals indicates a low-Magnesium calcite or aragonite composition, except for some coral samples which were gathered during October from the high-tide mark. Trace element concentration levels show high concentrations at sights of low-wave action around the island during the various seasons. Chemical analysis on the coral derbies indicates compositional variations regarding calcium and magnesium mole% between the seasons and at different locations and it is dependant on wind direction and water salinity. Some localities are iron rich others are aluminum and potassium rich. Generally, aluminum, iron, and potassium occur in lower quantities than the other elements. Therefore, all the chemical data regarding trace elements indicate relationship to weather and environmental parameters.
1. Introduction
The southern section of Kuwaiti waters includes three islands; Kubbar, Qaruh and Umm Al-Maradim. Large number of coral reef colonies is flourishing in the subtidal zones of the three islands but most pronounce around Qaruh Island. Kubbar Island is relatively small with an area of 0.9 km2 and a maximum elevation above sea level that equals to 4.5 m. The distance between Kubbar and Failaka Island is 36 km; it is located at approximately 34 km perpendicularly east from Al-Fahaihil area (Figure 1). It is considered a natural heaven for many species of different plants, great number of seagulls, birds, and the best nesting grounds for different types of sea turtles. Natural vegetation and coral reef colonies are considered the principal features of Kubbar Island (Figure 2). It is undeveloped except for the presence of landing field for helicopter, guarding tower and a jetty.
The intertidal zone has a width ranging between 5 to 11 m. The island beaches are relatively tranquil and covered by coarse to medium-grained calcareous sands (Figure 2(C)). The carbonate constituents are mainly represented by shell fragments and coral reef debris, and to a lesser extent, some oolitic grains and quartz sand grains. The supratidal and inland zones form a raised platform of about 4.8 m above sea level, and is characterized by moderately to steep banks with a dipping angle ranging from 40˚ to 75˚. Fieldwork observation indicated the occurrence of large number of bullet shells, as well as, empty cans is seen at the supratidal and inland zones, which resulted from the shooting of sea birds by many island visitors and the dumping of their garbage. Many pebbles of various sizes are found scattered among the surface sediment, which consists mainly of quartz and igneous rock fragments and sedimentary rock fragments. The majority of the sedimentary pebbles were mainly produced by the reworking action of waves on the beach rocks, whereas the quartz and igneous pebbles were extracted from the constructing materials used along the beaches. The island is characterized by a strategic and touristic importance, and considered significant fisheries. The diverse types of fish and the abundance of marine life made the island site for diving and fishing, as well as harmful human activities on the mainland of the island. Therefore, safeguarding the coral reefs of the island
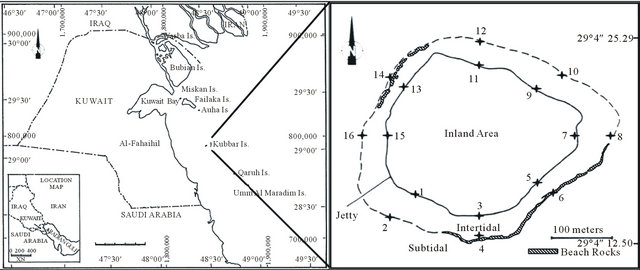
(A) (B) Figure 1. Showing, (A) Map of Kuwait and the location of Kubbar Island; (B) Sample location and the different zones around Kubbar Island.
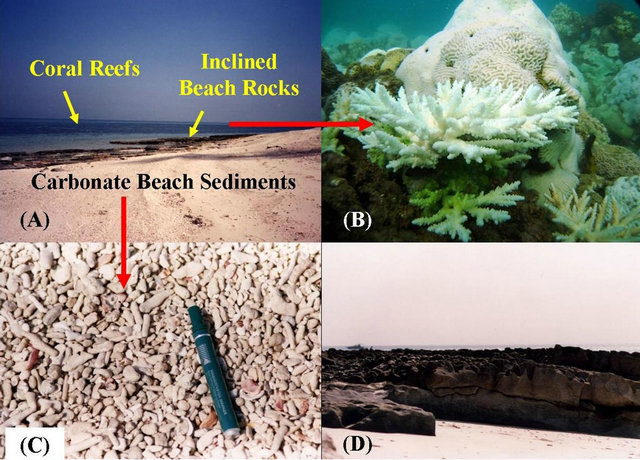
Figure 2. Field photomicrographs from Kubbar Island showing, (A) Carbonate beaches, inclined beach rocks at the southern tip of the island, and the coral reef around the island; (B) Underwater photographs for corals from the coral reef around the island; (C) Carbonate beach sediments; (D) Inclined beach rocks.
should be the main priority, because these corals are the main reason for the existence of many types of fauna and flora species in the waters around it. Moreover, the aquatic biota as well as land dwelling animals and bird species are greatly influenced by toxic materials in their host sediments, which are the result of human activities. All of these activities are greatly noticed and they are affecting the well-being and the existence of the coral reefs around the island, as well as the existence of many types of bird communities and other land and marine fauna and flora.
Ref. [1] elucidated the effect of weather variations such as prevailing wind direction and temperature, and water salinity on the coral colonies and the nature of the accumulated sediments along the shores of the southern islands. Moreover, [1] indicated that the petrographic study on intertidal sediments from all the southern islands specify variation in grain size, micritization and boring extent of the carbonate constituents between the seasons. The present study revealed that the presence of halite and gypsum crystals as cements and detached crystals is higher during June and October. The results also indicate differences in grain size along the shores of the islands, which is dependent on the prevailing wind direction and wave action [1-3].
The corals of Kuwait are living in a stressed environment, which is subject to high and temperatures and also oil pollution. Ref. [4] concluded that the major problems facing these corals at present are anchor damage to corals, over fishing and litter. Refs. [5,6] indicated that Anchors have destroyed large tracts of the reefs at all sites, and over-fishing has reduced populations of large predators, such that few fish greater than 20 cm are seen. They also postulated that oil pollution has not caused massive mortalities to reefs, even though most were in the path of the massive oil spill during the Gulf War. Ref. [6] postulated that, the reefs of Kuwait are exposed to a very heavy load of particles due to the shallow water environment and input from the Shatt Al-Arab. The interest of studying the affect of weather parameters on corals arises from the importance of coral reefs for the support of marine life, hence the productivity of the marine environment and the availability of marine food resources.
The purpose of this research is to investigate the variations in chemical composition of the corals according to the changes in climate, especially temperature, wind pattern and water temperature, salinity and the pollution degree these corals are affected with.
2. Material and Methods
2.1. Sample Collection
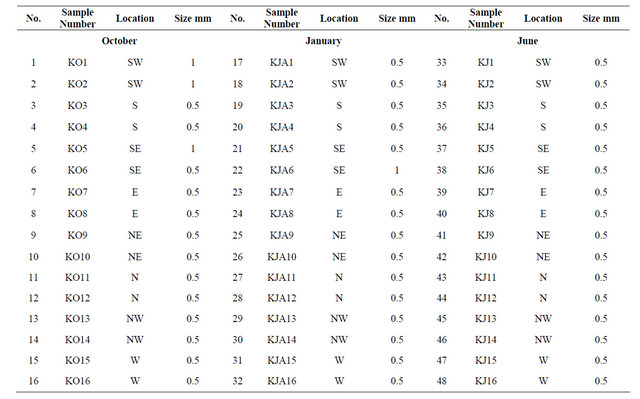
The intertidal sediment samples were gathered from the eight geographic quadrants: North, South, East, West, Northeast, Northwest, Southeast, and Southwest. Normally two sediment samples were gathered at each location, one from the highest tidemark and one from the low-tide mark within the intertidal zone of Kubbar Island, odd numbers referred to high-tide locations and even numbers for low-tide locations (Figure 1(B)). The total number of gathered sediment samples is 48 and is from three different seasons. The abbreviations used in tables K, KO, KJA and KJ are referred to Kubbar, October coral samples, January coral samples and June coral samples, respectively. Sampling was carried out after drawing a square with sides equal to 30 cm (30 cm ´ 30 cm), and the depth of sediment samples collected from this square should not exceed 2 cm.
2.2. Chemical Investigations
This study is based on chemically analyzing all coral fragments of the size portion 0.5 mm (controlling factor) from high-tide and low-tide points from all the eight geographic directions. Some sediment samples lack coral sizes of 0.5 mm, therefore the researcher separated corals from the 2 mm and 1 mm size portions (Table 1). A total of 48 coral samples were analyzed by two different methods to measure the total Ca and Mg, trace elements (Na, Fe, Sr, Al, K), and heavy metals (Cu, Pb, Zn, Co and Cr) concentrations. The major elements and the trace elements were analyzed by using Inductive Coupled Plasma-optical emission spectrometric method (ICP). Few bulk sediment samples were analyzed by X-Ray diffraction method to determine the mineral constituent. BDL in tables is referred to below detection limits.
3. Meteorology and Oceanography
The Arabian Gulf is a 1000 km long and 200 - 300 km wide open shelf in an arid subtropical area [7,8]. Refs. [7,8] also mentioned that the sea floor of the Arabian Gulf slopes gently northwards on the west, with an average overall depth of about 35 m. Maximum depth at 100 m occurs along the Iranian coast [7,8]. Normally the beaches along the Arabian Gulf coasts are exposed to the strong northwesterly winds and the 2 m spring tides, and are composed of coarse sand with aeolian quartz, ooids, shell debris, and intraclasts [9]. In very arid regions wind
Table 1. Separated coral fragments from all locations around Kubbar Islands used in chemical analysis.
plays a significant role in redistributing sediments.
Kuwait is situated on the northwestern shore of the Arabian Gulf, and Kubbar Island lies at the southern sea area of Kuwait at 29˚ North (Figure 1). Kuwait is mainly characterized by hot and dry climate, and affected by two main wind directions through out the seasons. These are the “Shamal” wind (blowing from the northwest direction) and the “Kose” wind (blowing from the southeast direction). The mean temperature reaches 45˚C in July and August, and 12˚C in winter [10]. Ref. [11] pointed out that the mean annual temperature of Kuwait’s surface water is 23.8˚C, with maximum temperature in July and August (30.5˚C - 36˚C) and minimum temperature in January and February (10˚C - 14˚C).
The weather changes throughout the year and the corals around Kubbar Island are affected by different weather patterns. It is noted that during the months following October (November, December and January), temperature will subside and humidity increase, where the lowest mean temperature = 1.41˚, mean highest temperature = 26.16˚, mean humidity = 89.71% [12]. This weather pattern will results in the lack of oxygen and nutrients that corals require, hence the death of the coral polyps. The mean rain-fall precipitation from November to January equals to 112.09 mm [12]. There is another weather pattern prevailing in Kuwait after January. During February and March temperature will be moderate that boosts the growth of algae (mean low temperature = 1.09˚ and mean highest temperature = 25.96˚) [12]. Then, during April and May there will be the monsoon season (“Sarrayat”) that is known for its high wind activitywave action and thunder rainstorms. The mean rainfall precipitation from February to April equals to 112.09 mm [12].
In addition to extreme temperatures, seawater salinity around the island also fluctuates, but is generally high (average high = 43.43%, average low = 39.06%). Ref. [13] revealed that mean annual salinity of Kuwait’s water is 41.6 psu, however, it could reach up to 45 psu. Ref. [14] attributed abnormal salinities throughout the Arabian Gulf to the excessive evaporation and partial isolation from the Indian Ocean. Ref. [10] studied the near shore wave characteristics and tidal currents around the islands. They concluded that the high wave energy and low wave energy were found in the western and eastern areas of the islands. Generally, the prevailing winds (the “Shamal”) blow from the Northwest and provide the dominant energy input with wave-effectiveness limits at about 20 - 30 m, primarily controlling facies patterns [9].
4. Petrography
The petrographic study was an excellent tool to determine the nature of the sediments, composition, and environment of deposition, behavior of deposition and differences and similarities between the depositional sights along the shores of the island. It indicated that the intertidal sediments from all locations share the same bioclastic components and these are divided into major and minor components, and indicative of reef to back-reef depositional environment.
The major bioclastic composition include; various types of corals, coralline algae, molluscs as bivalves and gastropods, and different types of echinoderm spines. The intragranular porosity of some bioclasts are either cemented by acicular aragonite crystals or filled by micrite, the bioclasts are affected by micritization and burrowing. The most important finding is the rosette-shaped high-Mg calcite cement and the longitudinal aragonite crystals seen by the Scanning Electron Microscope, [3].
The minor bioclastic components are foraminifera, brachiopods and ostracode tests. The SEM study indicated that the pore spaces of bioclasts are filled by finer organisms such as radiolarians, foraminifera, bryozoans, and Coccolithis (Figure 3). The non-bioclastic components consist mainly of intraclasts of various types and sizes, in addition to some minor oolitic grains and pellets. The most dominant nonclastic constituent within the sediment samples is quartz.
The study by polarizing microscope indicated that the origin of quartz grains is mainly igneous and metamorphic, and they are mainly rounded to well rounded grains, although some angular quartz grains do exist. The majority of quartz grains are of aeolian origin, especially the grains that are of fine sand to silt sizes which are windblown from northern Kuwait. Other nonclastic components include heavy minerals, metallic particles, rusty iron particles, and feldspars. Rusty iron particles tend to be the dominant grins among these three constituents.
The sediments gathered in October and June show very high amount of cubic and prismatic crystals especially in the sediment portions of 0.063 and 0.032 mm namely halite, calcite and some gypsum. The existence of such crystals is an indication of high temperatures and salinity. The majority of crystals are found free, not attached to the grains composing the sediment samples.
5. Geochemistry
Two major elements (Ca and Mg), five trace elements (Na, Sr, Al, Fe, and K), and five heavy metals (Pb, Zn, Cu, Co, and Cr) were analysed for all the collected coral samples during all seasons. The purpose of chemical analysis of the corals is to identify any chemical variations in corals composition and effect of pollution on them.
5.1. Major Carbonate Elements (Ca and Mg)
CaCO3 concentration in all coral samples gathered from
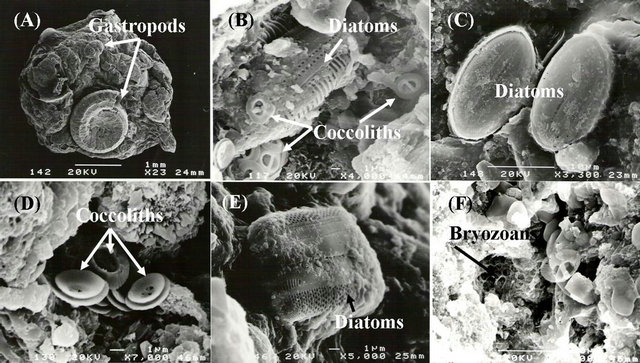
Figure 3. Backscattered images from the SEM showing different organisms: (A) Gastropods; (B) Diatoms and coccoliths; (C) Diatoms; (D) Coccoliths; (E) Diatoms; (F) Bryozoans.
high-tide mark range between 94.759 - 98.35 Mole% with an average mean equals to 96.691 ± 1.0 (Table 2). Coral Samples gathered during October from high tide mark include CaCO3 concentrations that range from 94.759 - 98.10 Mole% with an average mean value equals to 96.652 ±1.16 Mole% (Table 3). Coral samples gathered during June from high-tide mark include CaCO3 concentrations that range from 94.963 - 98.35 Mole% with an average mean value equals to 96.756 ± 1.39 Mole% (Table 3). Coral samples gathered during January from high-tide mark include CaCO3 concentrations that range from 95.087 - 97.90 Mole% with an average mean value equals to 96.665 ± 0.80 Mole% (Table 3).
Table 2 and Figure 4, shows that although the hightide corals are slightly Mg-rich, they show nearly the same relationship during all the seasons. Figure 4(A) show that there is CaCO3 enrichment at the following locations: NE, SE, and NW, while corals from all the other locations are enriched in Mg.
The concentration of CaCO3 corals gathered from low-tide range between 97.644 - 99.02 Mole% with an average mean equals to 98.458 ± 1.0 (Table 4). Coral samples gathered during October from low-tide mark include CaCO3 concentrations that range from 98.013 - 98.729 Mole% with an average mean value equals to 98.4 ± 0.25 Mole% (Table 3). Coral samples gathered during June from low-tide mark include CaCO3 concentrations that range from 97.644 - 98.422 Mole% with an average mean value equals to 98.213 ± 0.26 Mole% (Table 3). Coral samples gathered during January from low-tide mark include CaCO3 concentrations that range from 98.388-99.02 Mole% with an average mean value equals to 98.762 ± 0.21 Mole% (Table 3). Corals gathered from the low-tide during October and January share the same relationship, while corals gathered during June show an antipathetic relationship to corals gathered from the high-tide (Figure 4(B)).
Figure 5 show the distribution of CaCO3 in corals according to the different seasons. Figure 5(A) indicate that all the corals gathered from the NE, SW, NW during October contain the highest CaCO3 concentrations, while all other locations are enriched in Mg. Figure 5(B) indicate that although low-tide sediments has nearly the same Ca concentration, the corals gathered from the high-tide has variable CaCO3 concentration and show an antipathetic relationship with low-tide corals. Figure 5(C) show that corals gathered during October has the same relationship with corals gathered during January.
5.2. Trace Elements Concentrations
Sodium concentration in all coral samples gathered from high-tide mark range from 2780 - 23120 ppm with an average mean equals to 8089 ± 4702 ppm (Table 2). Coral samples gathered during October from high tide mark include Na concentrations that range from 3835 - 11730 ppm with an average mean value equals to 8753.25 ± 3116.47 ppm (Table 3). Coral samples gathered during June from high-tide mark include Na concentrations that range from 2780-23120 ppm with an average mean value equals to 8211.38 ± 6782.26 ppm (Table 3). Coral samples gathered during January from high-tide mark include Na concentrations that range from 3131 - 13770 ppm with an average mean value equals to 7303.63 ± 3961.41 ppm (Table 3). Sodium concentration in corals gathered during June and January share a sympathetic relationship at all locations, where all the SE and NW coral samples show a decrease in Na concentrations and all other locations show an increase in Na concentrations (Figure 6(A)). The highest Na concentrations were encountered at the western direction in corals gathered during June and January. The lowest Na concentration is encountered in
Table 2. Major, trace and heavy elements concentrations in the coral debris from high-tide mark around Kubbar Island.
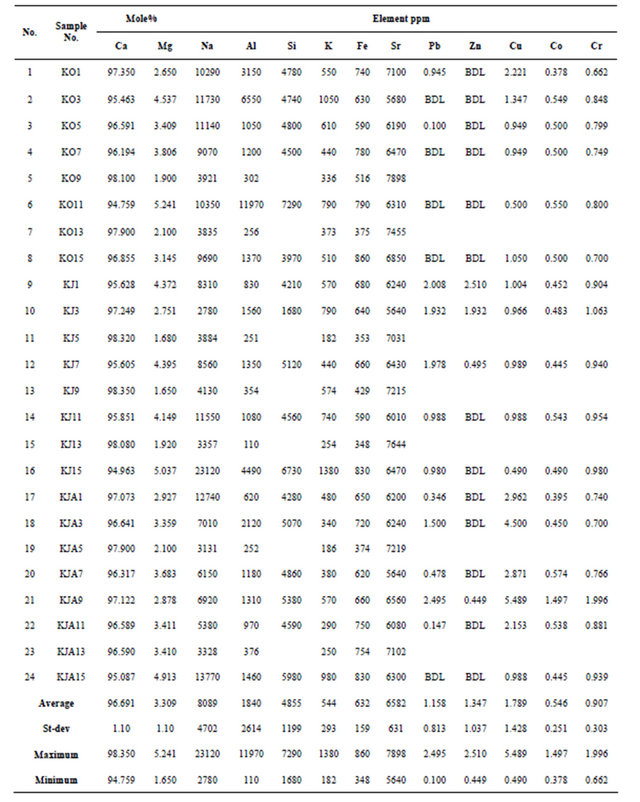
Table 3. Statistical data for all the major and trace elements, and heavy metals within high-tide and low-tide coral samples—Kubbar Island.
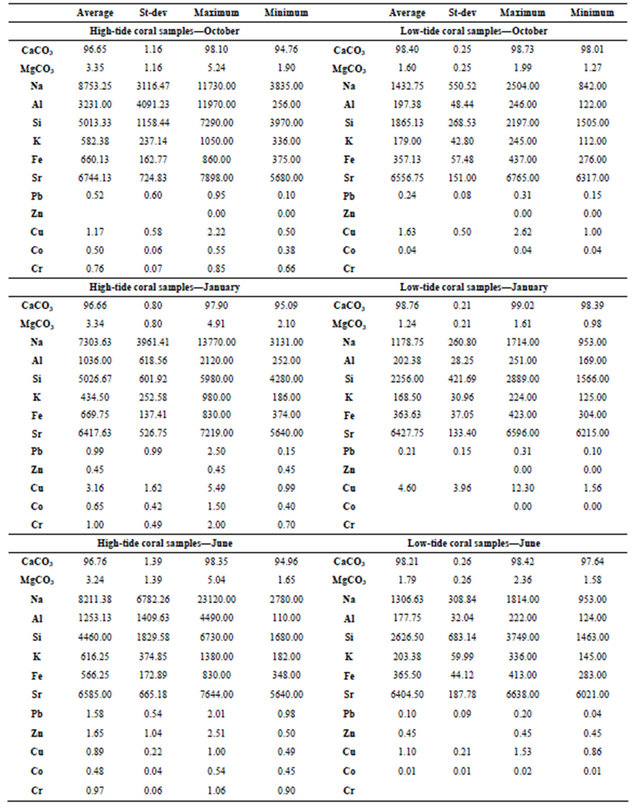
Table 4. Major, trace and heavy elements concentrations in the coral debris from low-tide mark around Kubbar Island.
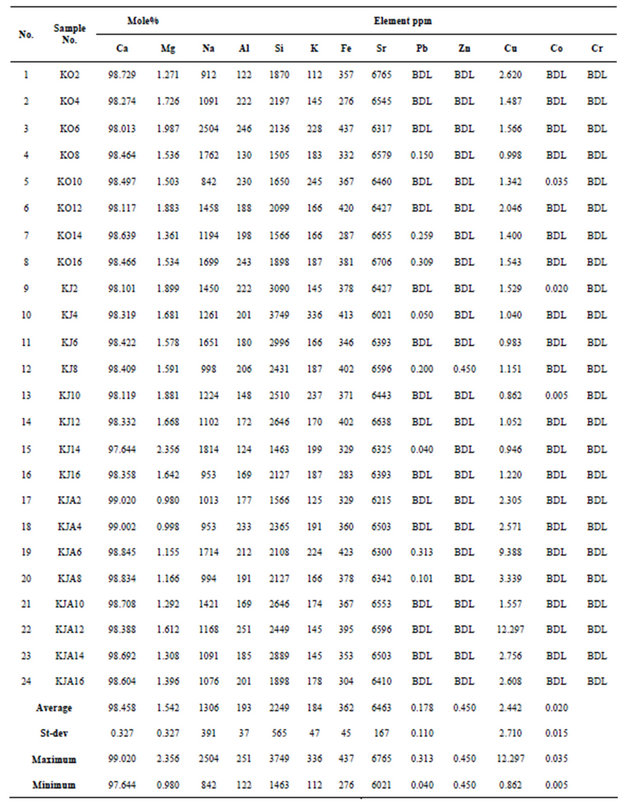
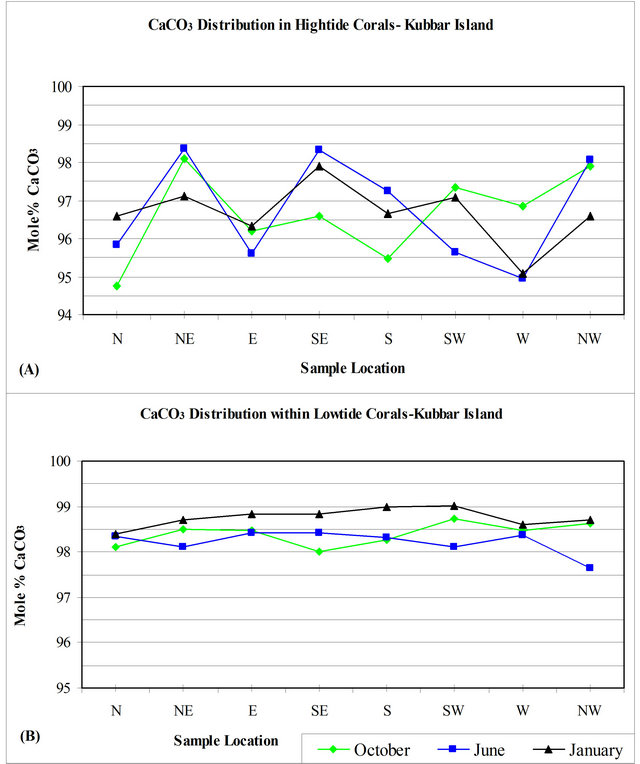
Figure 4. Distribution of calcium carbonate Mole% in corals collected from Kubbar Island.
corals gathered from the NW direction during all the seasons (Figure 6(A)).
Sodium range in all low-tide coral samples from 842 - 2504 ppm with an average mean equals to 1306 ± 391 (Table 4).
Corals samples gathered during October from low-tide mark include Na concentrations that range from 842 - 2504 ppm with an average mean value equals to 1432.75 ± 550.52 ppm (Table 3). Coral samples gathered during June from low-tide mark include Na concentrations that range from 953 - 1814 ppm with an average mean value equals to 1306.63 ± 308.84 ppm (Table 3). Coral samples gathered during January from low-tide mark include Na concentrations that range from 953 - 1714 ppm with an average mean value equals to 1178.75 ± 260.80 ppm (Table 3). Sodium concentration in corals gathered during June and January share a sympathetic relationship at all locations (Figure 7(A)). Corals gathered during October show an antipathetic relationship to corals gathered during June and January, except for the South and the Southeast directions (Figure 7(A)).
Aluminum concentration in all coral samples gathered from high-tide mark range from 110 - 11970 ppm with an average mean equals to 1840 ± 2614 (Table 2). Coral samples gathered during October from high tide mark include Al concentrations that range from 256 - 11970 ppm with an average mean value equals to 3231 ± 4091.23 ppm (Table 3). Coral samples gathered during June from high tide mark include Al concentrations that range from 110 - 4490 ppm with an average mean value equals to 1253.13 ± 1409.63 ppm (Table 3). Coral samples gathered during January from high tide mark include Al concentrations that range from 252 - 2120 ppm with an average mean value equals to 1036 ± 618.56 ppm (Table 3). Aluminum concentration in corals gathered during October and June share a sympathetic relationship at all locations, except for the Western direction (Figure 6(B)). Corals gathered during January show an antipathetic relationship to corals gathered during October and June, except for the SE, S, SW, and NW directions (Figure 6(B)).
Aluminum range in all low-tide coral samples from
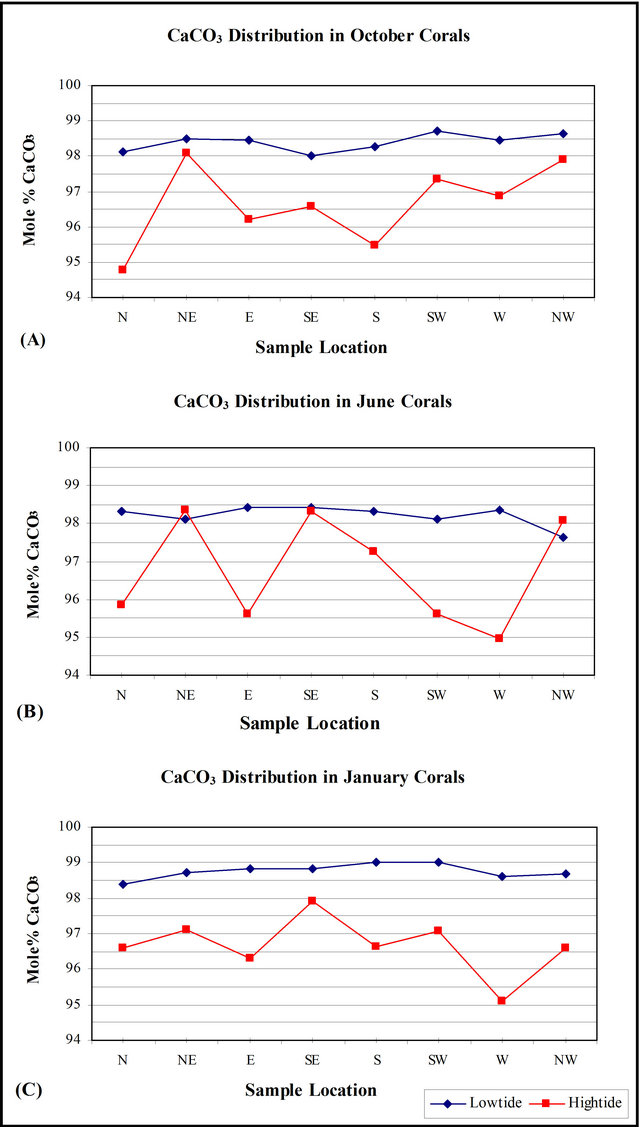
Figure 5. Correlation between calcium carbonate Mole% concentrations in corals collected from Kubbar Island according to the different seasons.
122 - 251 ppm with an average mean equals to 193 ± 37 (Table 4). Coral samples gathered during October from low-tide mark include Al concentrations that range from 122 - 246 ppm with an average mean value equals to 197.38 ± 48.44 ppm (Table 3). Coral samples gathered during June from low-tide mark include Al concentrations that range from 124 - 222 ppm with an average mean value equals to 177.75 ± 32.04 ppm (Table 3). Coral samples gathered during January from low-tide mark include Al concentrations that range from 169 - 251 ppm with an average mean value equals to 202.38 ± 28.25 ppm (Table 3). Aluminum concentration in corals
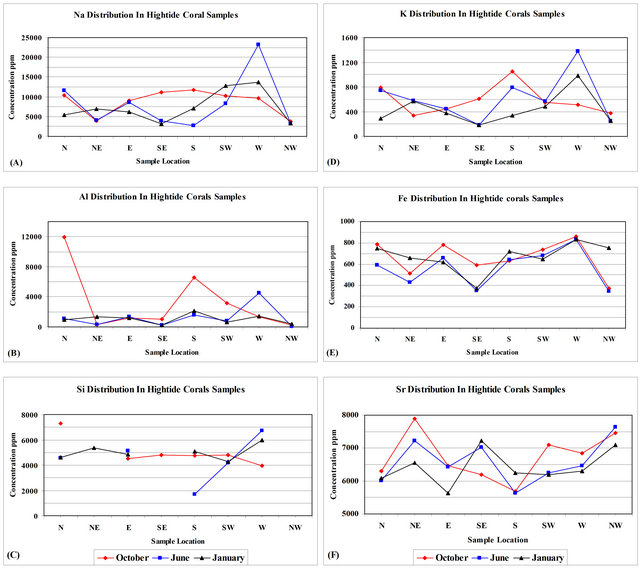
Figure 6. Trace elements distribution in coral gathered from high-tide mark from Kubbar Island—Kuwait.
gathered from low-tide mark during June and January share a sympathetic relationship at all locations, except the SE, SW, and W directions (Figure 7(B)). Corals gathered during October show an antipathetic relationship to corals gathered during June and January, except for the SE, SW and NW directions (Figure 7(B)).
Silicon concentration in all coral samples gathered from high-tide mark range from 1680 - 7290 ppm with an average mean equals to 4855 ± 1199 (Table 2). Coral samples gathered during October from high-tide mark include Si concentrations that range from 3970 - 7290 ppm with an average mean value equals to 5013.33 ± 1158.44 ppm (Table 3). Coral samples gathered during June from high-tide mark include Si concentrations that range from 1680 - 6730 ppm with an average mean value equals to 4460 ± 1829.58 ppm (Table 3). Coral samples gathered during January from high-tide mark include Si concentrations that range from 4280 - 5980 ppm with an average mean value equals to 5026.67 ± 601.92 ppm (Table 3).
Silicon range in all low-tide coral samples from 1463 - 3749 ppm with an average mean equals to 2249 ± 565 (Table 4). Coral samples gathered during October from low-tide mark include Si concentrations that range from 1505 - 2197 ppm with an average mean value equals to 1865.13 ± 268.53 ppm (Table 3). Coral samples gathered during June from low-tide mark include Si concentrations that range from 1463 - 3749 ppm with an average mean value equals to 2626.5 ± 683.14 ppm (Table 3). Coral samples gathered during January from low-tide mark include Si concentrations that range from 1566 - 2889 ppm with an average mean value equals to 2256 ±
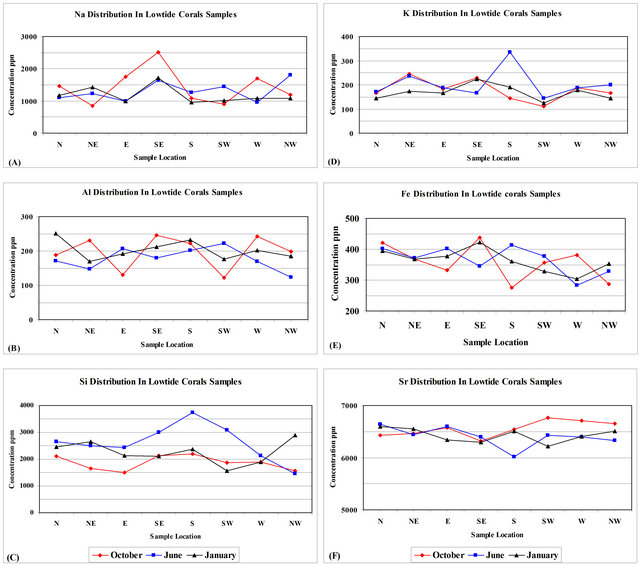
Figure 7. Trace elements distribution in coral gathered from low-tide mark from Kubbar Island—Kuwait.
421.69 ppm (Table 3). Silicon concentration in corals gathered during October and June share a sympathetic relationship at all locations, except for the western direction (Figure 7(C)). Corals gathered during January show a sympathetic relationship to corals gathered during October and June at all locations, except for the E, S and SW directions (Figure 7(C)).
Potassium concentration in all coral samples gathered from high-tide mark range from 182-1380 ppm with an average mean equals to 544 ± 293 (Table 2). Coral samples gathered during October from high-tide mark include K concentrations that range from 336 - 1050 ppm with an average mean value equals to 582.38 ± 237.14 ppm (Table 3). Coral samples gathered during June from high-tide mark include K concentrations that range from 182 - 1380 ppm with an average mean value equals to 616.25 ± 374.85 ppm (Table 3). Coral samples gathered during January from high-tide mark include K concentrations that range from 186 - 980 ppm with an average mean value equals to 252.58 ± 434.5 ppm (Table 3). Potassium concentration in corals gathered during the entire seasons share a sympathetic relationship at all locations, except for the N, NE and E directions (Figure 6 (D)).
Potassium range in all low-tide coral samples from 112-336 ppm with an average mean equals to 184 ± 47 (Table 4). Coral samples gathered during October from low-tide mark include K concentrations that range from 112 - 245 ppm with an average mean value equals to 179 ± 42.80 ppm (Table 3). Coral samples gathered during June from low-tide mark include K concentrations that range from 145 - 336 ppm with an average mean value equals to 203.38 ± 59.99 ppm (Table 3). Coral samples gathered during January from low-tide mark include K concentrations that range from 125 - 224 ppm with an average mean value equals to 168.5 ± 30.96 ppm (Table 3). Potassium concentration in corals gathered during October and January share a sympathetic relationship at all locations (Figure 7(D)). Corals gathered during June share a sympathetic relationship to corals gathered during October and January, except for the SE, S and NW directions (Figure 7(D)).
Iron concentration in all coral samples gathered from high-tide mark range from 348 - 860 ppm with an average mean equals to 632 ± 159 (Table 2). Coral samples gathered during October from high-tide mark include Fe concentrations that range from 375 - 860 ppm with an average mean value equals to 660.13 ± 162.77 ppm (Table 3). Coral samples gathered during June from hightide mark include Fe concentrations that range from 348 - 830 ppm with an average mean value equals to 566.25 ± 172.89 ppm (Table 3). Coral samples gathered during January from high-tide mark include Fe concentrations that range from 374 - 830 ppm with an average mean value equals to 669.75 ± 137.41 ppm (Table 3). Iron concentration in corals gathered during October and June share a sympathetic relationship at all locations (Figure 6(E)). Corals gathered during January share a sympathetic relationship to corals gathered during October and June, except for the East and the Southwest directions (Figure 6(E)).
Iron range in all low-tide coral samples from 276 - 437 ppm with an average mean equals to 362 ± 45 (Table 4). Coral samples gathered during October from lowtide mark include Fe concentrations that range from 276 - 437 ppm with an average mean value equals to 357.13 ± 57.48 ppm (Table 3). Coral samples gathered during June from low-tide mark include Fe concentrations that range from 283 - 413 ppm with an average mean value equals to 365.5 ± 44.12 ppm (Table 3). Coral samples gathered during January from low-tide mark include Fe concentrations that range from 304 - 423 ppm with an average mean value equals to 363.63 ± 37.05 ppm (Table 3). Iron concentration in corals gathered during June and January share a sympathetic relationship at all locations, except for the Southeast and the South directions (Figure 7(E)). Corals gathered during October show an antipathetic relationship to corals gathered during June, except for the North and the Northeast directions (Figure 7(E)).
Strontium concentration in all coral samples gathered from high-tide mark range from 5640 - 7898 ppm with an average mean equals to 6582 ± 631 (Table 2). Coral samples gathered during October from high-tide mark include Sr concentrations that range from 5680 - 7898 ppm with an average mean value equals to 6744.13 ± 724.83 ppm (Table 3). Coral samples gathered during June from high-tide mark include Sr concentrations that range from 5640 - 7644 ppm with an average mean value equals to 6585 ± 665.18 ppm (Table 3). Coral samples gathered during January from high-tide mark include Sr concentrations that range from 5640 - 7219 ppm with an average mean value equals to 6417.63 ± 526.75 ppm (Table 3). Strontium concentration in corals gathered during June and January share a sympathetic relationship at all locations, except for the Southwest direction (Figure 6(F)). Corals gathered during October share a sympathetic relationship to corals gathered during June and January, except for the Southeast and the West directions (Figure 6(E)).
Strontium range in all low-tide coral samples from 6021 - 6765 ppm with an average mean equals to 6463 ± 167 (Table 4). Coral samples gathered during October from low-tide mark include Sr concentrations that range from 6317 - 6765 ppm with an average mean value equals to 6556.75 ± 151 ppm (Table 3). Coral samples gathered during June from low-tide mark include Sr concentrations that range from 6021 - 6638 ppm with an average mean value equals to 6404.5 ± 187.78 ppm (Table 3). Coral samples gathered during January from lowtide mark include Sr concentrations that range from 6215 - 6596 ppm with an average mean value equals to 6427.75 ± 133.4 ppm (Table 3). Strontium concentration in corals gathered during October and June share a sympathetic relationship at all locations, except for the North, Northeast and South directions (Figure 7(F)). Corals gathered during January share an antipathetic relationship to corals gathered during October and June, except for the N, NE, SE, and S directions (Figure 7(E)).
5.3. Heavy Metals Concentrations
Lead concentration in all coral samples gathered from high-tide mark range from 0.100 - 2.495 ppm with an average mean equals to 1.158 ± 0.813 (Table 2). All the coral samples which were gathered during October from high-tide mark include Pb concentrations that are below the detection limit, except for two: SE = 0.10 ppm and SW = 0.95 ppm. Coral samples gathered during June from high-tide mark include Pb concentrations that range from 0.98 - 2.01 ppm with an average mean value equals to 1.58 ± 0.54 ppm (Table 3). Coral samples gathered during January from high-tide mark include Pb concentrations that range from 0.15 - 2.5 ppm with an average mean value equals to 0.99 ± 0.99 ppm (Table 3).
Lead concentrations range in all low-tide coral samples from 0.040 - 0.313 ppm with an average mean equals to 0.178 ± 0.110 (Table 4). Coral samples gathered during October from low-tide mark include Pb concentrations that range from 0.15 - 0.31 ppm with an average mean value equals to 0.24 ± 0.08 ppm (Table 3). Coral samples gathered during June from low-tide mark include Pb concentrations that range from 0.04 - 0.2 ppm with an average mean value equals to 0.1 ± 0.09 ppm (Table 3). Coral samples gathered during January from low-tide mark include Pb concentrations that range from 0.1 - 0.31 ppm with an average mean value equals to 0.21 ± 0.15 ppm (Table 3).
Zinc concentration in all coral samples gathered from high-tide mark range from 0.449 - 2.510 ppm with an average mean equals to 1.347 ± 1.037 (Table 2). All the coral samples which were gathered during October from high-tide mark include Zn concentrations that are below the detection limit. Coral samples gathered during June from high-tide mark include Zn concentrations that range from 0.50 - 2.51 ppm with an average mean value equals to 1.65 ± 1.04 ppm (Table 3). All the coral samples which were gathered during January from high-tide mark include Zn concentrations that are below the detection limit, except for one: NE = 0.449 ppm (Table 2).
All the low-tide corals have Zinc concentrations below the detection limit except for one which was gathered during June from the East direction and it is equal to 0.450 ppm (Table 4).
Copper concentration in all coral samples gathered from high-tide mark range from 0.49 - 5.489 ppm with an average mean equals to 1.789 ± 1.428 ppm (Table 2). Coral samples gathered during October from high-tide mark include Cu concentrations that range from 0.5 - 2.22 ppm with an average mean value equals to 1.17 ± 0.58 ppm (Table 3). Coral samples gathered during June from high-tide mark include Cu concentrations that range from 0.49 - 1.00 ppm with an average mean value equals to 0.89 ± 0.22 ppm (Table 3). Coral samples gathered during January from high-tide mark include Cu concentrations that range from 0.99 - 5.49 ppm with an average mean value equals to 3.16 ± 1.62 ppm (Table 3).
Copper range in all low-tide coral samples from 0.862 - 12.297 ppm with an average mean equals to 2.442 ± 2.71 ppm (Table 4). Coral samples gathered during October from low-tide mark include Cu concentrations that range from 1.00 - 2.62 ppm with an average mean value equals to 1.63 ± 0.5 ppm (Table 3). Coral samples gathered during June from low-tide mark include Cu concentrations that range from 0.86 - 1.53 ppm with an average mean value equals to 1.10 ± 0.21 ppm (Table 3). Coral samples gathered during January from low-tide mark include Cu concentrations that range from 1.56 - 12.3 ppm with an average mean value equals to 4.6 ± 3.96 ppm (Table 3).
Cobalt concentration in all coral samples gathered from high-tide mark range from 0.378 - 1.497 ppm with an average mean equals to 0.546 ± 0.251 ppm (Table 2). Coral samples gathered during October from high-tide mark include Co concentrations that range from 0.38 - 0.55 ppm with an average mean value equals to 0.50 ± 0.06 ppm (Table 3). Coral samples gathered during June from high-tide mark include Co concentrations that range from 0.45 - 0.54 ppm with an average mean value equals to 0.48 ± 0.04 ppm (Table 3). Coral samples gathered during January from high-tide mark include Co concentrations that range from 0.40 - 1.50 ppm with an average mean value equals to 0.42 ± 0.65 ppm (Table 3).
Cobalt range in all low-tide coral samples from 0.005 - 0.035 ppm with an average mean equals to 0.02 ± 0.015 ppm (Table 4). All the coral samples which were gathered during October from low-tide mark include cobalt concentrations that are below the detection limit, except for one: NE = 0.035 ppm. Coral samples gathered during June from low-tide mark include Co concentrations that range from 0.01 - 0.02 ppm with an average mean value equals to 0.01 ± 0.01 ppm (Table 3). All the coral samples which were gathered during January from low-tide mark include cobalt concentrations that are below the detection limit.
Chrome concentration in all coral samples gathered from high-tide mark range from 0.662 - 1.996 ppm with an average mean equals to 0.907 ± 0.303 (Table 2). Coral samples gathered during October from high-tide mark include Cr concentrations that range from 0.66 - 0.85 ppm with an average mean value equals to 0.76 ± 0.07 ppm (Table 3). Coral samples gathered during June from high-tide mark include Cr concentrations that range from 0.90 - 1.06 ppm with an average mean value equals to 0.97 ± 0.06 ppm (Table 3). Coral samples gathered during January from high-tide mark include Cr concentrations that range from 0.70 - 2.00 ppm with an average mean value equals to 1.00 ± 0.49 ppm (Table 3). All the low-tide corals which were gathered during all the seasons have chrome concentrations below the detection limit (Table 4).
Figure 8, pie charts for all heavy metals in high-tide coral debris which show contamination patterns according to the seasons. Figure 8(B) and (D) indicate that Cr and Co share the same relationship throughout the seasons with nearly equal number of contaminated coral samples. Figure 8, also shows that coral samples collected in January are the most contaminated by Cu and least contaminated by Pb, but Pb is the major contaminant in sediments gathered in June.
6. Discussion and Conclusions
Intertidal sediments in an arid to semi-arid environments are characterized basically by the following features: algal mats; crypt-algal laminates of irregular or even laminations initially bond by algae; birdseye or fenestral porosity; and desiccation features. Ref. [9] indicated
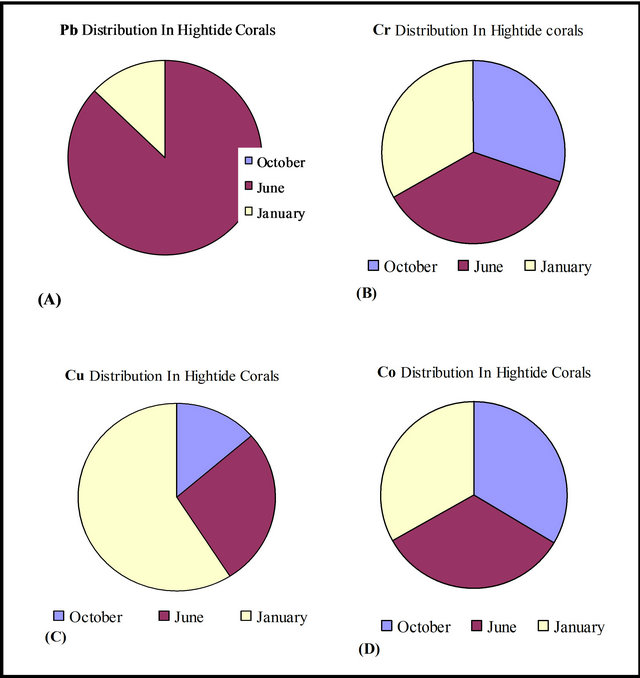
Figure 8. Heavy metals distribution in coral fragments gathered from high-tide mark—Kubbar Island.
that on the arid Trucial Coast-Arabian Gulf coarse lags of coral and shell debris are thickly encrusted with algae and bryozoans and infested by algal/faunal borers. Normally the beaches along the Arabian Gulf coasts are exposed to the strong north-westerly winds and the 2 m spring tides are composed of coarse sand with Aeolian quartz, ooids, shell debris, and intraclasts.
Modern coral reefs are rigid wave resistant structures produced and partially bound by organisms. The main biological and morphological zones of a reef complex have gradational boundaries and comprise the following zones: a) fore-reef (open deep-water side); b) reef-front (sloping reef in front of the deep-water side); c) reef-crest (highest-elevation point in the reef); reef-flat and backreef (the area include the top of the coral colony and trapped lagoon-landward side). The main reef builders at the present time are corals and coralline algae, including others of limited importance such as; sponges, serpulids, oysters and vermetide gastropods [15]. Sponges provide framework for reefs and mounds, and that sclerosponges are the dominant reef-forming organism in some modern Caribbean reefs. Borers, such as worms, sponges, and bivalves produce high amount of mud, while predatory fish produce sand and silt size particles that filters into the interstices of coral frame. Generally, the reef frames are organically bound, but pervasive early cements bind modern reefs. Specific types of ecological reefs include: 1) Patch reef which is small and circular in shape, 2) Pinnacle reef which is conical, 3) Barrier reef which is attached to a coast, and 4) Atoll which are enclosing a lagoon [15].
The main ecological requirements for the coral growth are: 1) Shallow water that are up to 80 m deep, but generally most growth tacks place within 10 m of the surface; 2) warm waters (18˚C - 36˚C), optimum growth is around 25˚; 3) normal salinities (27‰ - 40‰); 4) strong sunlight; 5) abundant nutrients; 6) stable substrate for attachment; 7) intense wave action; and 8) low turbidity [9,15,16].
In the case of Kubbar Island it is surrounded by well developed coral reef. Therefore, the intertidal zone is considered part of back-reef zone that fringes the island. The petrographic study of the intertidal sediments revealed that all sediment samples have the same composition, which includes mainly of coral debris and coralline algae fragments of various sizes, molluscs specially bivalves and gastropods, and echinoderm spines and plates. The intertidal sediments also include in low amounts and variations the following bioclasts: foraminifera, bryozoans, ostracodes, sponge spicules, annelids worm tubes, radiolarians, and coccoliths. Other clastic-non bioclastic components that exist in the sediments are oolitic grains and pellets as well as intraclasts. Therefore the carbonate constituents prevailed, indicated a back-reef depositional environment.
The petrographic study of all the sediment samples indicated that samples collected during June and January have more diverse types of coral debris than sediment samples collected during October. This may be the affect of wind speed, wave action and water temperature on the coral reefs. Adding to this the affect of coral grazers; echinoderms and predatory fish, this will cause the breakdown of the corals, hence the accumulation of various diverse types of coral debris on the beaches after October. All these factors will result in the brake down and accumulation of diverse types of corals debris first by killing the coral polyps by low temperatures, and grazing by fish, echinoderms, algae and indolithic bacteria, then brake down by wave action of the fragile reefs. It should be mentioned that, high numbers of echinoderms has been seen living in the intertidal zones during October and June field trips. These echinoderms graze on the coral polyps, which tend to leave the coral reefs bare.
The petrographic description of samples gathered during the various seasons indicated that although all the sediment samples share the same composition, especially type of major and minor bioclasts, different sedimentological processes affect them. It is noted that cementation by cubic halite, aragonite and high-Mg calcite crystals prevailed during October and June, as well as to, the precipitation of free crystals of halite, high-Mg calcite and aragonite during these seasons.
The second major variation is that the accumulation of yellow, yellowish-brown and yellowish-orange precipitate on some grains which is composed of micritic crystals of calcite, gypsum, and halite. It is noted that this precipitate is absent from sediments collected during October and June from Kubbar Island.
The third important processes are micritization and burrowing of bioclasts. Normally these processes are performed on the seabed by indolithic bacteria or algae, which tend to graze on the calcium carbonate that these bioclasts are composed of. It is very important to indicate that, micritization and burrowing of bioclasts is more significant in sediment samples gathered during January. This may be due to the relative decrease in wind speed before January, hence low wave action and calming of the sea, and due to the moderate water temperature that boosts the growth and flourishing of algae.
The geochemical investigations on corals gathered from the high-tide mark of Kubbar Island show magnesium enrichment at the N, E, S, and W during all the seasons, however, all the low-tide coral samples are Ca-rich at all locations and seasons. The maximum Mg concentrations are found at the Northern side during October and at the Western side during June and January, Which is due to higher agitation rates because of the prevailing north-westerly “Shamal” wind prior to October (July-September), and south-easterly winds prior to January (November and December) and June (AprilMay). The maximum Ca concentration is found at the NE direction during October and June, SE direction during June and January, and NW direction during October and June. It is important to mention that the SE and NW direction are the main locations affected by high wave action during all the seasons due to the effect of the prevailing wind directions throughout the year.
The geochemical work on Kubbar corals gathered from high-tide mark regarding trace elements show an antipathetic relationship between Ca concentration and Al, Fe, and K at all locations and all the seasons. Whereas, a sympathetic relationship is clear between Ca and Sr concentration in these corals, which indicate that when coral composition shift from Aragonite to high-Mg calcite it will be depleted in Sr. It is also concluded that when the corals are composed of Mg-calcite they are enriched in Al, Fe, and K, and when the composition is of Aragonite corals will be depleted in these elements.
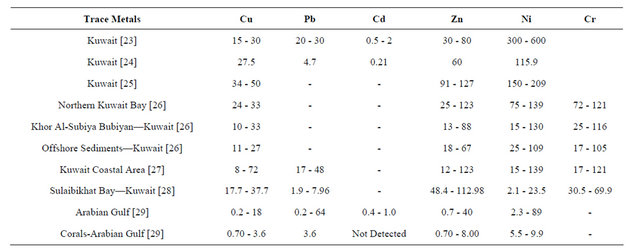
As for the geochemical work on heavy metals, Kubbar Island corals which were gathered from the high-tide mark show a type of heavy metal contamination by the following elements: Pb, Cu, Co, and Cr during all the seasons. Table 5 shows a comparison between heavy metal concentrations of Pb, Cu, Co, and Cr in corals from Kubbar Island with other parts of the world, and Table 6 show comparison between heavy metal concentration in sediments from the Arabian Gulf. It is clear that corals from Kubbar Island are the least contaminated in respect to Pb, Cu, Co, and Cr in comparison to the other data. But we can not exclude that these corals show a type of contamination which is related to weather and human influence around the island at some locations. Zn contamination is encountered only in four coral samples which were gathered during June 3 and January 1. It is also concluded that the Northeast direction show the highest contamination levels of all heavy metals during January because it represent the calmest direction of wave action. Moreover, June and October coral samples show the highest contamination levels in heavy metals within corals gathered from the South and West and Southwest were wave action also is reduced. Whereas, the highest contaminant during all the seasons in corals gathered from low-tide mark copper and the second is lead. There is no contamination by chrome in corals gathered from low-tide mark.
Table 5. Comparison of the concentration of Cu, Pb, Cd, Zn, and Cr in Coral fragments from Kubber Island and other areas of the World (ppm) [17-22].
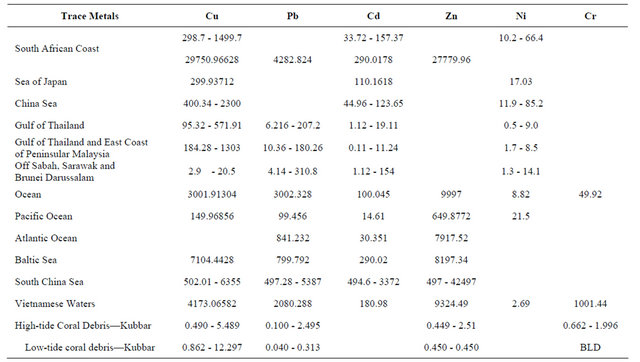
Table 6. Mean and range values of trace metal concentrations (mg/g = ppm) in unpolluted marine sediments of different areas in the Arabian Gulf [23-29].
7. Acknowledgements
The completion of this research would not have been possible without the help and support of Dr. Hamoud Fahd Al-Modhaf, Director General for The Authority for Applied Education and Training (PAAET), and Dr. Mishaal Al Mishaan, Deputy Director General for PAAET, for funding and the use of the facilities that made this research work possible.
REFERENCES
- A. J. Al-Langawi, “Seasonal Composition Variations in Intertidal Carbonate Sediments from the Southern Islands of Kuwait,” Final Report, The Authority for Applied Education and Training, Kuwait, 2004.
- A. J. Al-Langawi, “Seasonal Compositional Variations in Intertidal Carbonate Sediments from Qaruh Island-Kuwait,” Journal of the Sedimentological Society of Egypt, Vol. 15, 2006, pp. 103-120.
- A. J. Al-Langawi, “Seasonal Compositional Variations in Intertidal Carbonate Sediments from Kubbar Island-Kuwait,” Kuwait Journal of Science and Engineering, Vol. 34, 2007, pp. 111-142.
- P. L. Harrison, S. H. Alhazeem and A. H. Alsaffar, “The Ecology of Coral Reefs in Kuwait and the Effects of Stressors on Corals,” Report No. 4994, Kuwait Institute for Scientific Research KISR, Kuwait, 1997.
- N. J. Pilcher, S. Wilson, S. H. Alhazeem and M. R. Shokri, “Status of Coral Reefs in the Arabian/Persian Gulf and Arabian Sea Region (Middle East),” In: C. Wilkinson, Ed., Status of Coral Reefs of the World, Australian Institute of Marine Science, Australia, 2000, pp. 55-64.
- H. Rezai, S. Wilson, M. Claereboudt and B. Riegl, “Coral Reef Status in the Ropme Sea Area: Arabian/Persian Gulf, Gulf Of Oman and Arabian Sea,” In: C. Wilkinson, Ed., Status of Coral Reefs of the World, Vol. 1, Australian Institute of Marine Science, Townsville, 2004, pp. 155-170.
- B. H. Purser, “Sedimentation around Bathymetric Highs in the Southern Persian Gulf,” In: B. H. Purser, Ed., The Persian Gulf, Springer-Verlag, Berlin, 1973, pp. 157-178. doi:10.1007/978-3-642-65545-6_9
- B. H. Purser, “The Persian Gulf: Holocene Carbonate Sedimentation and Diagenesis in a Shallow Epicontinental Sea,” Springer-Verlag, Berlin, 1973, p. 471.
- B. W. Sellwood, “Shallow-Marine Carbonate Environments,” In: H. G. Reading, Ed., Sedimentary Environments and Facies, 2nd Edition, Blackwell Scientific Publications, Oxford, 1991, pp. 283-342.
- A. N. Al-Ghadban, M. Abdul Rahman and A. Salman, “Physiographic and Hydrographic Features of Kubber, Qaruh and Umm Al-Maradim Islands,” Kuwait Institute for Scientific Research, Report No. KISR 3419, Kuwait, 1990.
- F. Y. Al-Yamani and M. A. Saburova, “Illustrated Guide on the Benthic Diatoms of Kuwait’s Marine Environments,” Kuwait Institute for Scientific Research, Lucky Press, Kuwait, 2011.
- Personal Communication with Mr. Hassan Dashti, Meteorological Department—Kuwait Airport, 2013.
- F. Y. Al-Yamani, J. Bishop, E. Ramadhan, M. Al-Husaini and A. N. Al-Ghadban, “Oceanographic Atlas of Kuwait’s Waters,” Kuwait Institute for Scientific Research, Kuwait, 2004.
- H. G. Reading, “Sedimentary Environments and Facies,” 2nd Edition, Blackwell Scientific Publications, Oxford, 1991.
- M. E. Tucker, “Sedimentary Petrology: An Introduction,” Blackwell’s, Oxford, 1991.
- M. E. Tucker and P. Wright, “Carbonate Sedimentology,” Blackwell’s, Oxford, 1990. doi:10.1002/9781444314175
- L. Brugmann, “Zur Verteilung Einiger Schwer-Metalle in der Ostsee,” Acta Hydrochimica et Hydrobiologica, Vol. 5, 1977, pp. 3-21. doi:10.1002/aheh.19770050102
- K. W. Bruland, “Trace Elements in Seawater,” In: J. R. Riley and R. Chester, Eds., Chemical Oceanography, Academic Press, New York, 1983.
- L. D. Brugmann, “Nehring Beitrage zur Meere-skunde,” Heft, Vol. 39, 1977, pp. 89-97.
- T. X. Gian, “Untersuchungen zur Bestimmung von Metallspuren in Naturlichen Proben,” Dissertation, Rostock, 1987.
- W. Utoomprurkporn, M. Hungspreugs, S. Ratanachongkiat and A. Snidvongs, “Biogeochemical Implications of Dissolved Trace Metals Concentration and Distribution in South China Sea. Area I: Gulf of Thailand and East Coast of Peninsular Malaysia,” Proceedings of the First Technical Seminar on Marine Fishery Resources Survey in the South China Sea, Bangkok, 1997, pp. 86-99.
- W. Utoomprurkporn and A. Snidvongs, “Trace Metal Concentration and Distribution in Seawater of the South China Sea. Area II: Off Sabah, Sarawak und Brunei Darussalam,” Proceedings of the Second Technical Seminar on Marine Fishery Resources Survey in the South China Sea, Kuala Lumpur, 1998, pp.129-145.
- V. C. Anderlini, O. S. Mohammad, M. A. Zarba, R. A. Awayes and R. Al-Jalili, “An Assessment of Trace Metal Pollution in the Kuwait Marine Environment,” Marine Environment and Pollution, Proceedings of the First Arabian Gulf Conference on Environment and Pollution, Faculty of Science, KFAS and EPC, Kuwait, 1986, pp. 133- 156.
- P. Literathy, P. G. Jacob, A. Al-Bloushi and M. Zarba, “Screening of Pollutants in the Coastal Marine Environment of Kuwait,” EES-123 Final Report KIR 2900, Kuwait Institute for Scientific Research, Kuwait, 1989.
- A. Basham and S. Al-Lihaibi, “Trace Elements in Sediments of the Western Gulf,” Marine Pollution Bulletin, Vol. 27, 1993, pp. 103-107. doi:10.1016/0025-326X(93)90014-B
- S. Al-Muzaini and P. G. Jacob, “An Assessment of Toxic Metals Content in the Marine Sediments of the Shuaiba Industrial Area, Kuwait, after the Oil Spill during the Gulf War,” Water Science and Technology, Vol. 34, No. 7-8, 1996, pp. 203-210. doi:10.1016/S0273-1223(96)00746-9
- M. Al-Sarawi, M. Massoud and S. Khader, “Recent Trace Metal Pollution in Bottom Sediments of Sulaibikhat Bay, Kuwait,” Technology, Vol. 8, 2002, pp. 38-50.
- A. Z. Al-Zamel, M. A. Al-Sarawi, S. R. Khader and I. A. Al-Rifaiy, “Benthic Foraminifera from Polluted Marine Environment of Sulaibikhat Bay (Kuwait),” Environmental Monitoring and Assessment, Vol. 149, No. 1-4, 2009, pp. 395-409. doi:10.1007/s10661-008-0216-7
- F. Al-Abdali, M. S. Massoud and A. N. Al-Ghadban, “Bottom Sediments of the Arabian Gulf-III. Trace Metal Contents as Indicators of Pollution and Implications for the Effect and Fate of the Kuwait Oil Slick,” Environmental Pollution, Vol. 93, No. 3, 1996, pp. 285-301. doi:10.1016/S0269-7491(96)00046-2