American Journal of Plant Sciences
Vol.5 No.18(2014), Article
ID:49249,14
pages
DOI:10.4236/ajps.2014.518295
Transcriptome Analysis of Reaction Wood in Gymnosperms by Next-Generation Sequencing
Saori Sato1, Masato Yoshida1, Hideto Hiraide1, Kunio Ihara2, Hiroyuki Yamamoto1
1Graduate School of Bioagricultural Sciences, Nagoya University, Nagoya, Japan
2Center for Gene Research, Nagoya University, Nagoya, Japan
Email: yoshida@agr.nagoya-u.ac.jp
Copyright © 2014 by authors and Scientific Research Publishing Inc.
This work is licensed under the Creative Commons Attribution International License (CC BY).
http://creativecommons.org/licenses/by/4.0/


Received 18 June 2014; revised 21 July 2014; accepted 14 August 2014
ABSTRACT
Special xylem tissue called “compression wood” is formed on the lower side of inclined stems when gymnosperms grow on a slope. We investigated the molecular mechanism of compression wood formation. Transcriptome analysis by next-generation sequencing (NGS) was applied to the xylem of Chamaecyparis obtusa to develop a catalog of general gene expression in differentiating xylem during compression and normal wood formation. The sequencing output generated 234,924,605 reads and 40,602 contigs (mean size = 529 bp). Based on a sequence similarity search with known proteins, 54.2% (22,005) of the contigs showed homology with sequences in the databases. Of these annotated contigs, 19,293 contigs were assigned to Gene Ontology categories. Differential gene expression between the compression and normal wood libraries was analyzed by mapping the reads from each library to the assembled contigs. In total, 2875 contigs were identified as differentially expressed, including 1207 that were up-regulated and 1668 that were down-regulated in compression wood. We selected 30 genes and compared the transcript abundance between compression and normal wood by quantitative polymerase chain reaction analysis to validate the NGS results. We found that 27 of the 30 genes showed the same expression patterns as the original NGS results.
Keywords:Compression Wood, De Novo Assembly, Differentiating Xylem, RNA-Seq, Transcriptome

1. Introduction
A special xylem tissue called reaction wood is formed in leaning stems when trees grow on an incline. Reaction wood includes both tension wood in angiosperms and compression wood in gymnosperms such as Chamaecyparis obtusa, which was used in this study. Tension wood is usually produced on the upper side in leaning angiosperm stems, and compression wood is usually produced on the lower side in leaning gymnosperm stems [1] . Compression wood shows accelerated cambial growth on the lower side of the inclined stems, thicker tracheid walls, higher lignin content, and larger microfibril angles in the S2 layer compared with those of normal wood. The combination of these anatomical and chemical characteristics leads to high compressive growth stress in the compression wood region and acts to mechanically bend a leaning stem upward toward the vertical [2] .
To clarify the molecular mechanism of compression wood formation, some studies have screened for genes and proteins that exhibit cumulative changes during compression wood formation [3] -[7] . However, most of the screened genes play an immediate role in cell wall formation or metabolism. Thus, the trigger for compression wood formation (i.e., which kind of stimulus and how the stimulus reaches cells to start compression wood formation) remains unknown. In this study, we applied RNA-Seq to C. obtusa differentiating xylem and compared differences in transcript abundance between compression and normal wood. RNA-Seq is a term referring to transcriptome analysis by next-generation sequencing (NGS) and it allows for a higher dynamic range of detection compared to that of microarray and has good ability to detect novel transcripts [8] [9] . Therefore, RNA-Seq is considered to be applicable in finding genes involved in compression wood formation at low expression levels and thus cannot be detected by conventional methods. RNA-Seq analysis is applied primarily to organisms with complete reference genomes available, but advances in de novo assembly programs have enabled its application to non-model organisms with a lack of reference sequences. To date, de novo assembly and transcript profiling has been conducted in various non-model plant species such as Eucalyptus, Taxus, rubber trees, and garlic [10] -[13] .
In this study, we conducted a transcriptome analysis using NGS in C. obtusa to develop a catalog of general gene expression in the xylem including both compression and normal woods. Then, gene expression between compression and normal wood was compared based on the catalog. We discuss the mechanism of expression of the compression wood characters based on the results.
2. Materials and Methods
2.1. Plant Material and RNA Extraction
Experiments were conducted from April to June 2012 in a field owned by Nagoya University, Japan. Six 3-yearold Japanese cypress (C. obtusa) saplings (about 120 cm in height and 10 mm in diameter) were planted in plastic pots filled with a mixture of red soil and compost. The saplings were loosely fixed to a stake using wire to maintain vertical stem growth. Three saplings were artificially inclined after initiating cambial growth in May. The angle of inclination was 30˚ from the vertical. The remaining three saplings were grown vertically. Sampling was conducted during the most active period of cambial growth in June. After removing the bark, differentiating xylem tissues were scraped from the stems. The lower sides of the stems (compression wood) were collected from the inclined saplings, and both sides of the stems were collected from the vertical saplings (normal wood). These tissues were immediately frozen in liquid nitrogen and stored at –80˚C until use. Total RNA was extracted from 200 - 300 mg of xylem sample using an RNeasy Plant Mini Kit (Qiagen, Valencia, CA, USA) according to the manufacturer’s protocol. The RNA samples were treated with DNase I (TaKaRa Bio, Otsu, Japan) to digest contaminating genomic DNA. Poly(A)-containing mRNAs were purified from the total RNA samples using the Dynabeads mRNA Purification Kit (Invitrogen, Carlsbad, CA, USA). The quality of the isolated mRNA was checked using an Agilent 2100 Bioanalyzer RNA chip (Agilent Technologies, Santa Clara, CA, USA).
2.2. Library Preparation and Sequencing
mRNA was fragmented and used to generate libraries for NGS. The libraries of the fragments were obtained using the SOLiD Total RNA-Seq Kit (Life Technologies, Carlsbad, CA, USA). The procedure for this kit is based on hybridization of adapters, followed by reverse transcription and library amplification by polymerase chain reaction (PCR). Barcoded SOLiD 3’ Primers from the SOLiD RNA Barcoding Kit (Life Technologies) were used to distinguish the six samples. The cDNAs were selected by size using an AgencourtAMPure XP (Beckman Coulter, Brea, CA, USA) before and after library amplification. The yield and size distribution of the amplified DNA were assessed using an Agilent 2100 Bioanalyzer (Agilent Technologies). The pooled library was sequenced by multiplex paired-end sequencing on a flow cell using the 5500xl SOLiD system (Life Technologies). The sequence data were deposited in the DDBJ Sequence Read Archive under the accession number DRA001036.
2.3. De Novo Assembly
De novo sequence assembly was carried on all SOLiD reads from all libraries using the CLC Genomics Workbench (CLC Bio, Aarhus, Denmark). Minimum contig size was 200 bp. The CLC Genomics Workbench performed scaffolding using paired-end read information. We use the term “contigs” to refer to both contigs and scaffolds.
2.4. BLAST Search against Presently Available C. obtusa Sequences
All 5897 expressed sequence tag (EST) sequences of C. obtusa were downloaded from the PlantGDB [14] and used for a nucleotide BLAST search against 40,602 contigs using an E-value cutoff of 10–6.
2.5. Functional Annotation and Classification
Allassembled contigs were utilized for homology searches against protein databases such as non-redundant (Nr) and Swiss-Prot with the BLASTX program (E-value cutoff 10–6), and the aligning results were used to annotate the contigs. The functional annotation by gene ontology (GO) terms was performed using the Blast2GO program [15] . To complement the Blast-based annotations with domain-based annotations, InterProScan was used to merge the GO terms to the existing annotations. GO-slim reduction was used to reduce the amount of functional information and to summarize the functional content of a dataset. The ESTScan program was used to detect potential coding regions in the transcript sequences obtained by assembly [16] . The Transeq package from EMBOSS was employed to obtain amino acid sequences [17] . The sequences were aligned to the eukaryotic Clusters of Orthologous Groups of proteins (COG) database (E-value cutoff 10–6) to predict and classify possible functions [18] . Pathway assignments were performed according to the Kyoto Encyclopedia of Genes and Genomes (KEGG) pathway database (E-value cutoff 10–6) [19] . The WebMGA server was used to perform the eukaryotic COG and KEGG classifications [20] .
2.6. Normalization of Gene Expression Levels and Analysis of Differential Gene Expression
SOLiD reads from each library were mapped to the assembled contigs using the CLC Genomics Workbench (CLC Bio), and the reads mapped to each contig were counted. Normalizaiton and differential expression analysis between compression and normal wood samples was performed using R package TCC (ver. 1.0.0) with a false discovery rate (FDR) < 0.05 [21] .
2.7. Quantitative Real-Time PCR (qPCR) Validation of the Differentially Expressed Genes
The transcription profiles of the 30 selected genes were analyzed by qPCR. Six C. obtusa saplings were grown from April to June 2013 for quantification. Three saplings were artificially inclined at an angle (compression wood), and the remaining three saplings were grown vertically (normal wood). Sampling of the compression and normal wood was conducted 21, 25, and 28 days following initiation of the inclination stimulus. Total RNA was extracted from each sapling and treated with DNase I as described above. Approximately 1 mg of DNase I-treated total RNA was converted into cDNA using PrimeScript RT Master Mix (TaKaRa Bio). The cDNA products were then diluted twelve-fold with nuclease-free water before its being used as a template in the qPCR. The quantitative reaction was performed on a StepOnePlus Real Time PCR System (Life Technologies) using the POWER SYBR Green PCR Master Mix (Life Technologies). The reaction mixture (20 ml) contained 2× POWER SYBR Master Mix, 0.2 mM each of the forward and reverse primers, and 2 ml of template cDNA. The primers were designed using Primer3Plus [22] and synthesized commercially. PCR amplification was performed under the following conditions: 95˚C for 10 min, followed by 40 cycles at 95˚C for 15 s and 58˚C for 60 s. A dissociation curve was designed after each PCR run to confirm product specificity and to avoid production of primer dimers. Gene expression of selected genes was normalized against ubiquitin as an internal reference gene (BW987637). Relative gene expression was calculated using the 2–DDCt method [23] . All reactions were performed in triplicate, and each sample was further amplified without reverse transcription to avoid DNA contamination of the sample. Differences among saplings were determined using oneand two-factor analysis of variance (ANOVA). When the ANOVA was significant, differences among individual saplings were estimated using post hoc Tukey’s tests at alpha = 0.01.
2.8. Tissue Observations
After harvesting differentiating xylem for RNA extraction, stem segments were harvested and fixed in 3% glutaraldehyde in 0.1 M phosphate buffer (pH 6.98) for 1 week at 4˚C. Transverse sections, 12 mm thick, were prepared from the segments using a sliding microtome. The sections were double-stained with safranin/astra blue and dehydrated in an increasing ethanol series. After soaking in xylene, the sections were mounted on glass slides with EntellanNeu (Merck, Darmstadt, Germany) and observed under a light microscope (BX60; Olympus, Tokyo, Japan). An intense red safranin stain indicated a high lignin content in the cell wall.
3. Results
3.1. Anatomical Observations
After harvesting differentiating xylem for RNA extraction, the remaining xylem tissues were collected and observed by light microscopy (Figure 1). The cell outlines of lower-side of saplings grown on an incline were rounded, and thick cell walls and intercellular spaces were observed (Figure 1(a)). An intense red safranin stain was observed in the inclined saplings. The cell outlines in the cross section were rectangular or hexagonal with no intercellular spaces in the vertical saplings (Figure 1(b)).
3.2. Sequencing and de Novo Assembly
RNA was extracted from both compression and normal wood samples to achieve a broad survey of genes associated with xylogensis. Using a SOLiD paired-end sequencing platform, 234,924,605 reads were obtained, with total nucleotides of 12,859,597,397 (12.8 Gb). The datasets were submitted to the DDBJ database (accession number DRA001036). Based on the reads, 40,602 contigs, with an average length of 529 bp and an N50 of 631 bp were assembled (Table 1). The size distribution of the contigs is shown in Figure 2. We used ESTScan [16]

Figure 1. Light microscopy of xylem derived from saplings grown inclined (a) or vertically (b). The differentiating xylem on the upper side of the photograph was scraped for RNA extraction. Bar = 50 μm.

Table 1. Overview of the sequencing and de novo assembly.

Figure 2. Size distribution of the assembled contigs. The gray bars and black circles indicate the number of contigs and cumulative relative frequency, respectively.
to detect potential coding regions in the sequences obtained by the assembly and found that 29,470 contigs (72.6%) contained a predicted coding region.
3.3. Comparison of Assembled Contigs with C. obtusa ESTs Deposited in the Database
We downloaded all presently available C. obtusac DNA sequences from Plant GDB to evaluate the quality of the assembled contigs (as of December 2013), which included all 5897 ESTs submitted by Ujino-Ihara et al. [24] and Yamashita et al. [5] . These sequences were submitted to a BLAST search against 40,602 assembled contigs. Of the 5897 C. obtusa EST sequences in the database, 4437 (75.2%) could be matched with assembled contigs using an E-value cutoff of 10–6. Of the 40,602 contig sequences, 4548 contigs (11.2 %) matched with C. obtusa EST sequences.
3.4. Functional Annotation and Classification of Contigs
Contig sequences were searched using BLASTX against the Nr and Swiss-Prot database with an E-value cutoff of 10–6 for annotation. Using this approach, 22,005 sequences (54.2% of the contig sequences) returned above BLAST cutoff results. Longer contigs were more likely to have BLAST matches: 95.3% of the contigs > 1000 bp in length showed homologous matches, whereas only 34.0% of the contigs < 300 bp showed matches. GO assignments were used to classify the functions of the contigs, and 19,293 sequences (47.5% of the contig sequences) were functionally annotated. They were categorized into 30 functional groups belonging to three main GO-slim ontologies: “biological process”, “molecular function”, and “cellular component” (Figure 3). The assignments to “biological process” (46.7%) made up the majority, followed by “cellular component” (29.1%) and “molecular function” (24.3%). Under the category of “biological process”, “cellular process” (25.0%) and “metabolic process” (23.6%) were prominently represented.
We performed a COG classification analysis to further evaluate the functions of the assembled contigs. Of the 29,470 contigs with a predicted coding region, 11,769 (39.9%) sequences were assigned to COG classifications (Figure 4). Among the 25 COG categories, the cluster for R “general function prediction only” (1392, 11.8%) was the largest group, followed by T “signal transduction mechanisms” (1365, 11.6%), O “posttranslational modification, protein turnover and chaperones” (1136, 9.7%), K “transcription” (677, 5.8%), and A “RNA processing and modification” (667, 5.7%).
In total, 29,470 contigs with predicted coding regions were mapped to KEGG pathways to identify active biological pathways in C. obtusa xylem; 11,355 (38.5%) contigs were assigned to 286 pathways. These pathways were divided into six groups, of which “metabolism” was the largest group (8196), followed by “organismal systems” (4191) and “genetic information processing” (2901). The “metabolism” pathway was classified into 11 subgroups of which “carbohydrate metabolism” was the largest group (1791), followed by “amino acid metabolism” (1069) and “lipid metabolism” (900). In particular, the proportion of “phenylalanine metabolism” in “amino acid metabolism” was high (134, 12.5%).

Figure 3. Gene ontology (GO) classification of the assembled contigs. Results are summarized in the three main GO categories of “biological processes”, “molecular functions”, and “cellular components”.
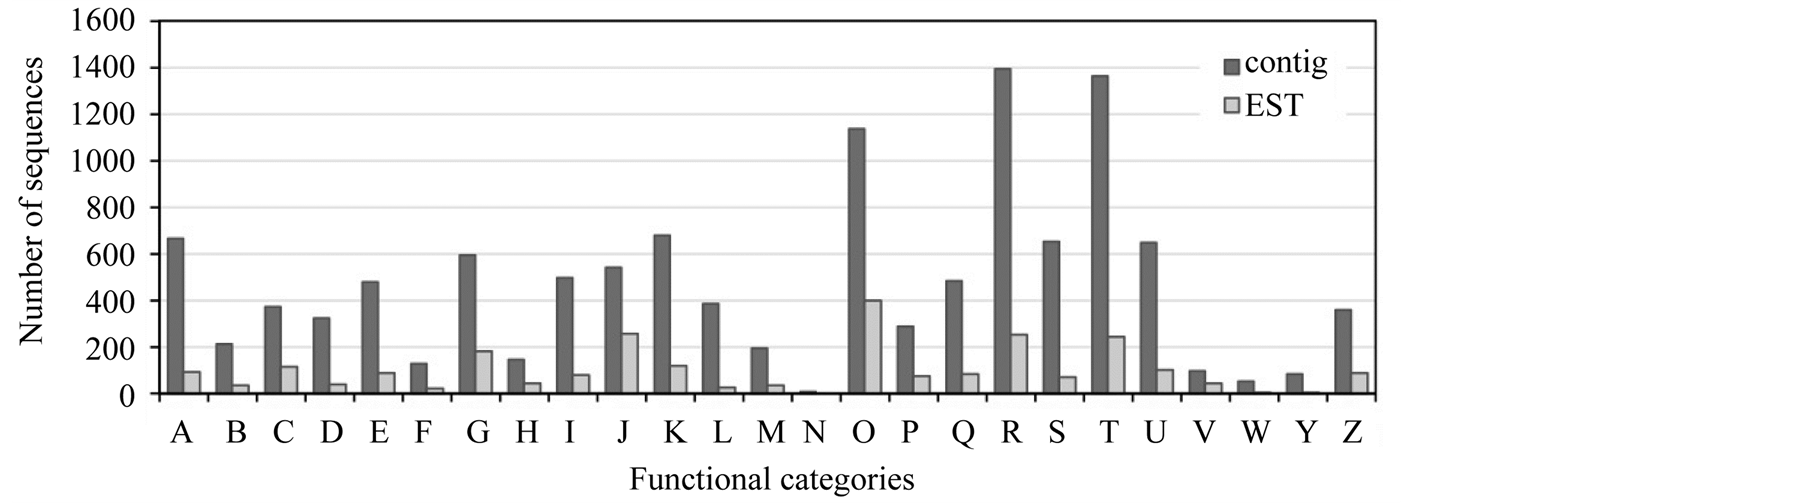
Figure 4. The eukaryotic Clusters of Orthologous Groups of proteins (COG) classifications for de novo-assembled contigs and Chamaecyparis obtusa expressed sequence tag (EST) sequences deposited in the database. A, RNA processing and modification; B, chromatin structure and dynamics; C, energy production and conversion; D, cell cycle control, cell division, chromosome partitioning; E, amino acid transport and metabolism; F, nucleotide transport and metabolism; G, carbohydrate transport and metabolism; H, coenzyme transport and metabolism; I, lipid transport and metabolism; J, translation, ribosomal structure, and biogenesis; K, transcription; L, replication, recombination, and repair; M, cell wall/membrane/envelope biogenesis; N, cell motility; O, posttranslational modification, protein turnover, chaperones; P, inorganic ion transport and metabolism; Q, secondary metabolite biosynthesis, transport, and catabolism; R, general function prediction only; S, function unknown; T, signal transduction mechanisms; U, intracellular trafficking, secretion, and vesicular transport; V, defense mechanisms; W, extracellular structures; Y, nuclear structure; Z, cytoskeleton.
To further distinguish the C. obtusa EST sequences deposited in the database and our assembled contigs, COG classification of the EST sequences was carried out (Figure 4). Of the 5897 EST sequences, 2483 were successfully annotated and classified into 24 functional categories. Each of the COG clusters of the contigs contained more sequences than EST sequences, suggesting that the de novo-assembled contigs had wider transcriptome coverage than the EST sequences deposited in the database.
3.5. Transcript Difference between Compression and Normal Wood Samples
Normalization of gene expression and analysis of differential expression between compression and normal wood libraries were performed using R package TCC [21] with a FDR < 0.05. This analysis found that 2875 contigs were differentially expressed, including 1207 and 1668 contigs upand down-regulated, respectively, in compression wood (Figure 5).
To validate the RNA-Seq results and to identify genes involved in compression wood formation, a qPCR analysis was performed using gene-specific primers for 30 contigs classified into the six GO categories of “binding”, “transcription regulator activity”, “transporter activity”, “response to stimulus”, “signal transduction”, and “anatomical structure morphogenesis” (Figure 6). Three compression wood samples and three normal wood samples were used for quantification, and sampling of the compression and normal wood tissues was conductedat 21, 25, and 28 days following initiation of the inclination stimulus. A two-factor ANOVA at P < 0.01 revealed that an interaction occurred between the inclination stimulus (i.e., compression or normal wood) and the day of sampling in 16 of 30 genes. Therefore, a precise assessment could not be made, but the following two tendencies were observed: the inclination stimulus had a significant effect on transcript abundance in 29 genes except for histone acetyltransferase, and the day of sampling had a significant effect on the transcript abundance in 15 genes. However, notably, the qPCR results of WRKY transcription factor 1 and BEL1-type homeodomain protein showed more transcript abundance in normal wood than in compression wood, which were contrary to the RNA-Seq results. Therefore, 27 genes except for histone acetyltransferase, WRKY transcription factor 1, and BEL1-type homeodomain protein exhibited the same expression profiles as the original RNA-Seq results. These results suggest that the data obtained from the RNA-Seq analysis were credible. To examine differences in transcript abundance among each sapling condition, inclination stimulus and day of sampling were paired intosix combinations (i.e., compression wood on day 21, compression wood on day 25, compression wood on day 28, normal wood on day 21, normal wood on day 25, and normal wood on day 28), and a one-factor ANOVA at
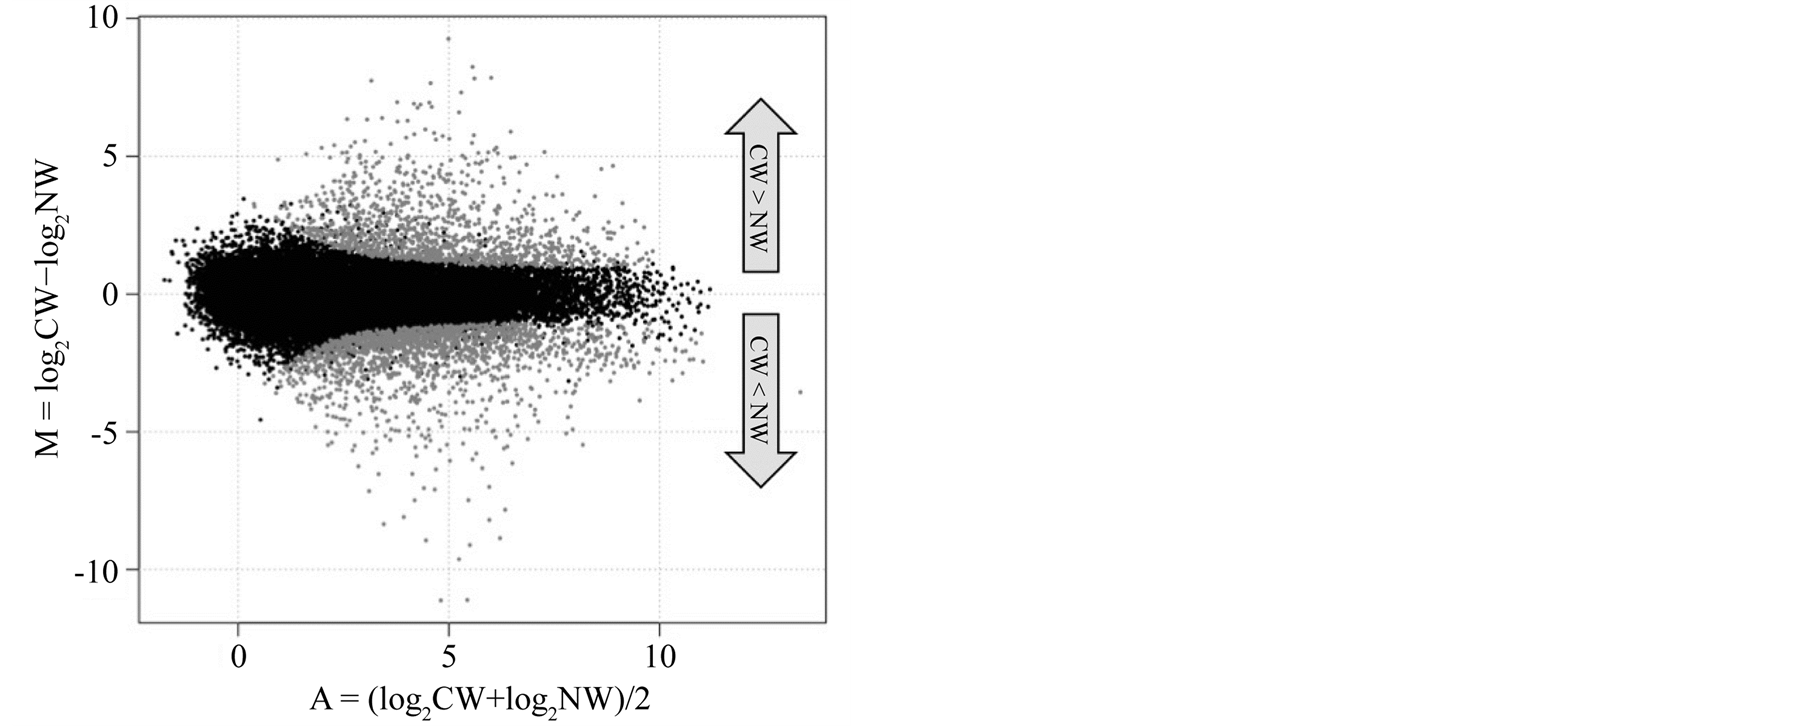
Figure 5. Differentially expressed genes in compression versus normal wood. Each dot represents a contig. Gray dots indicate contigs estimated as differentially expressed genes with a false discovery rate < 0.05. CW, compression wood; NW, normal wood. M = the log-ratios of expression, A = the log-intensity of each dot.
P < 0.01 was performed. The results revealed a significant difference in the mean transcript abundance value of 27 genes except for histone acetyltransferase, WRKY transcription factor 1, and plasma membrane intrinsic protein 2. The results of post hoc tests are shown in Figure 6 for the significant differences among the conditions. Of note, transcript abundance increased with increasing inclined growth period, i.e., day 21 < 25 < 28 for the mechanosensitive ion channel protein and R2R3-MYB transcription factor in the compression wood samples.
4. Discussion
4.1. Anatomical Observations
After harvesting differentiating xylem for RNA extraction, cross sections were prepared from the remaining xylem tissues and observed by light microscopy (Figure 1). Compared with normal wood, compression wood has a thicker secondary wall, intercellular spaces with cells that are rounded in cross section, and higher lignin content [1] , showing that the vertical and inclined saplings formed normal and compression woods, respectively. The upper side of each photograph in Figure 1 is the position of scraping for RNA extraction. The cells undergoing differentiation into compression and normal wood were successfully scraped and collected.
4.2. Sequencing and de Novo Assembly
The SOLiD system was used to generate 235 million paired-end reads (about 12.8 Gb). Although de novo assembly of short-read sequences without a known reference has been considered difficult, development and optimization of a de novo assembly method has allowed cost-effective assembly of transcriptomes for non-model organisms with unknown genomes [11] [25] -[27] . In this study, sequence assembly was performed using the CLC Genomics Workbench, which identified 40,602 contigs with an average length of 529 bp. Based on the criteria of contig length distribution and reduction in redundancy, the CLC Genomics Workbench is considered the most suitable assembler for non-model transcriptome data [28] .
To determine whether the short reads were correctly assembled, we performed a nucleotide BLAST search against C. obtusa EST sequences deposited in the database. Of the 5897 EST sequences, 4437 (75.2%) were matched with the assembled contigs. Although we used xylem samples only, the EST sequences in the database were derived not only from xylem but also from pollen and seed cones. Unmatched EST sequences (24.8%) probably resulted from the difference in sampling positions. Of 40,602 contig sequences, 4548 (11.2%) matched the EST sequences, suggesting that the de novo-assembled contigs had wider xylem transcriptome coverage than the EST sequences, but it also suggests that about 90% of the assembled contigs have not been sequenced previously or have not been assembled correctly.
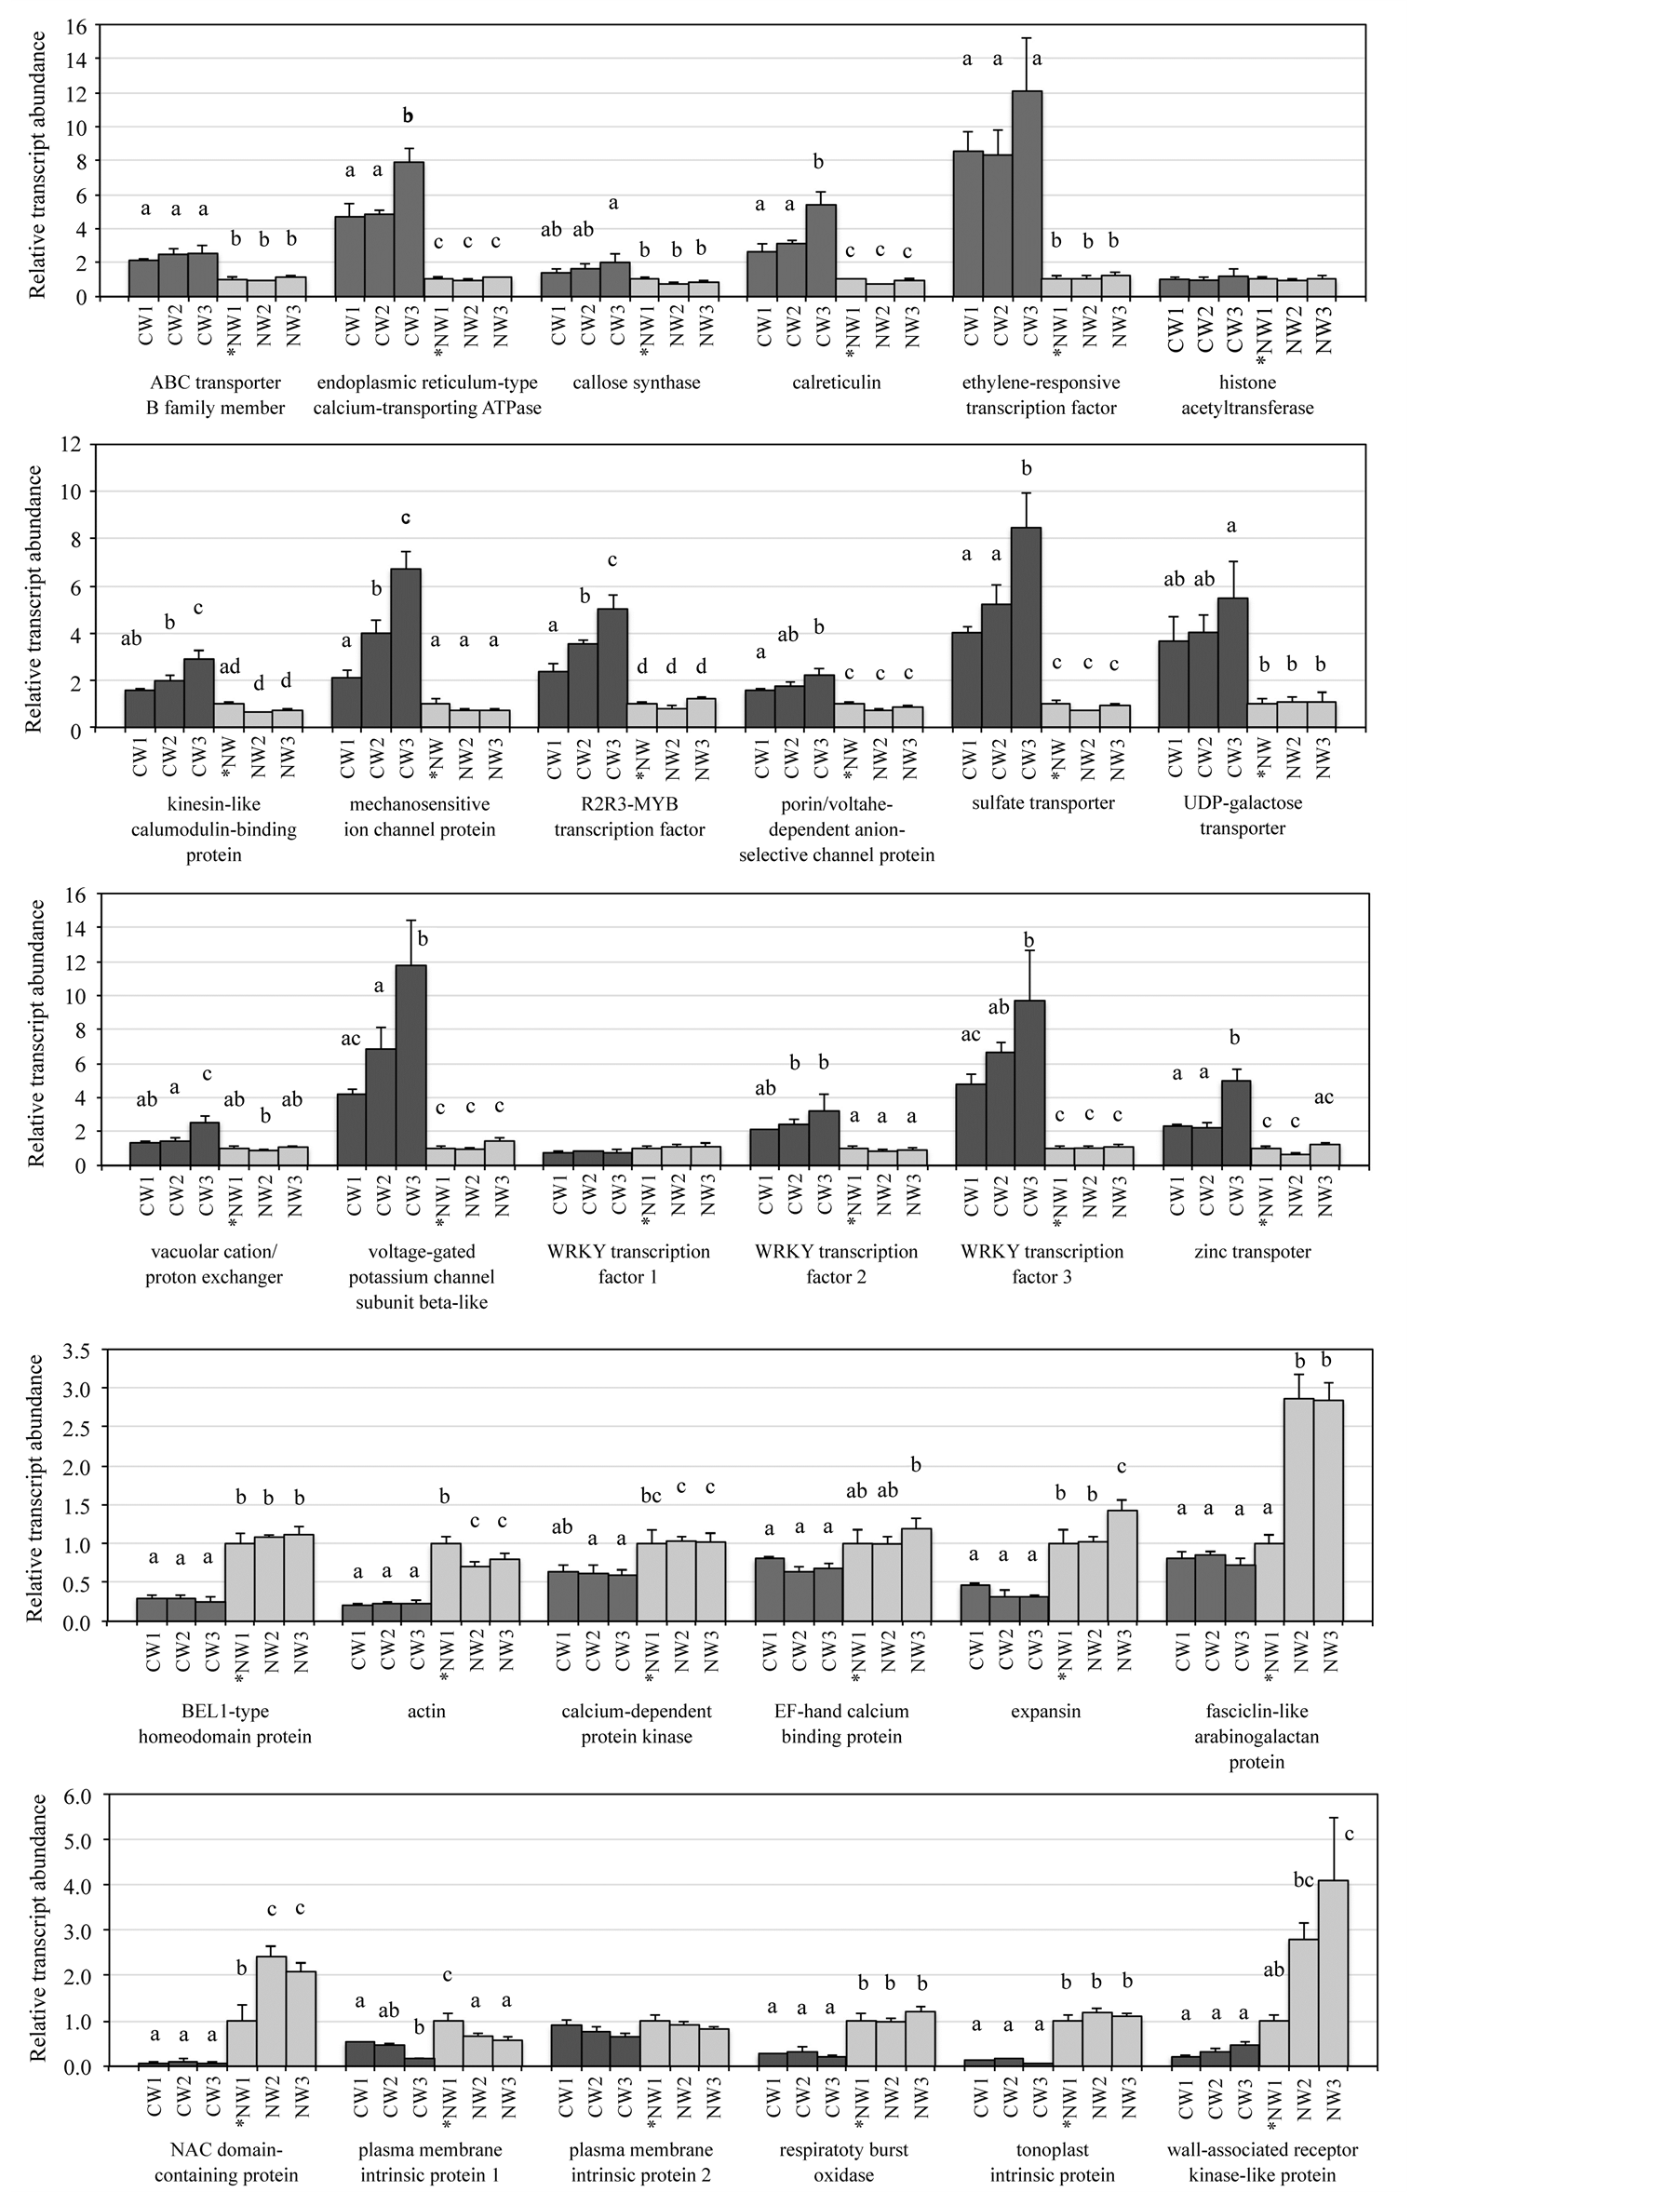
Figure 6. Expression profiles of 30 selected genes. Quantitative real-time polymerase chain reaction analyses were performed to validate the RNA-Seq results. CW, compression wood; NW, normal wood. Sampling of CW1 and NW1, CW2 and NW2, and CW3 and NW3 were conducted 21, 25, and 28 days, respectively, following initiation of the inclination stimulus. Asterisk indicates that NW1 was a reference relative quantification sample. Error bars show the standard deviation. Different letters denote a significant difference at P < 0.01. Multiple letters indicate that the mean value fell into more than one post hoc group.
We performed xylem-specific transcriptomic sequencing and assembly. Some plant transcriptomic studies sequenced pooled cDNA samples from different tissues [25] [29] [30] or assembled transcriptomic data using sequencing reads from different tissues [10] [11] [31] , whereas others performed tissue-specific transcriptomic sequencing and assembly [12] [26] [32] . Although more extensive transcriptomic data can be obtained using the former strategy, more accurate information can be produced using the latter method, as alternative splicing may exist in different tissues, which makes contig assembly difficult [33] . Therefore, the sequence lists obtained in this study will provide a good reference data for gene expression profiling in C. obtusa xylem.
4.3. Functional Annotation and Classification of Contigs
In this study, 54.2% (22,005) of the contigs had BLAST hits in the Nr and Swiss-Prot database. Wang et al. [34] and Wang et al. [27] showed that longer contigs are more likely to have BLAST matches in protein databases. Our results also showed that 95.3% of the contigs > 1000 bp in length had homologous matches, whereas only 34.0% of the contigs < 300 bp had matches.
Functional annotation and classification provides predicting information of the biological behaviors of genes. Many of the contigs were assigned to a wide range of GO, COG, and KEGG classifications, which indicated that our assembled contigs represented a wide diversity of transcripts. Among three main GO domains, “cellular process” and “metabolic process”, “binding” and “catalytic activity”, and “cell” were the most abundant classes in “biological processes”, “molecular functions”, and “cellular components”, respectively (Figure 3), which was consistent with the reports of Hao et al. [11] , Li et al. [12] , Xia et al. [25] , and Gordo et al. [26] . Among COG classifications, the second largest classifications unearthed in our work was T “signal transduction mechanisms” (Figure 4), which was different from the reports by Hao et al. [11] , Li et al. [12] , and Xia et al. [25] . As half of the xylem samples we used were compression wood, the signaling system following perception of inclination stimulus seems to have been activated compared to that in past reports. Among KEGG pathways, the proportions of “carbohydrate metabolism” and “amino acid metabolism” were considerably high. In particular, the proportion of “phenylalanine metabolism” in “amino acid metabolism” was higher than that in other studies [12] [25] [32] . As phenylalanine is an amino acid necessary for monolignol biosynthesis [35] , the high proportion of “phenylalanine metabolism” suggests active lignification in the cell wall.
4.4. Transcript Difference between Normal and Compression Wood Samples
Thirty genes were selected from 2875 differentially expressed genes (FDR < 0.05), and qPCR was performed to validate the RNA-Seq results and to identify the genes involved in compression wood formation. In order to achieve anatomical and chemical characteristics of compression wood, the cells must take some steps such as perception of inclination stimulus, signal transduction, regulation of gene expression by transcription factor binding, and transport of materials necessary for metabolism or cell wall formation. Hence, the 30 genes classified into six GO categories of “response to stimulus”, “signal transduction”, “binding”, “transcription regulator activity”, “transporter activity”, and “anatomical structure morphogenesis” were selected in this study. The results showed that most of the genes exhibited the same expression profiles as the original RNA-Seq results (Figure 6), suggesting that the data obtained from the RNA-Seq were credible.
For example, transcript abundance of the ABC transporter B family member in compression wood increased about twice that in normal wood (Figure 6). This transporter is involved with conveying various molecules such as phytohormones, secondary metabolites, and xenobiotic substances [36] [37] . Increases in this transporter in compression wood suggest that transport of auxin, which is a phytohormone, or monolignol, which is a secondary metabolite, became active. Transcript abundance of endoplasmic reticulum (ER)-type calcium-transporting ATPase andcalreticulin in compression wood increased about 5 - 8 times and 3 - 5 times, respectively, compared to that in normal wood (Figure 6). An ER-type calcium-transporting ATPase takes calcium ions into the ER using the energy of ATP [38] , and calreticulin is combined with calcium in the ER [39] . Allona et al. [40] also reported that calreticulin gene expression increases in the compression wood region. Du and Yamamoto [41] reported that calcium plays an important role in compression wood formation. Transcript abundance of the mechanosensitive ion channel in compression wood increased about 2 - 6 times compared to that in normal wood (Figure 6). This channel is thought to be able to perceive distortion of the membrane and change the concentration of intracellular calcium ions [42] , which also suggests the importance of calcium in compression wood formation. Transcript abundance of kinesin-like calmodulin-binding protein in compression wood increased about 2 - 3 times compared to that in normal wood (Figure 6). This gene is involved in microtubule bundling during mitosis and the orientation of cortical microtubules during interphase [43] [44] . This gene seems to be involved in the orientation of cortical microtubules, as the samples collected in this study were differentiating xylem tissue that had finished cell division. As the orientation of cortical microtubules is associated with the orientation of cellulose microfibrils, which constitute the cell wall [45] , the characteristics of compression-wood cell walls such as large microfibril angle and helical cavities may be achieved by increasing expression of this gene. The transcript abundance of R2R3-MYB, WRKY 2, and WRKY 3 in compression wood increased, and transcript abundance of the NAC domain-containing protein in compression wood decreased compared to those in normal wood (Figure 6). Bedon et al. [46] reported that gene expression of R2R3-MYB increases in the compression wood region. Li et al. [47] used branches of radiate pine and reported that WRKY gene expression increases in the opposite wood region rather than in the compression wood region. In this study, WRKY 1 was not different among the six conditions (Figure 6). The roles of the members appear to be different even when each gene belongs to the same WRKY family. The NAC domain-containing protein plays a role activating the entire secondary wall biosynthetic program in poplar normal wood [48] . However, in this study, we found that NAC domain-containing protein expression decreased in the compression wood region whose secondary wall formation is active. Transcription factors, which are necessary for activating secondary wall formation, may be different between compression and normal wood. The transcript abundance of expansin in compression wood decreased about one-half to one-third compared to that in normal wood (Figure 6). This enzyme disrupts hydrogen bonding between cellulose microfibrils and hemicelluloses, leading to wall loosening and enlargement of cells [49] . Tracheids in the compression wood region are shorter in length and smaller in diameter compared to those in normal wood [1] . These anatomical characteristics may be related with the expression level of the expansin gene.
We used three compression wood samples and three normal wood samples in the qPCR experiment whose timing of sampling was different among the three. In Figure 6, the timing of the sampling was later toward the right (i.e., 21, 25, and 28 days following initiation of the inclination stimulus). Many genes such as the mechanosensitive ion channel protein and the R2R3-MYB transcription factor showed a tendency to increase transcript abundance with increasing inclination period in compression wood. The same tendency was observed in our former study in which the transcript abundance of laccase in the compression wood region reached a peak at about 28 days [50] .
5. Conclusion
In conclusion, we generated libraries for SOLiD paired-end sequencing from differentiating xylem of C. obtusa compression and normal wood; de novo assembly generated 40,602 contigs. The large number of GO, COG, and KEGG classifications assigned indicated that this dataset represents the most comprehensive expressed gene catalog for C. obtusa xylem. This is the first application of NGS technology to assess transcript differences between compression and normal wood. The dataset generated in this study will improve our understanding regarding the molecular mechanisms of xylogenesis and formation of reaction wood in gymnosperms.
References
- Timell, T.E. (1986) Compression Wood in Gymnosperms. 1, Springer-Verlag, Berlin.
- Yamamoto, H., Okuyama, T., Yoshida, M. and Sugiyama, K. (1991) Generation Process of Growth Stresses in Cell Walls III. Growth Stress in Compression Wood. MokuzaiGakkaishi, 37, 94-100.
- Plomion, C., Pionneau, C., Brach, J., Costa, P. and Baillères, H. (2000) Compression Wood-Responsive Proteins in Developing Xylem of Maritime Pine (Pinuspinaster Ait.). Plant Physiology, 123, 959-969.http://dx.doi.org/10.1104/pp.123.3.959
- Gion, J.M., Lalanne, C., Le Provost, G., Ferry-Dumazet, H., Paiva, J., Chaumeil, P., Frigerio, J.M., Brach, J., Barré, A., de Daruvar, A., Claverol, S., Bonneu, M., Sommerer, N., Negroni, L. and Plomion, C. (2005) The Proteome of Maritime Pine Wood Forming Tissue. Proteomics, 5, 3731-3751.http://dx.doi.org/10.1002/pmic.200401197
- Yamashita, S., Yoshida, M., Yamamoto, H. and Okuyama, T. (2008) Screening Genes That Change Expression during Compression Wood Formation in Chamaecyparis obtusa. Tree Physiology, 28, 1331-1340. http://dx.doi.org/10.1093/treephys/28.9.1331
- Ramos, P., Le Provost, G., Gantz, C., Plomion, C. and Herrera, R. (2012) Transcriptional Analysis of Differentially Expressed Genes in Response to Stem Inclination in Young Seedlings of Pine. Plant Biology, 14, 923-933.http://dx.doi.org/10.1111/j.1438-8677.2012.00572.x
- Villalobos, D.P., Díaz-Moreno, S.M., Said, E.S.S., Canas, R.A., Osuna, D., Van Kerckhoven, S.H.E., Bautista, R., Claros, M.G., Canovas, F.M. and Canton, F.R. (2012) Reprogramming of Gene Expression during Compression Wood Formation in Pine: Coordinated Modulation of S-Adenosylmethionine, Lignin and Lignin Related Genes. BMC Plant Biology, 12, 100. http://dx.doi.org/10.1186/1471-2229-12-100
- Marioni, J.C., Mason, C.E., Mane, S.M., Stephens, M. and Gilad, Y. (2008) RNA-seq: An Assessment of Technical Reproducibility and Comparison with Gene Expression Arrays. Genome Research, 18, 1509-1517.http://dx.doi.org/10.1101/gr.079558.108
- Agarwal, A., Koppstein, D., Rozowsky, J., Sboner, A., Habegger, L., Hillier, L.W., Sasidharan, R., Reinke, V., Waterston, R.H. and Gerstein, M. (2010) Comparison and Calibration of Transcriptome Data from RNA-Seq and Tiling Arrays. BMC Gemomics, 11, 383. http://dx.doi.org/10.1186/1471-2164-11-383
- Mizrachi, E., Hefer, C.A., Ranik, M., Joubert, F. and Myburg, A.A. (2010) De novo Assembled Expressed Gene Catalog of a Fast-Growing Eucalyptus Tree Produced by Illumina mRNA-Seq. BMC Genomics, 11, 681.http://dx.doi.org/10.1186/1471-2164-11-681
- Hao, D.C., Ge, G.B., Xiao, P.G., Zhang, Y.Y. and Yang, L. (2011) The First Insight into the Tissue Specific Taxus Transcriptome via Illumina Second Generation Sequencing. PLoS ONE, 6, Article ID: e21220.http://dx.doi.org/10.1371/journal.pone.0021220
- Li, D.J., Deng, Z., Qin, B., Liu, X.H. and Men, Z.H. (2012) De novo Assembly and Characterization of Bark Transcriptome Using Illumina Sequencing and Development of EST-SSR Markers in Rubber Tree (Hevea brasiliensis Muell. Arg.). BMC Genomics, 13, 192. http://dx.doi.org/10.1186/1471-2164-13-192
- Sun, X.D., Zhou, S.M., Meng, F.L. and Liu, S.Q. (2012) De novo Assembly and Characterization of the Garlic (Allium sativum) Bud Transcriptome by Illumina Sequencing. Plant Cell Reports, 31, 1823-1828.http://dx.doi.org/10.1007/s00299-012-1295-z
- Dong, Q., Schlueter, S.D. and Brendel, V. (2004) PlantGDB, Plant Genome Database and Analysis Tools. Nucleic Acids Research, 32, D354-D359. http://dx.doi.org/10.1093/nar/gkh046
- Conesa, A., Gotz, S., Garcia-Gomez, J.M., Terol, J., Talon, M. and Robles, M. (2005) Blast2GO: A Universal Tool for Annotation, Visualization and Analysis in Functional Genomics Research. Bioinformatics, 21, 3674-3676.http://dx.doi.org/10.1093/bioinformatics/bti610
- Iseli, C., Jongeneel, C.V. and Bucher, P. (1999) ESTScan: A Program for Detecting, Evaluating and Reconstructing Potential Coding Regions in EST Sequences. Proceedings of the 7th International Conference on Intelligent Systems for Molecular Biology, Heidelberg, 6-10 August 1999, 138-148.
- Rice, P., Longden, I. and Bleasby, A. (2000) EMBOSS: The European Molecular Biology Open Software Suite. Trends in Genetics, 16, 276-277. http://dx.doi.org/10.1016/S0168-9525(00)02024-2
- Tatusov, R.L., Fedorova, N.D., Jackson, J.D., Jacobs, A.R., Kiryutin, B., Koonin, E.V., Krylov, D.M., Mazumder, R., Mekhedov, S.L., Nikolskaya, A.N., Rao, B.S., Smirnov, S., Sverdlov, A.V., Vasudevan, S., Wolf, Y.I., Yin, J.J. and Natale, D.A. (2003) The COG Database: An Updated Version Includes Eukaryotes. BMC Bioinformatics, 4, 41.http://dx.doi.org/10.1186/1471-2105-4-41
- Kanehisa, M. and Goto, S. (2000) KEGG: Kyoto Encyclopedia of Genes and Genomes. Nucleic Acids Research, 28, 27-30. http://dx.doi.org/10.1093/nar/28.1.27
- Wu, S.T., Zhu, Z.W., Fu, L.M., Niu, B.F. and Li, W.Z. (2011) WebMGA: A Customizable Web Server for Fast Metagenomic Sequence Analysis. BMC Genomics, 12, 444. http://dx.doi.org/10.1186/1471-2164-12-444
- Sun, J., Nishiyama, T., Shimizu, K. and Kadota, K. (2013) TCC: An R Package for Comparing Tag Count Data with Robust Normalization Strategies. BMC Bioinformatics, 14, 219. http://dx.doi.org/10.1186/1471-2105-14-219
- Untergasser, A., Nijveen, H., Rao, X., Bisseling, T., Geurts, R. and Leunissen, J.A. (2007) Primer3Plus, an Enhanced Web Interface to Primer3. Nucleic Acids Research, 35, W71-W74. http://dx.doi.org/10.1093/nar/gkm306
- Livak, K.J. and Schmittgen, T.D. (2001) Analysis of Relative Gene Expression Data Using Real-Time Quantitative PCR and the 2(-Delta delta C(T)) Method. Methods, 25, 402-408. http://dx.doi.org/10.1006/meth.2001.1262
- Ujino-Ihara, T., Kanamori, H., Yamane, H., Taguchi, Y., Namiki, N., Mukai, Y., Yoshimura, K. and Tsumura, Y. (2005) Comparative Analysis of Expressed Sequence Tags of Conifers and Angiosperms Reveals Sequence Specifically Conserved in Conifers. Plant Molecular Biology, 59, 895-907. http://dx.doi.org/10.1007/s11103-005-2080-y
- Xia, Z., Xu, H., Zhai, J., Li, D., Luo, H., He, C. and Huang, X. (2011) RNA-Seq Analysis and de novo Transcriptome Assembly of Hevea brasiliensis. Plant Molecular Biology, 77, 299-308. http://dx.doi.org/10.1007/s11103-011-9811-z
- Gordo, S.M.C., Pinheiro, D.G., Moreira, E.C.O., Rodrigues, S.M., Poltronien, M.C., De Lemos, O.F., Tojal da Silva, I., Ramos, R.T.J., Silva, A., Schneider, H., Silva Jr., W.A., Sampaio, I. and Darnet, S. (2012) High-Throughput Sequencing of Black Pepper Root Transcriptome. BMC Plant Biology, 12, 168. http://dx.doi.org/10.1186/1471-2229-12-168
- Wang, S., Wang, X., He, Q., Liu, X., Xu, W., Li, L., Gao, J. and Wang, F. (2012) Transcriptome Analysis of the Roots at Early and Late Seedling Stages Using Illumina Paired-End Sequencing and Development of EST-SSR Markers in Radish. Plant Cell Reports, 31, 1437-1447. http://dx.doi.org/10.1007/s00299-012-1259-3
- Bräutigam, A., Mullick, T., Schliesky, S. and Weber, A.P.M. (2011) Critical Assessment of Assembly Strategies for Non-Model Species mRNA-Seq Data and Application of Next-Generation Sequencing to the Comparison of C3 and C4 Species. Journal of Experimental Botany, 62, 3093-3102. http://dx.doi.org/10.1093/jxb/err029
- Parchman, T.L., Geist, K.S., Grahnen, J.A., Benkman, C.W. and Buerkle, C.A. (2010) Transcriptome Sequencing in an Ecologically Important Tree Species: Assembly, Annotation, and Marker Discovery. BMC Genomics, 11, 180. http://dx.doi.org/10.1186/1471-2164-11-180
- Sui, C., Zhang, J., Wei, J.H., Chen, S.L., Li, Y., Xu, J.S., Jin, Y., Xie, C.X., Gao, Z.H., Chen, H.J., Yang, C.M., Zhang, Z. and Xu, Y.H. (2011) Transcriptome Analysis of Bupleurum chinese Focusing on Genes Involved in the Biosynthesis of Saikosaponins. BMC Genomics, 12, 539. http://dx.doi.org/10.1186/1471-2164-12-539
- Garg, R., Patel, R.K., Jhanwar, S., Priya, P., Bhattacharjee, A., Yadav, G., Bhatia, S., Chattopadhyay, D., Tyagi, A.K. and Jain, M. (2011) Gene Discovery and Tissue-Specific Transcriptome Analysis in Chickpea with Massively Parallel Pyrosequencing and Web Resource Development. Plant Physiology, 156, 1661-1678.http://dx.doi.org/10.1104/pp.111.178616
- Zhou, Y.J., Gao, F., Liu, R., Feng, J.C. and Li, H.J. (2012) De novo Sequencing and Analysis of Root Transcriptome Using 454 Pyrosequencing to Discover Putative Genes Associated with Drought Tolerance in Ammopiptanthus mongolicus. BMC Genomics, 13, 266. http://dx.doi.org/10.1186/1471-2164-13-266
- Marquez, Y., Brown, J.W.S., Simpson, C., Barta, A. and Kalyna, M. (2012) Transcriptome Survey Reveals Increased Complexity of the Alternative Splicing Landscape in Arabidopsis. Genome Research, 22, 1184-1195.http://dx.doi.org/10.1101/gr.134106.111
- Wang, X.W., Luan, J.B., Li, J.M., Bao, Y.Y., Zhang, C.X. and Liu, S.S. (2010) De novo Characterization of a Whitefly Transcriptome and Analysis of Its Gene Expression during Development. BMC Genomics, 11, 400.http://dx.doi.org/10.1186/1471-2164-11-400
- Dixon, R.A., Chen, F., Guo, D. and Parvathi, K. (2001) The Biosynthesis of Monolignols: A “Metabolic Grid”, or Independent Pathways to Guaiacyl and Syringyl Units? Phytochemistry, 57, 1069-1084.http://dx.doi.org/10.1016/S0031-9422(01)00092-9
- Bailly, A., Yang, H., Martinoia, E., Geisler, M. and Murphy, A.S. (2012) Plant Lessons: Exploring ABCB Functionality through Structural Modeling. Frontiers in Plant Science, 2, 108. http://dx.doi.org/10.3389/fpls.2011.00108
- Liu, C.J. (2012) Deciphering the Enigma of Lignification: Precursor Transport, Oxidation, and the Topochemistry of Lignin Assembly. Molecular Plant, 5, 304-317. http://dx.doi.org/10.1093/mp/ssr121
- Sanders, D., Pelloux, J., Brownlee, C. and Harper, J.F. (2002) Calcium at the Crossroads of Signaling. The Plant Cell, 14, S401-S417.
- Michalak, M., Milner, R.E., Burns, K. and Opas, M. (1992) Calreticulin. Biochemical Journal, 285, 681-692.
- Allona, I., Quinn, M., Shoop, E., Swope, K., St. Cyr, S., Carlis, J., Riedl, J., Retzel, E., Campbell, M.M., Sederoff, R. and Whetten, R.W. (1998) Analysis of Xylem Formation in Pine by cDNA Sequencing. Proceedings of the National Academy of Sciences of the United States of America, 95, 9693-9698. http://dx.doi.org/10.1073/pnas.95.16.9693
- Du, S. and Yamamoto, F. (2003) A Study on the Role of Calcium in Xylem Development and Compression Wood Formation in Taxodium distichum Seedling. IAWA Journal, 24, 75-85. http://dx.doi.org/10.1163/22941932-90000322
- Kurusu, T., Kuchitsu, K., Nakano, M., Nakayama, Y. and Iida, H. (2013) Plant Mechanosensing and Ca2+ Transport. Trends in Plant Science, 18, 227-233. http://dx.doi.org/10.1016/j.tplants.2012.12.002
- Kao, Y.L., Deavours, B.E., Phelps, K.K., Walker, R.A. and Reddy, A.S.N. (2000) Bundling of Microtubules by Motor and Tail Domains of a Kinesin-Like Calmodulin-Binding Protein from Arabidopsis: Regulation by Ca2+/Calmodulin. Biochemical and Biophysical Research Communications, 267, 201-207. http://dx.doi.org/10.1006/bbrc.1999.1896
- Preuss, M.L., Delmer, D.P. and Liu, B. (2003) The Cotton Kinesin-Like Calmodulin-Binding Protein Associates with Cortical Microtubules in Cotton Fibers. Plant Physiology, 132, 154-160. http://dx.doi.org/10.1104/pp.103.020339
- Barnett, J.R. and Bonham, V.A. (2004) Cellulose Microfibril Angle in the Cell Wall of Wood Fibres. Biological Reviews, 79, 461-472. http://dx.doi.org/10.1017/S1464793103006377
- Bedon, F., Grima-Pettenati, J. and Mackay, J. (2007) Conifer R2R3-MYB Transcription Factors: Sequence Analyses and Gene Expression in Wood-Forming Tissues of White Spruce (Picea glauca). BMC Plant Biology, 7, 17.http://dx.doi.org/10.1186/1471-2229-7-17
- Li, X.G., Yang, X.H. and Wu, H.X. (2013) Transcriptome Profiling of Radiate Pine Branches Reveals New Insights into Reaction Wood Formation with Implications in Plant Gravitropism. BMC Genomics, 14, 768.http://dx.doi.org/10.1186/1471-2164-14-768
- Zhong, R.Q., Lee, C. and Ye, Z.H. (2010) Functional Characterization of Poplar Wood-Associated NAC Domain Transcription Factors. Plant Physiology, 152, 1044-1055. http://dx.doi.org/10.1104/pp.109.148270
- Choi, D., Kim, J.H. and Lee, Y. (2008) Expansins in Plant Development. Advances in Botanical Research, 47, 47-97.http://dx.doi.org/10.1016/S0065-2296(08)00002-5
- Sato, S., Hiraide, H., Yoshida, M. and Yamamoto, H. (2013) Changes in Xylem Tissue and Laccase Transcript Abundance Associated with Posture Recovery in Chamaecyparis obtusa Saplings Growing on an Incline. Functional Plant Biology, 40, 637-643. http://dx.doi.org/10.1071/FP12313