American Journal of Plant Sciences
Vol. 4 No. 7 (2013) , Article ID: 34757 , 13 pages DOI:10.4236/ajps.2013.47183
Mineral Balance Plasticity of Cloudberry (Rubus chamaemorus) in Quebec-Labrador Bogs
![]()
1Department of Soils and Agrifood Engineering, Université Laval, Québec, Canada; 2Centre d’Études de la Forêt, Department of Biology, Université Laval, Québec, Canada; 3Centre de Recherches Les Buissons, Pointe-aux-Outardes, Canada.
Email: *leon-etienne.parent@fsaa.ulaval.ca, sergeetienneparent@gmail.com, line.lapointe@bio.ulaval.ca, kristine.naess@lesbuissons.qc.ca
Copyright © 2013 Léon Etienne Parent et al. This is an open access article distributed under the Creative Commons Attribution License, which permits unrestricted use, distribution, and reproduction in any medium, provided the original work is properly cited.
Received May 4th, 2013; revised June 5th, 2013; accepted July 3rd, 2013
Keywords: Al Toxicity; Cloudberry; Compositional Data Analysis; Isometric Log Ratio; Nutrient Balance; Ionome
ABSTRACT
The “ionome”, or plant elemental signature, is the elemental composition of an organisms, that may vary with genotypic traits and phenotypic plasticity. Cloudberry (Rubus chamaemorus L.) is a circumboreal wild berry naturally growing in oligotrophic oceanic bogs of Quebec and Labrador. Our objective was to relate cloudberry stand productivity to the ionomes of female ramets and explore the cause of nutrient imbalance in low-performing stands. We analyzed 13 elements in female ramets collected in 86 natural sites where crop productivity varied widely. We computed orthogonally arranged balances reflecting plant stoichiometric rules and soil biogeochemistry. Balances were expressed as isometric log ratios (ilr) between ad hoc sub-compositions. Balances were synthesized into a Mahalanobis distance optimized based on receiving operating characteristics (ROC). The critical Mahalanobis distance was found to be 5.29 for cutoff berry yield of 3.8 g·m−2 with test performance of 0.88, as measured by the area under the ROC curve. Although past research on cloudberry focused mainly on the N/P ratio, this exploratory mineral balance analysis indicated that imbalance in the [P,N | S,C] and [Al | Nutrients] partitions appeared to be the factors limiting the most cloudberry productivity in the bogs. Some highly productive stands showed relatively high C fixation and K use efficiency. Due to the complexity of interactions, diagnosis should be conducted computing first a global imbalance index (Mahalanobis distance), then examining in the balance domain binary partitions departing most from reference, and finally appreciating relative shortage, sufficiency or excess of elements in the concentration domain.
1. Introduction
The “ionome”, or nutrient signature, is the elemental composition of an organism [1], which may vary with genotypic traits and phenotypic plasticity [2,3]. Low phenotypic plasticity of a species may restrain its abundance and productivity to specific ecological niches. As a result, plant iomomes have long been recognized as bio-indicators for mineral prospection and geochemical anomalies [4-6]. Conversely, the ionome of economically important plant species may identify ideal mineral environments for adequate growth and development.
Cloudberry is of economic value for several QuebecLabrador communities. Cloudberry is a wild berry growing in oligotrophic acid bogs. Bogs are ecosystems with low nutrient supply fed by wet and dry atmospheric depositions [7]. The “trapping efficiency” of macronutrients in oligotrophic bogs is N > P > Ca ≈ Mg > K [8]. Although fruit production can be limited by internal nutrient balance, the cloudberry can store available nutrients for future use and has variable and delayed yield response to added nutrients [9-11].
In most natural terrestrial ecosystems such as oceanic oligotrophic bogs where cloudberry grows, plant growth is N-limited, P limitation occurs frequently, and K limits plant growth only infrequently [12,13]. Although the N, P, K, Ca, Mg composition has been determined for British cloudberry stands [14], no nutrient limiting factor was suggested. The foliar N/P mass ratio is a well-documented indicator of nutrient limitation to the growth of wild species: plant growth would be N-limited at N/P ratios < 14, P-limited at N/P ratios > 16, and co-limited by N and P at intermediate values [12]. By comparison, the N/P ratio in cloudberry leaves was in the range of 12 to 14 in Sweden [15], and of 7 to 11 in Scotland [14] and Norway [16,17].
DRIS, an acronym for diagnosis and recommendation integrated system, is an empirical diagnostic model that integrates many dual ratios into nutrient indexes [18]. Because nutrient ratios do not inform whether nutrient concentrations are simultaneously too high, too low or adequate [19], they are often used in combination with nutrient concentration ranges. However, combining the critical range approach and DRIS may lead to conflicting results [20-22], indicating that those approaches are noisy. Although there are D × (D-1)/2 possible dual ratios for a D-parts composition, the compositional matrix has rank D-1 [23]. DRIS was rectified [24] using the centered log ratio (clr) of [25]. However, the clr matrix is singular and one clr value must be sacrificed in multivariate analysis [26].
Compositional data, a data class nutrients belongs to, have special properties related to closure, such as redundancy, scale dependency and non-normal distribution [25]. As a result, raw [27] or ordinary log-transformed [28] data based on the ceteris paribus assumption (all other factors being equal) and dual ratios [29] are not appropriate to conduct multivariate analyses [25,30]. A more suitable approach requires that multivariate data be structured coherently and analyzed without bias.
Balances between components of some whole were defined by [31] to avoid biases when interpreting results of multivariate analyses of compositional data. A dendogram design illustrates sound links relating nutrient concentrations to balances [32]. There are D-1 ad hoc balances that can be orthogonally arranged as isometric log ratios (ilr) [33]. A system of plant nutrient balances was designed with log contrasts between anions and cations as [Mg,Ca,K | P,N], between anions as [P | N] and, between cations as [Mg,Ca | K] and [Ca | Mg] [34]. The nutrient balance concept was used to diagnose soil-plant relationships [32] and crop mineral nutrition [35,36] and to classify the nutrient signature of plant species [37].
The aim of this paper was to conduct an unbiased multivariate diagnosis of cloudberry (Rubus chamaemorus L.) stands in oceanic bogs of Quebec-Labrador using ad hoc balances between elements of the leaf ionome. Our hypothesis was that low productivity is attributable to mineral imbalance in female ramets. We surveyed cloudberry stands varying in fruit productivity and separated true negative from true positive specimens using an unbiased multivariate distance and receiving operating characteristics (ROC) curves. The cause of imbalance was identified using a stand-alone pan balance design with balances at fulcrums (“balance domain”) and ilrback-transformed concentrations in buckets (“concentration domain”).
2. Material and Methods
2.1. Sampling Sites
The dataset comprised 86 natural sites (1-m in diameter) of contrasting berry yields sampled in 2009 in acid ombrotrophic (rainfed and oligotrophic) oceanic bogs located between Old Fort and Blanc-Sablon on the Lower North Shore of the gulf of St-Lawrence (51˚25'N; 57˚12'W) near Labrador.
The developmental stages of cloudberry [38] guided the sampling procedure. At least six leaves from female ramets were collected in each plot on July 20th and 21th at stage 11 (calyx). Total number of female ramets was counted in each plot. The number of female ramets was calibrated against fruit yield from 36 more accessible plots (1 m by 2.5 m) located closed to Blanc-Sablonwhere fruit yield were measured at stage 13 (fruit set) from the 28th July to the 23rd August (i.e. 27 to 57 days after flowering). Leaf C, N and S were quantified by combustion using a Leco CNS-2000 instrument. Other elements were quantified by plasma emission spectroscopy (ICP-OES) after tissue digestion in a mixture of perchloric and nitric acids [39].
2.2. Sequential Binary Partition
Mineral balances outlined in a sequential binary partition (SBP) should reflect the functions of minerals in the plant system as well as principles of soil geochemistry (Table 1). There are 13 orthogonal balances in a compositional vector made of 13 analytical results and the filling value (14 components in total). The first balance was selected as a contrast between analytical data and the filling value to measurement unit. Because Al may interfere with several essential nutrients in plants [40], Al was contrasted with nutrients in the second balance. Another balance contrasted macro-nutrients plus B with other analytical results. We balanced macro-nutrients with B because B interacts mainly with macro-nutrients [41].
The C:S:N:P and K:Ca:Mg stoichiometric rules were contrasted to reflect protein synthesis requiring energy as ATP [42], the biogeochemistry cycles of C, S, N and P [43], and cationic interactions [19]. The stoichiometric rules were further split into three and two additional contrasts, respectively. Other balances were designed based on nutrient availability. The Cu and Zn are naturally at low availability levels in organic soils [44], while microbial activity and sulfur largely interfere in Mn and Fe geochemistry [8,45].
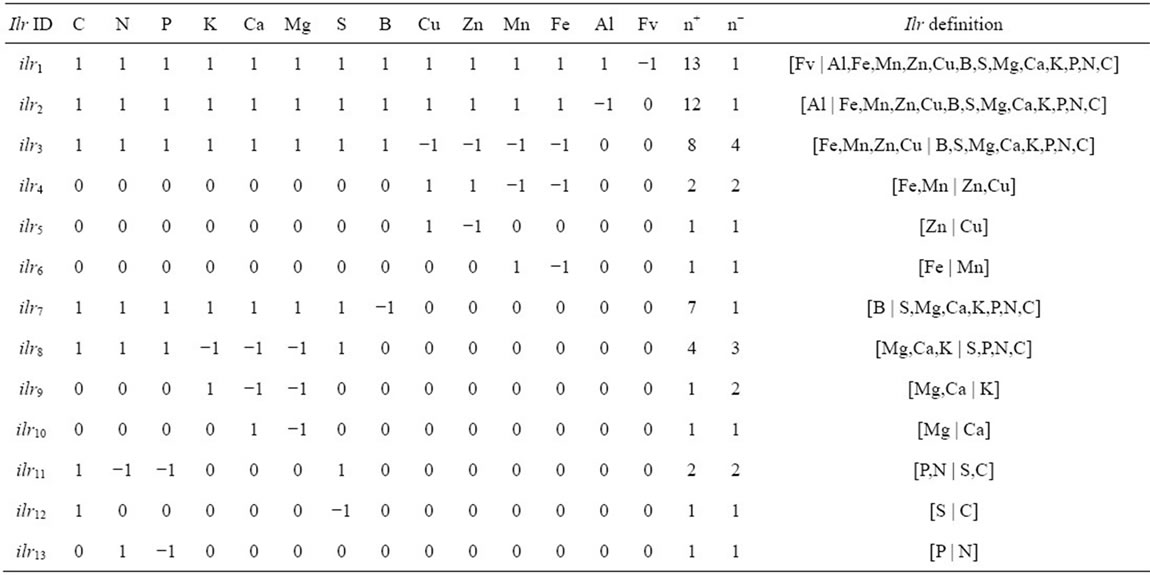
Table 1. Sequential binary partition of the cloudberry analytical data between +1 components at numerator and −1 components at denominator to compute isometric log ratios (Equation (1)).
2.3. Statistical Analysis
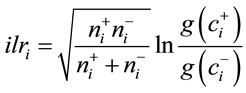
Mineral balances were computed as ilrs between the geometric means of two sub-compositions as follows [33]:
 (1)
(1)
where i = 1 to D-1, ilri is the ith isometric log ratio,  and
and  are, respectively, numbers of components labeled “+1” and “−1” in the ith row of the SBP,
  is geometric mean of components labeled “+1” and
is geometric mean of components labeled “−1” in the ith row of the SBP. Equation (1) avoids numerical biases as follows:
• The ilr values are orthogonal to each other, thus linearly independent, and the ilr matrix has rank D-1, hence avoiding redundancy.
• The log ratio between sub-compositions A and B, i.e. log(A/B), scans the unconstrained real space while raw concentrations are constrained to the compositional space of the measurement unit; an unconstrained space is required to (1) conduct statistical analyses and determine data distribution and (2) avoid confidence intervals reaching values below zero or above 100%, a physical impossibility;
• The ilr values are scale invariant; the difference between dry and fresh weight bases implies only the addition of a balance between water and components of the dry weight. When scale is changed from dry to fresh weight basis, all other balances remain unchanged.
In this paper, balances are conventionally noted as [−1 or denominator group | +1 or numerator group], because in algebra, negative numbers are located on the left side of the zero. As a result, when – group loads more, balance leans to the left and when + group loads more, balance leans to the right. For example, 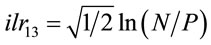 is the ilr counterpart of our conventional [P | N] partition. As N loads more on this ilr, the ilr increases in value and the [P | N] partition leans to the right due to heavier weight in the N bucket compared to P. Conversely, as P loads more, the balance becomes more negative and leans to the left.
The stands were partitioned into four quadrants using response and predictor delimiters, by relating counts of female ramets and the Mahalanobis distance ( ), computed between the median of the ilrs of the reference population and the ilrs of each observation, accounting for the covariance of the reference population [32]. Because multivariate plant data sets contain extreme values, a method based on the median is needed to compute robust multivariate distances [30]. Each quadrant was interpreted as follows:
• True positive (TP: nutrient imbalance): low yield crops correctly diagnosed as imbalanced (above critical index). At least one nutrient is imbalanced.
• False positive (FP: type I error): high yield crops incorrectly identified as imbalanced (above critical index). FP points indicate below-normal or luxury consumption of nutrients.
• True negative (TN: nutrient balance): high yield crops correctly diagnosed as balanced (below critical index). The nutrient status is adequate.
• False negative (FN: type II error): low yield crops incorrectly identified as balanced (below critical index). FN points show impact of other limiting factors on crop performance.
Sensitivity is the probability that a low yield is imbalanced, computed as TP/(TP + FN). Specificity is the probability that a high yield is balanced, computed as TN/(TN + FP). The accuracy of the classification is the probability that an observation is located in the “true” quadrant, i.e. (TN + TP)/(TN + TP + FN + FP).
The selected response (female ramet counts) delimiter corresponded to the maximal area under the sensitivity versus specificity curve (AUC), as known as the receiving operating characteristic (ROC) curve [46,47]. The selected predictor ( ) delimiter corresponded to best compromise between sensitivity and specificity, i.e. the maximum value obtained by Youden’s J index (J = sensitivity + specificity − 1) [48]. Because the value of the
  delimiter defines the reference population from which
  is computed,
  values were iterated until two successive classifications were identical.
Statistical computations were conducted in the R statistical environment [49]. The ilr transformations, as well as ilr back-transformations to familiar concentration units, were computed using the R “compositions” package [50]. Some B and Cu levels below detection limits were replaced by the detection limit of the equipment for the corresponding element, multiplied by 0.65 [51]. Tukey’s test (p ≤ 0.05) allowed detecting significant difference between TN and TP populations. Linear discriminant analysis was performed using the R “MASS” package [52].
3. Results
3.1. Data Partitioning and ROC Analysis
The counts of female ramets were found to be closely related to cloudberry yields in the 40 calibration plots (Figure 1) and thus representative of crop productivity. Fruit yield varied between 0 and 15 g·fruit·m−2 corresponding to 0 to 60 female ramets·m−2.
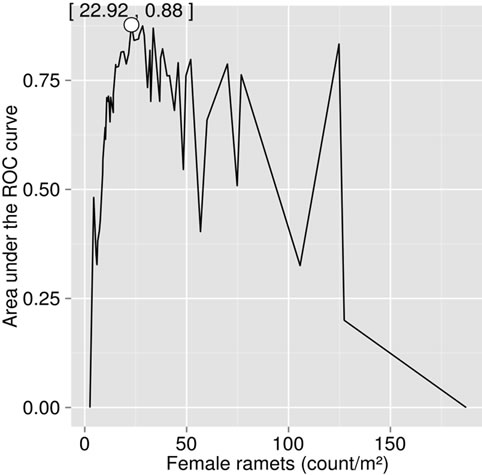
The ionome and fruit production varied widely between stands (Table 2). As a result, the dataset appeared to be appropriate for conducting ROC analysis. The maximal area under the curve was reached at 22.9 female ramets·m−2 (Figure 2(a)), corresponding to a yield of 3.8 g·m−2. The receiving operating characteristic (ROC)
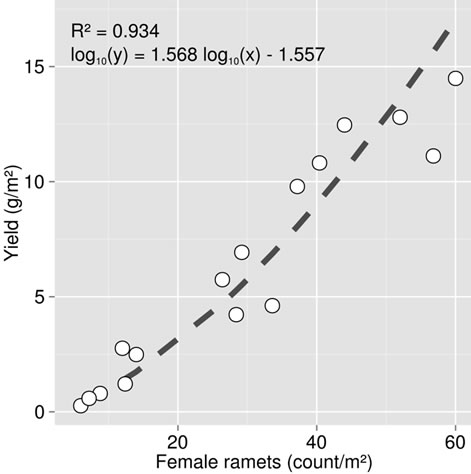
Figure 1. Relationship between cloudberry yields and counts of female ramets in Canadian bogs, based on data collected on experimental sites.
 (a)
(a)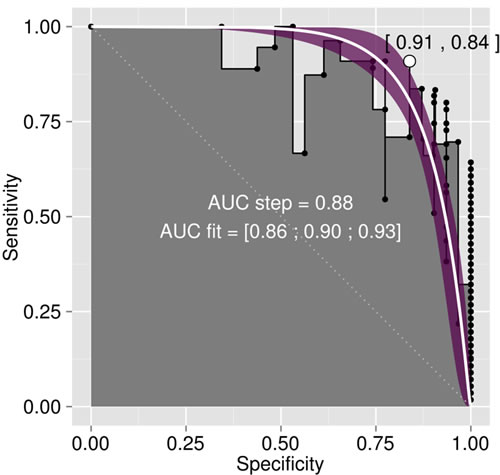 (b)
(b)
Figure 2. (a) Area under the ROC (receiving operating characteristic) curve (AUC) relating test sensitivity to specificity, as computed from the step curve, and (b) ROC curve corresponding to the maximum AUC.
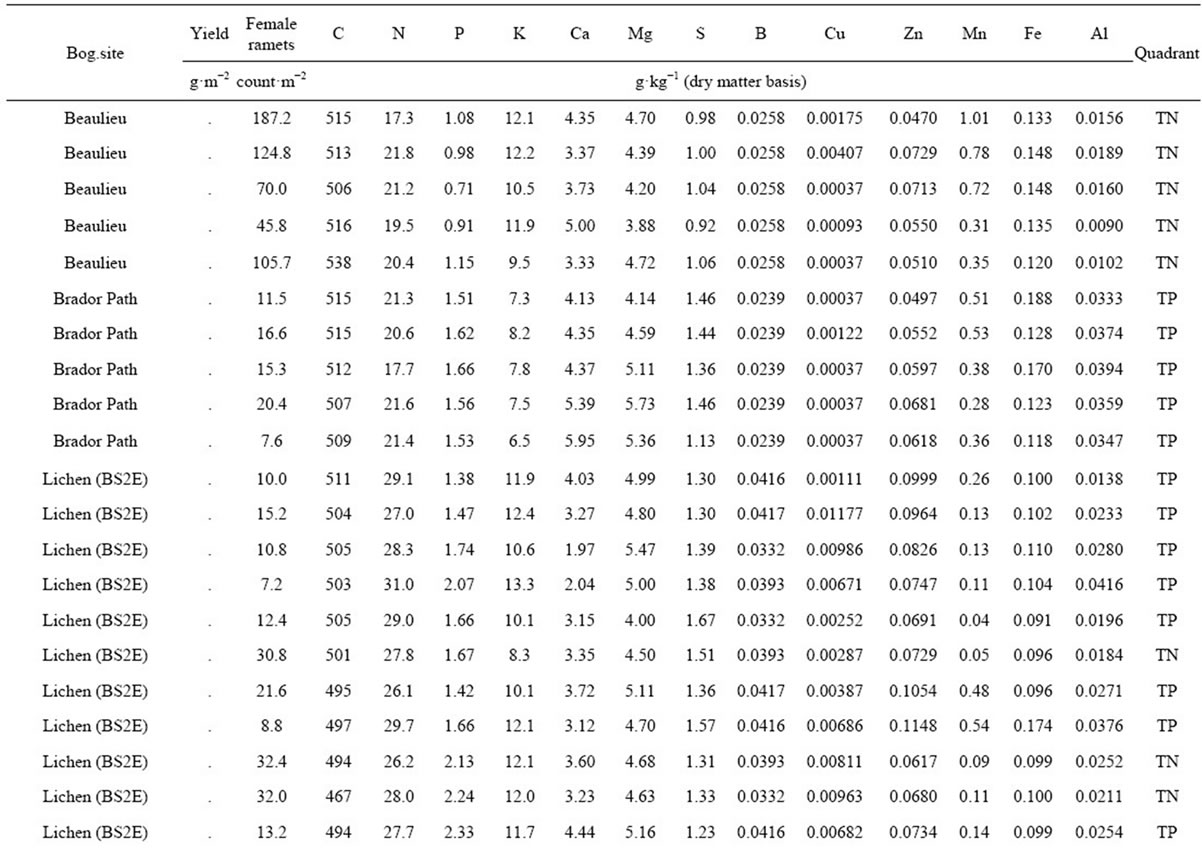
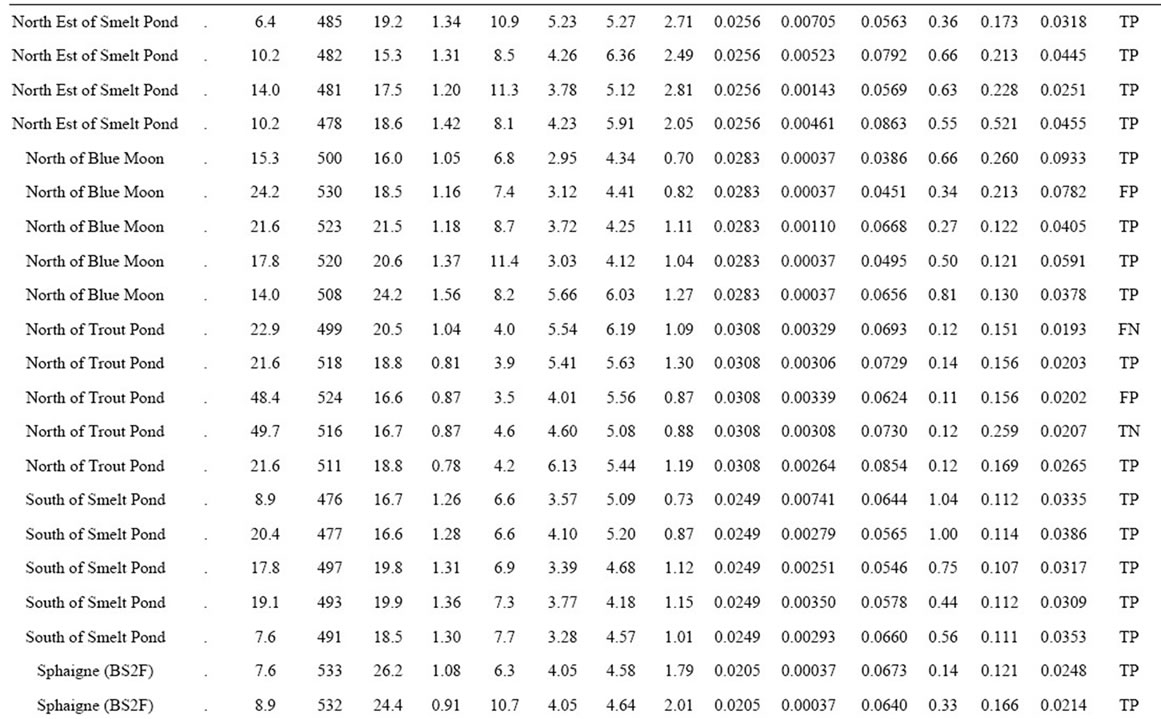
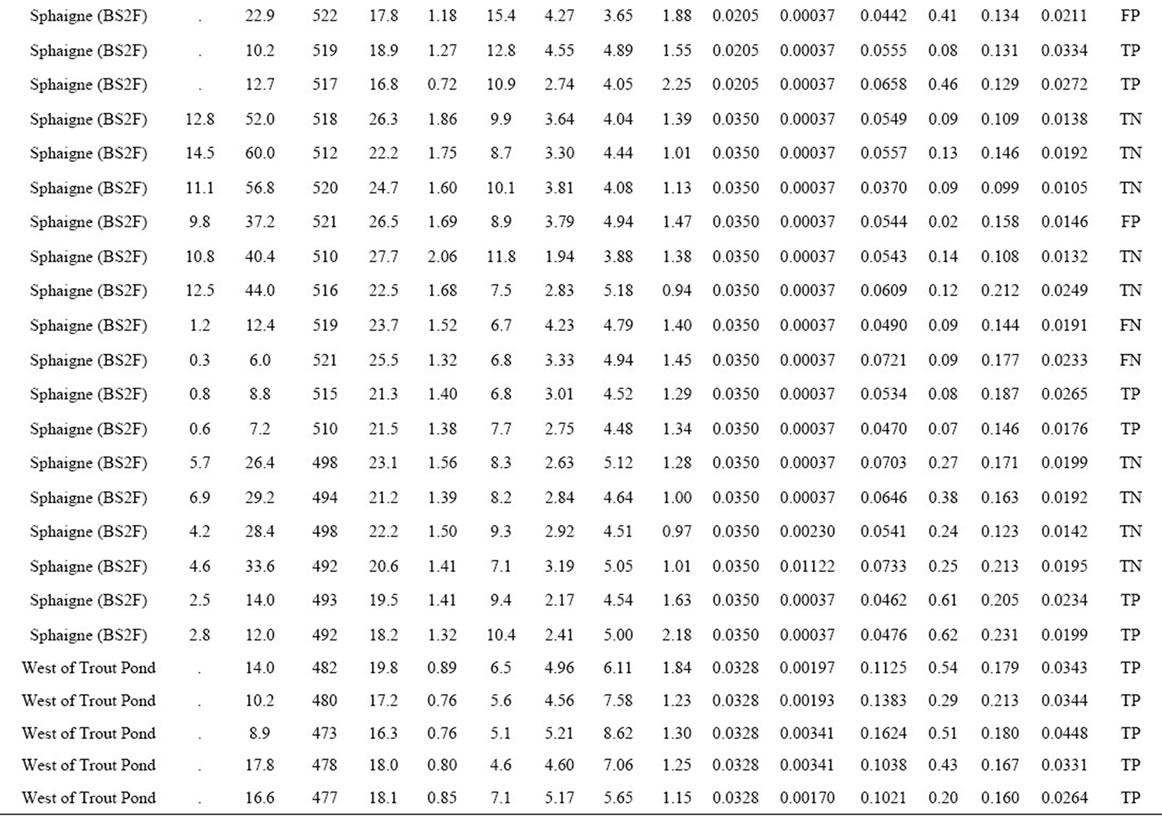
Table 2. Yield, female ramet counts and mineral composition in 86 natural cloudberry stands of the Quebec Lower North Shore of the St-Lawrence River, as well as their associated binary classification.
curve corresponding to this response delimiter is shown in Figure 2(b). The area under the ROC curve (AUC), as computed from the step curve, was 0.88, i.e. in the 0.05 confidence range of that computed using a binormal linear regression [53], i.e. [0.86; 0.93]. The maximum of Youden’s index was found at a specificity of 0.91 and a sensitivity of 0.84 (Figure 2(b)). The optimal predictor (Mahalanobis distance, ) delimiter corresponding to this point was 5.29. The binary classification is shown in Figure 3. There were 26 true negative (TN) and 50 true positive (TP) specimens, leaving 5 specimens as false negative (FN) and 5 specimens as false positive. The overall accuracy of the classification was 88%. The ilr medians of TN and TP specimens are presented in Table 3, while the covariance matrix of TN specimens used to compute
  is presented in Table 4. The quadrant attributed to each observation in shown in Table 2.
3.2. Pairwise Comparisons between Nutrient Balances in TN and TP Subpopulations
The balance contrasting Al and 12 nutrients was the most significantly different (p < 0.0001) between TN and TP specimens (Figure 4). Compared to TN specimens, there was a significant (p < 0.05) trend for TP specimens to accumulate relatively more minerals relatively to the filling value, more macronutrients relatively to B and more C and S relatively to N and P, as shown by positive differences in the [Fv | Elements], [B | S,Mg,Ca,K,P,N,C] and [P,N | S,C] balances. On the other hand, TN specimens accumulated significantly more macro-nutrients and B relatively to micronutrients. Moreover, the [S | C] balance of TN specimens was significantly more on
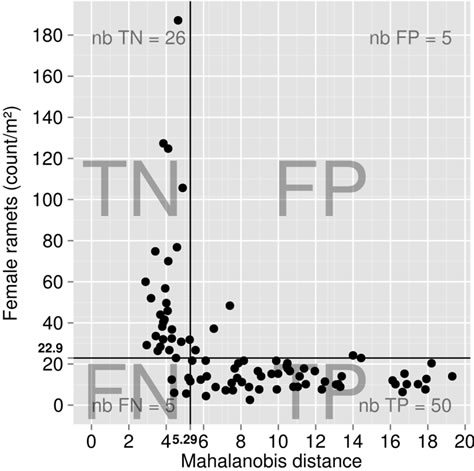
Figure 3. Binary classification across female ramet counts vs Mahalanobis distance of ilr balances, computed from the median of TN specimens, using the covariance of TN specimens. TN = true negative; FN = false negative; TP = true positive; FN = false positive.
Figure 4. Tukey test (p = 0.05) for ilr differences between true positive (TP) and true negative (TN) specimens in the calibration cloudberry data set. Differences are significant (p < 0.05) where they do not overlap zero. Differences tilting on the left side of the origin indicate that balances of TP specimen are lower than TN’s, i.e. that the left part of the balance (e.g. Al in [Al | Nutrients]) is more important in TP specimens than in TN’s, and inversely.
the C side than TPs’. While there were significant (p < 0.05) trends for other balances, linear discriminant analysis showed that [P,N | S,C] and [Al | Nutrients] were the most discriminating balances between TN and TP specimens (Figure 5).
Although N or P may often limit plant growth in natural environments [12,13], the N/P ratio ranged (p = 0.05) from 15.2 to 17.3 inlowand from 15.1 to 18.0 in highyielding specimens, i.e. ranges overlapped the narrow optimum range of 14 - 16 suggested by [12].
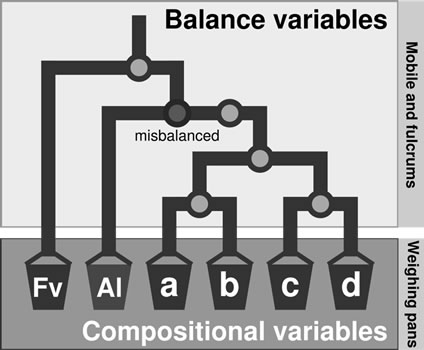
3.3. Nutrient Balance Diagnosis
Balances can be represented by a mobile diagram, with fulcrums and weighing pans, where nutrient concentrations in buckets impact directly on nutrient balances at fulcrums, hence avoiding conflicting results. The pan balance device (Figure 6) shows average ilr values of TN, TP, FN and FP specimens around the overall average at fulcrums. Back-transformed ilr to concentration values are shown in buckets (weighing pans) and in the underlying table.
While Al toxicity can be diagnosed by the [Al | Nutrients] balance, its importance can be appreciated in the Al bucket, where Al concentrations were higher in TP than in TN specimens.
4. Discussion
The ROC is a signal-to-noise, scale-invariant, measure
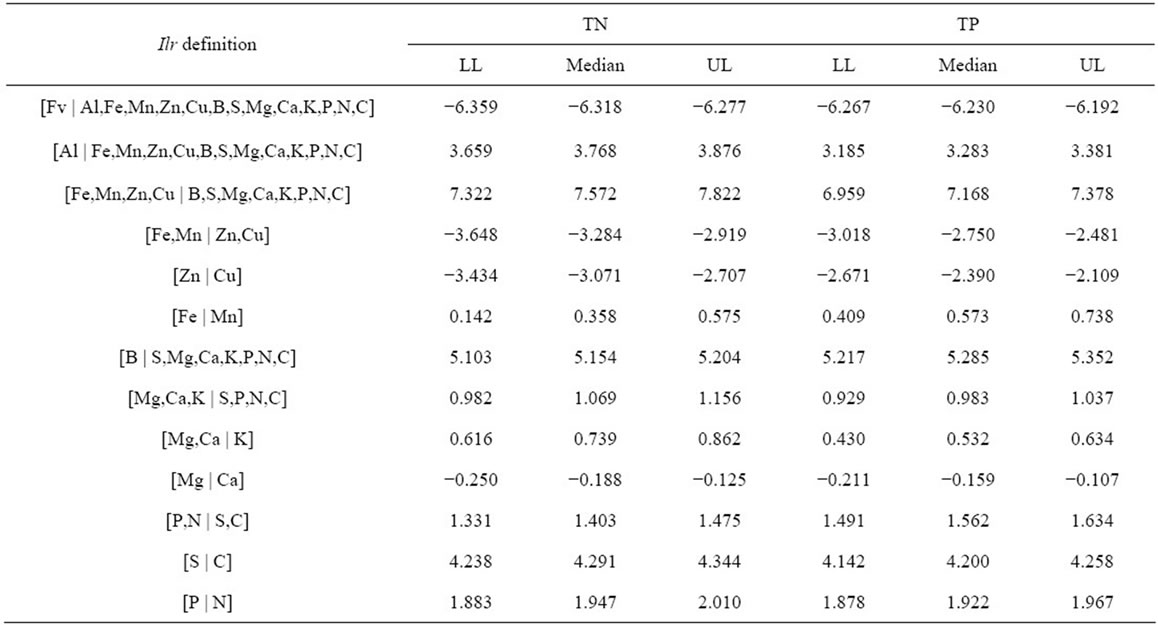
Table 3. The ilr medians of cloudberry stands classified as TN and TP.
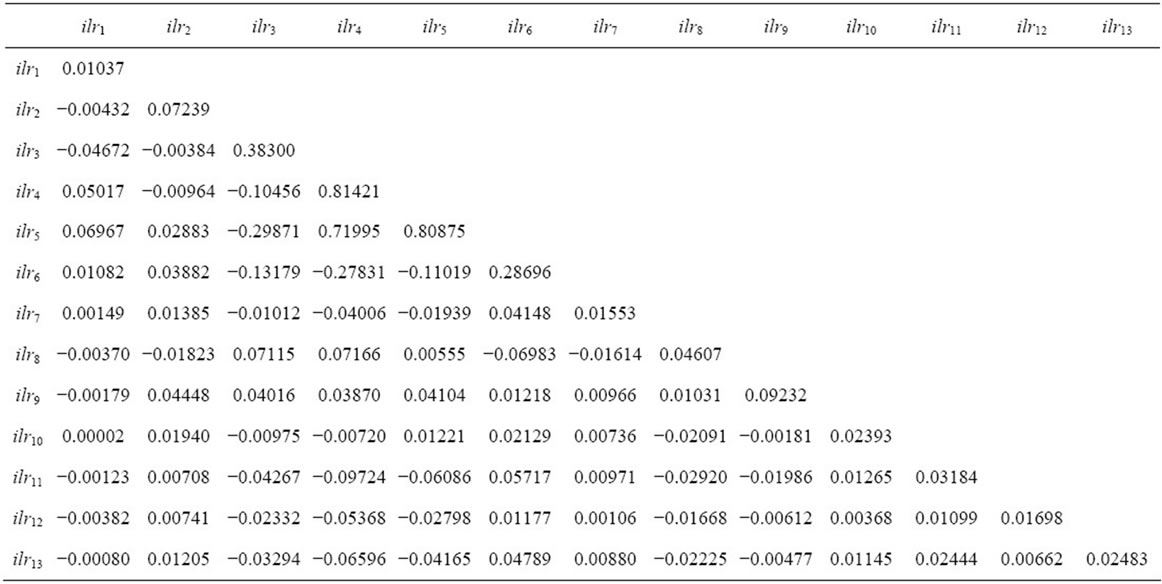
Table 4. Covariance matrix between ilr values of TN specimens used for the computation of the Mahalanobis distance (for definition of ilrs, see Table 1).
that is uninfluenced by decision biases and prior probabilities and that places performance of diverse systems on a common, easily interpreted, scale [46]. In comparison, DRIS divides survey data arbitrarily into highand low-yield subpopulations [29]) with no consideration of luxury consumption by false positive specimens. The area under the ROC curve for the selected response delimiter was 0.88, a value that appeared fairly high. In clinical biology, an AUC of 0.80 to 0.95 is considered informative [46]. The accuracy of the classification was 88%. By comparison, [47] found accuracies > 0.80 in assigning the Fe response status of a given Arabidopsis plant, based on its shoot ionome.
Cloudberry productivity in five stands diagnosed as FN
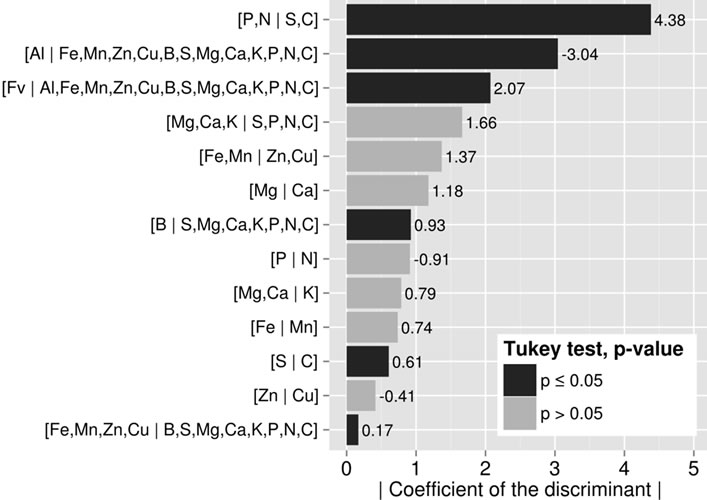
Figure 5. The larger the coefficient for balance, the more important is the role of the balance in the discriminant function that differentiates TN from TP specimens.
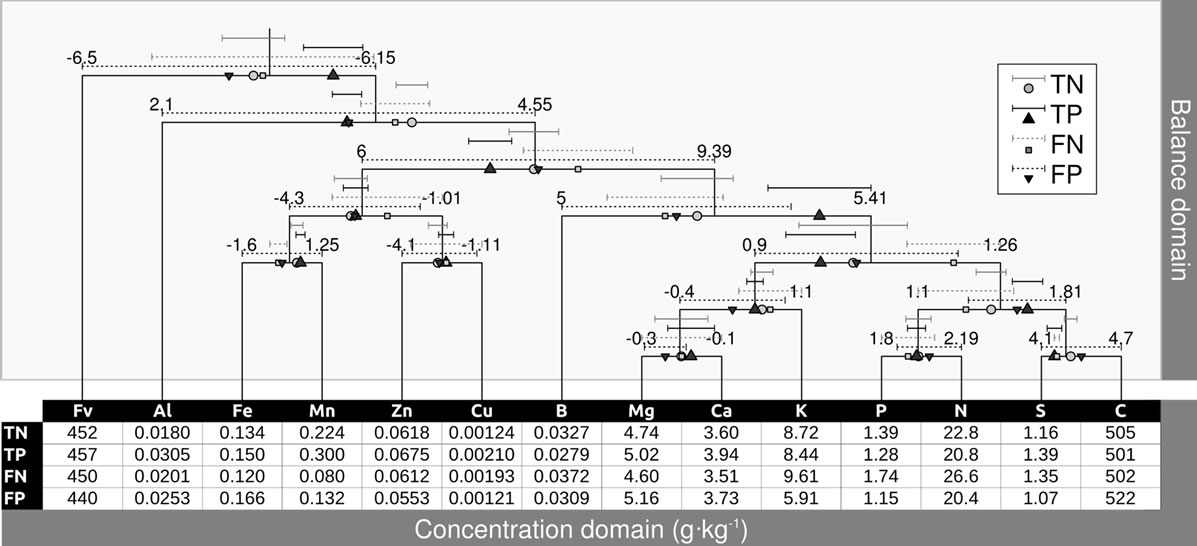
Figure 6. Mobile-and-fulcrums scheme of a balance system for the cloudberry mineral composition. Location of fulcrums is determined by the average ilr of all specimens. Departure from fulcrum indicate imbalance. Concentrations in g·kg−1 are located in buckets are back-transformed average ilr values for TN, TP, FN and FP specimens.
was apparently limited by factors other than plant nutrition such as night frosts that damage the flowers [54,55], as well as micro-climatic conditions, pollination success and competition that impact on flowering, fruit abortion and yield variability [54,56-58]. The five specimens located in FP may be inferred as cases of high C fixation capacity and K use efficiency. A proportion of 84% (26/31) of balanced specimen showed high productivity and 91% (50/55) of imbalanced specimen returned low productivity, indicating a major role of nutrient balances in sustaining berry productivity in the bogs.
The [P,N | S,C] and [Al | Nutrients] balances produced the largest discrepancy between TN and TP specimens. This exploratory analysis of cloudberry ionomes provided a starting point that identified Al and S as the most probable element misbalancing the ionome, hence limiting the productivity of TP specimens.
Imbalance in the C:S:N:P relationship described by the [P,N | S,C] balance may be symptomatic of sulfur biogeochemistry under various water saturating conditions occurring in bogs and possibly controlling H2S emissions and toxicity that may affect plant C fixation and protein metabolism. Our results show that the relationship between N and P, where the [P | N] balance did not differ significantly between TN and TP specimens, should be interpreted in the context of the C:S:N:P relationship driving plant metabolism.
The [Al | Nutrients] balance was the second most important balance discriminating between TN and TP, indicating relative intolerance to Al. The Al is considered as the primary growth limiting factor in acid soils, especially where base saturation is low due to relatively low soil Ca and Mg levels on cationic exchange capacity [59]. Low soil pH values, as found in oligotrophic bogs where cloudberry grows, can increase the solubility of Al3+, which is toxic to plants [19]. In oligotrophic bogs, Al may accumulate in the zone of water table fluctuation [7] near bog surface where rhizomes of cloudberry grow (circa 15 cm below soil surface). In TN specimens, Al concentration averaged 0.018 compared to 0.030 g·Al·kg−1 in TP specimens. The Al content normally varies between 0.050 and 0.400 g·Al·kg−1 in leaves [60], indicating very low tolerance of cloudberry to Al compared to other plants. However, because plant tolerance to Al may depend also on Al interactions with other minerals such as B, P, Ca and Mg [60], any critical Al concentration value must be interpreted with care, i.e. within the context of other elements rather than under the ceteris assumption that other elements (C, N, P, K, Ca, Mg, S, B, Cu, Zn, Mn, Fe) have equal effect across stands.
The pan balance approach relates concentration values in buckets to balances at fulcrums in a stand-alone mobile system (Figure 6). Statistical analysis and diagnoses are conducted in the balance domain, while as relative shortage, sufficiency or excess can be appreciated in the concentration domain. Departure from reference ilr values at fulcrums can be corrected by rebalancing concentration values in buckets. The mobile metaphor shows that the [Al | Nutrients] imbalance was prominent in TP specimens, as confirmed by the Tukey test (Figure 4) and might impact on other balances due to apparent Al toxicity. Indeed, B was inversely related to Al, presumebly resulting from B fixation in higher Al soils [60]. Increasing the importance of B in a specimen with an ionome located at the TP average (dark triangles in Figure 6) might rebalance [B | Macro-nutrients]. In the same manner, rebalancing [S | C] will affect [P,N | S,C] and so on for higher balance levels in the partition hierarchy. This complex system should be monitored interactively to quantify the effect of remedial actions on nutrient balances across the mobile. The [Fe,Mn,Zn,Cu | B,S,Mg,Ca, K,P,N,C] TP balance appeared significantly higher than TN’s, primarily because concentration of cationic micronutrients were higher in TP. This emphasizes diagnosing global imbalance and the balances first before evaluating the relative position of each concentration value compared to the reference.
Although Mn appeared at relatively low and N at relatively high levels in FN (Figure 6), its Mahalanobis distance from TN specimens was still lower than the preditor delimiter. On the other hand, K appeared at relatively low and C at relatively high level in FP specimens, indicating relatively high C fixation capacity as well as high K use efficiency compared to specimens in other quadrants.
Proper site selection [61] should include analyses of soil biologically active Al and S forms to avoid areas showing high risk of imbalance in ionomes and as a guide for site selection or remedial actions. Nutrient solution experiments and field trials are necessary to ascertain the effect of Al and S as well as other nutrient imbalances on crop productivity and suggest effective corrective measures to re-establish the mineral balance of cloudberry. Nutrient balances should be monitored regularly to interpret the effect of remedial actions on this complex system.
5. Conclusion
The design of orthogonal, physiologically functional and geochemically cloudberry sound balances allowed exploring the possible causes of elemental imbalance in ionomes of low-performing stands. The approach comprised a unbiased multivariate analysis of elemental balances based on the Mahalanobis distance between observations and a reference population determined using optimization techniques related to receiving operating characteristic (ROC) curves. A coherent pan balance system illustrated the complexity of elemental interactions in cloudberry stands using a mobile-fulcrumsbuckets mechanical device where concentration values influence ad hoc balances directly. The excessive level of Al and S in female ramets appeared to be the most important factors limiting cloudberry productivity. Nutrient solution experiments and field trials are necessary to ascertain the effect of Al and S for correcting measures on the mineral balance of cloudberry in oceanic bogs of Quebec-Labrador.
6. Acknowledgements
This research was funded by the Ministère de l’Agriculture, des Pêcheries et de l’Alimentation du Québec, the Ministère du Développement économique, de l’Innovation et de l’Exportation du Québec, the Conférence régionale des élus de la Côte-Nord, and the Natural Sciences and Engineering Research Council of Canada (NSERC-DG 2254).
REFERENCES
- D. E. Salt, I. Baxter and B. Lahner, “Ionomics and the Study of the Plant Ionome,” Annual Review of Plant Biology, Vol. 59, 2008, pp. 709-733. doi:10.1146/annurev.arplant.59.032607.092942
- M. K. Bozokalfa, B. Yagmur, H. Ilbi, D. Esiyok and S. Kavak, “Genetic Variability for Mineral Concentration of Eruca sativa L. and Diplotaxis tenuifolia L. Accessions,” Crop Breeding and Applied Biotechnology, Vol. 9, No. 4, 2009, pp. 372-381.
- H. M. El-Nashaar, G. M. Banowetz, S. M. Griffith, M. D. Casler and K. P. Vogel, “Genotypic Variability in Mineral Composition of Switchgrass,” Bioresource Technology, Vol. 100, No. 5, 2009, pp. 1809-1814. doi:10.1016/j.biortech.2008.09.058
- R. R. Brooks, “Indicator Plants for Mineral Prospecting —A Critique,” Journal of Geochemical Exploration, Vol. 12, 1979, pp. 67-78. doi:10.1016/0375-6742(79)90064-5
- P. C. Legittimo, L. Ducceschi and M. Martini, “Plant Species as Indicators of Geochemical Anomalies: Experiences on Ilex aquifolium (Holly),” Environmental Geology, Vol. 25, No. 2, 1995, pp. 114-118. doi:10.1007/BF00767867
- O. A. S. Usman and D. Omotayo, “Cassia Plant as Bioaccumulator of Trace Metals Sentivity to Lead and Manganese,” Best Journal, Vol. 4, No. 1, 2007, pp. 164-167.
- A. W. H. Damman, “Distribution and Movement of Elements in Ombrotrophic Peat Bogs,” Oikos, Vol. 30, 1979, pp. 480-495. doi:10.2307/3543344
- W. Naucke, A. L. Heathwaite, R. Eggelsmann and M. Shuch, “Mire Chemistry,” In: A. Heathwaite and K. Gottlich, Eds., Mires, Process, Exploration and Conservation, John Wiley and Sons, New York, 1990, pp. 263- 309.
- J. Kortesharju and E. M. Rantala, “Effect of Placement Fertilization on Cloudberry (Rubus chamaemorus L.) on Unditched Bog,” Suo, Vol. 31, No. 4,1980, pp. 85-92.
- M. Bellemare, L. Rochefort and L. Lapointe, “Rhizome Sectioning and Fertilization Increase the Productivity of Cloudberry in Natural Peatlands,” Canadian Journal of Plant Science, Vol. 89, No. 3, 2009, pp. 521-526. doi:10.4141/CJPS08078
- V. Hebert-Gentile, S. K. Naess, L. E. Parent and L. Lapointe, “Organo-Mineral Fertilization in Natural Peatlands of the Quebec North-Shore, Canada: Dispersion in Soil and Effects on Cloudberry Growth and Fruit Yield,” Acta Agriculturae Scandinavica Section B: Soil Plant Science, Vol. 61, No. 1, 2011, pp. 8-17. doi:10.1080/09064710.2011.603739
- R. Aerts and F. S. Chapin III, “The Mineral Nutrition of Wild Plants Revisited: A Re-Evaluation of Processes and Patterns Research,” Advances in Ecological Reserach, Vol. 30, 1999, pp. 1-67. doi:10.1016/S0065-2504(08)60016-1
- S. Gusewell, “N:P Ratios in Terrestrial Plants: Variation and Functional Significance,” New Phytologist, Vol. 164, No. 2, 2004, pp. 243-266. doi:10.1111/j.1469-8137.2004.01192.x
- T. C. Marks and K. Taylor, “The Mineral Nutrient Status of Rubus chamaemorus L. in Relation to Burning and Sheep Grazing,” Journal of Applied Ecology, Vol. 9, 1972, pp. 501-511. doi:10.2307/2402448
- J. Ågren, “Sexual Differences in Biomass and Nutrient Allocation in the Dioecious Rubus chamaemorus,” Ecology, Vol. 69, 1988, pp. 692-697. doi:10.2307/1941251
- S. Saebo, “The autecology of Rubus chamaemorus L. I. Phosphorus Economy of Rubus chamaemorus in an Ombrotrophic Mire,” Meldinger fra Norges Landbrukshogskole, Vol. 47, 1968, pp. 1-67.
- S. Saebo, “The Autecology of Rubus chamaemorus L. II. Nitrogen Economy of Rubus chamaemorus in an Ombrotrophic Mire,” Meldinger fra Norges Landbrukshogskole, Vol. 49, 1970, pp. 1-37.
- J. L. Walworth and M. E. Sumner, “The Diagnosis and Recommendation Integrated System (DRIS),” Advances in Soil Science, Vol. 6, 1987, pp. 149-188. doi:10.1007/978-1-4612-4682-4_4
- H. Marschner, “Mineral Nutrition of Higher Plants,” Academic Press, Boston, 1995, p. 889.
- G. G. C. da Silva, J. C. L. Neves, V. H. Alvarez V. and F. P. Leite, “Nutritional Diagnosis for Eucalypt by DRIS, M-DRIS, and CND,” Scientia Agricola, Vol. 61, No. 5, 2004, pp. 507-515. doi:10.1590/S0103-90162004000500008
- F. Blanco-Macias, R. Magallanes-Quintanar, R. D. Valdez-Cepeda, R. Vazquez-Alvarado, E. Olivares-Saenz, E. Gutierrez-Ornelas and J. A. Vidales-Contreras, “Comparison between CND Norms and Boundary-Line Approach Nutrient Standards: Opuntia ficus-indica L. Case,” Revista Chapingo. Serie Horticultura, Vol. 15, No. 2, pp. 217-223.
- H. Huang, C. X. Hu, Q. Tan, X. Hu, X. Sun and L. Bi, “Effects of Fe-EDDHA Application on Iron Chlorosis of Citrus Trees and Comparison of Evaluations on Nutrient balance with Three Approaches,” Scientia Horticulturae, Vol. 146, 2012, pp. 137-142. doi:10.1016/j.scienta.2012.08.015
- J. Aitchison and M. Greenacre, “Biplots of Compositional Data,” Journal of the Royal Statistical Society Series C Applied Statistics, Vol. 51, No. 4, 2002, pp. 375-392. doi:10.1111/1467-9876.00275
- L. E. Parent and M. Dafir, “A Theoretical Concept of Compositional Nutrient Diagnosis,” Journal of American Society for Horticultural Science, Vol. 117, 1992, pp. 239-242.
- J. Aitchison, “The Statistical Analysis of Compositional Data,” Chapman and Hall, London, 1986, p. 416. doi:10.1007/978-94-009-4109-0
- L. E. Parent, W. Natale and N. Ziadi, “Compositional Nutrient Diagnosis of Corn Using the Mahalanobis Distance as Nutrient Imbalance Index,” Canadian Journal of Soil Science, Vol. 89, No. 4, 2009, pp. 383-390. doi:10.4141/cjss08050
- D. A. Holland, “The Interpretation of Leaf Analysis,” Journal of Horticultural Science, Vol. 41, 1966, pp. 311- 329.
- W. X. Han, J. Y. Fang, P. B. Reich, F. I. Woodward and Z. H. Wang, “Biogeography and Variability of Eleven Mineral Elements in Plant Leaves across Gradients of Climate, Soil and Plant Functional Type in China,” Ecology Letters, Vol. 14, No. 8, 2011, pp. 788-796. doi:10.1111/j.1461-0248.2011.01641.x
- E. R. Beaufils, “Diagnosis and Recommendation Integrated System (DRIS),” University of Natal, Pietermaritzburg, 1973.
- P. Filzmoser, K. Hron and C. Reimann, “Univariate Statistical Analysis of Environmental (Compositional) Data: Problems and Possibilities,” Science of the Total Environment, Vol. 407, No. 23, 2009, pp. 6100-6108. doi:10.1016/j.scitotenv.2009.08.008
- J. J. Egozcue, V. Pawlowsky-Glahn, G. Mateu-Figueras and C. Barcelo-Vidal, “Isometric Logratio Transformations for Compositional Data Analysis,” Mathematical Geology, Vol. 35, No. 3, 2003, pp. 279-300. doi:10.1023/A:1023818214614
- S. É. Parent, L. E. Parent, D. E. Rozane, A. Hernandes and W. Natale, “Nutrient Balance as Paradigm of Soil and Plant Chemometrics,” In: R. N. Issaka, Ed., Soil Fertility, Intech, 2012, pp. 83-114.
- J. J. Egozcue and V. Pawlowsky-Glahn, “Groups of Parts and Their Balances in Compositional Data Analysis,” Mathematical Geology, Vol. 37, No. 7, 2005, pp. 795- 828. doi:10.1007/s11004-005-7381-9
- L. E. Parent, “Diagnosis of the Nutrient Compositional Space of Fruit Crops,” Revista Brasileira de Fruticultura, Vol. 33, No. 1, 2011, pp. 321-334. doi:10.1590/S0100-29452011000100041
- L. E. Parent, S. É. Parent, D. E. Rozane, D. A. Amorim, A. Hernandes and W. Natale, “Unbiased Approach to Diagnose the Nutrient Status of Red Guava (Psidium guajava),” In: Acta Horticulturae (ISHS): III International Symposium on Guava and other Myrtaceae, Petrolina, 2012.
- S. Marchand, S. É. Parent, J. P. Deland and L. E. Parent, “Nutrient Signature of Quebec (Canada) Cranberry (Vaccinium macrocarpon Ait.),” Revista Brasileira de Fruticultura, Vol. 35, No. 1, 2013 (in press).
- S.-É. Parent, L. E. Parent, J. J. Egozcue, D.-E. Rozane, A. Hernandes, L. Lapointe, V. Hébert-Gentile, K. Naess, S. Marchand, J. Lafond, D. Mattos, P. Barlow and W. Natale, “The Plant Ionome Revisited by the Nutrient Balance Concept,” Frontiers in Plant Science, Vol. 4, 2013, p. 39. doi:10.3389/fpls.2013.00039
- J. Beaulieu, B. Otrysko and L. Lapointe, “Note Sur l’Histoire Naturelle de la Chicoute (Rubus Chamemorus L.),” Naturaliste Canadien, Vol. 125, No. 2, 2001, pp. 17-21.
- R. Barnhisel and P. M. Bertsch, “Digestion with Perchloric and Nitric Acids,” In: A. Page, Ed., Methods of Soil Analysis, American Society of Agronomy, Madison, 1982, pp. 279-280.
- G. R. Rout, S. Samantaray and P. Das, “Aluminium Toxicity in Plants: A Review,” Agronomie, Vol. 21, No. 1, 2001, pp. 3-21. doi:10.1051/agro:2001105
- E. Malavolta, “Manual de Nutricao de Plantas,” Sao Paulo, Brazil, 2006.
- I. Loladze and J. J. Elser, “The Origins of the Redfield Nitrogen-to-Phosphorus Ratio Are in a Homoeostatic Protein-to-rRNA Ratio,” Ecology Letters, Vol. 14, No. 3, 2011, pp. 244-250. doi:10.1111/j.1461-0248.2010.01577.x
- F. J. Stevenson, “Cycles of Soil: Carbon, Nitrogen, Phosphorus, Sulfur, Micronutrients,” Wiley Interscience, New York, 1986.
- M. C. Rabenhorst and D. Swanson, “Histosols,” In: M. Sumner, Ed., Handbook of Soil Science, CRC Press, Boca Raton, 2000, pp. E183-E209.
- C. Urquhart and A. J. P. Gore, “The Redox Characteristics of Four Peat Profiles,” Soil Biology and Biochemistry, Vol. 5, No. 5, 1973, pp. 659-672. doi:10.1016/0038-0717(73)90056-4
- J. A. Swets, “Measuring the Accuracy of Diagnostic Systems,” Science, Vol. 240, No. 4857, 1988, pp. 1285-1293. doi:10.1126/science.3287615
- I. R. Baxter, O. Vitek, B. Lahner, B. Muthukumar, M. Borghi, J. Morrissey, M. L. Guerinot and D. E. Salt, “The Leaf Ionome as a Multivariable System to Detect a Plant’s Physiological Status,” Proceedings of the National Academy of Sciences of the United States of America, Vol. 105, No. 33, 2008, pp. 12081-12086. doi:10.1073/pnas.0804175105
- W. J. Youden, “Index for Rating Diagnostic Tests,” Cancer, Vol. 3, No. 1, 1950, pp. 32-35. doi:10.1002/1097-0142(1950)3:1<32::AID-CNCR2820030106>3.0.CO;2-3
- R. D. C. Team, “R: A Language and Environment for Statistical Computing,” In: R. T. D. Core, Ed., Foundation for Statistical Computing, 2011.
- K. G. van den Boogaart, R. Tolosana-Delgado and M. Bren, “‘Compositions’: Compositional Data Analysis in R Package, R Package Version 1.30.1,” 2013.
- J. A. Martin-Fernandez, J. Palarea-Albaladejo and R. A. Olea, “Dealing with Zeroes,” In: V. Pawlowsky-Glahn and A. Buccianti, Eds., Compositional Data Analysis: Theory and Applications, John Wiley and Sons, New York, 2011, pp. 43-58.
- B. Ripley, B. Venables and K. Hornik, “Support Functions and Datasets for Venables and Ripley’s MASS, R Package Version 7.3-23,” 2013.
- J. A. Hanley, “The Robustness of the ‘Binormal’ Assumptions Used in Fitting ROC Curves,” Medical Decision Making, Vol. 8, No. 3, 1988, pp. 197-203. doi:10.1177/0272989X8800800308
- V. F. Yudina, “Phenological Development and Yields of Cloudberry (Rubus chamaemorus) in Karelia, Russia,” Acta Botanica Fennica, Vol. 149, 1993, pp. 7-10.
- J. Kortesharju, “Effects of Frost on the Female Flowers, Unripe Fruits and Vegetative Growth of the Cloudberry (Rubus chamaemorus) in Finnish Lapland,” Aquilo Serie Botanica, Vol. 35, 1995, pp. 31-38.
- K. Rapp and K. Steenberg, “Studies of Phosphorus Uptake from Different Depths in Cloudberry Mires Using P32-Labelled Fertilizer,” Acta Agricultura Scandinavica, Vol. 27, No. 4, 1977, pp. 319-325. doi:10.1080/00015127709435145
- J. Kortesharju, “Cloudberry Yields and Factors Affecting the Yield in Northern Finland,” Acta Botanica Fennica, Vol. 136, 1988, pp. 77-80.
- K. Rapp, “Cloudberry Growers Guide,” Tromso, 2004.
- F. Vardar and M. Unal, “Aluminum Toxicity and Resistance in Higher Plants,” Advances in Molecular Biology, Vol. 1, 2007, pp. 1-12.
- [61] W. Bergmann, “Ernährungsstörungen bei Kulturpflanzen,” G. F. Verlag, Ed., 1986, p. 614.
- [62] G. Théroux, L. Rochefort and L. Lapointe, “Cloudberry Cultivation in Cutover Peatlands: Hydrological and Soil Physical Impacts on the Growth of Different Clones and Cultivars,” Mires and Peat, Vol. 5, No. 6, 2009, pp. 1-16.
Graphical Abstract
Plant nutrient balance represented bymobile-fulcrumsbuckets mechanical device, indicating low plant tolerance to Al in low-productivity cloudberry stands
• Highlights
• Because D mineral components and their dual ratios have matrix rank of D-1, they lead to numerical biases in the multivariate diagnosis of plant ionomes as bioindicators of geochemical properties of the immediate soil environment.
• A mobile-fulcrums-buckets mechanical device shows coherently and without numerical bias the relationships between mineral concentrations as D-1 ad hoc balances.
• The critical Mahalanobis distance between true negative (balanced and highly productive) and true positive (imbalanced and of low productivity) specimens corresponded to an area under the receiving operating characteristic (ROC) curve of 0.88, indicating fairly high test performance.
• Low productivity of cloudberry stands is likely due to low tolerance to Al imbalanceand this could be used as criterion for site selection.
Abbreviations
AUC, area under the ROC curve; ilr, isometric log ratio; FN, false negative; FP, false positive; , Mahalanobis distance; ROC, receiving operating characteristics; SBP, sequential binary partition; TN, true negative, TP, true positive.
NOTES
*Corresponding author.